

The DOI matches its Crossref record; 44 of the 44 references it cites were found in a registry or an index; 10 of the 34 sources its claims cite were checked for support.
Multi-environment trials data analysis: linear mixed model-based approaches using spatial and factor analytic models
Open accessAbstract
The analysis of multi-environment trials (MET) data in plant breeding and agricultural research is inherently challenging, with conventional ANOVA-based methods exhibiting limitations as the complexity of MET experiments grows. This study presents linear mixed model-based approaches for MET data analysis. Ten MET grain yield datasets from national variety trials in Ethiopia were used. Randomized complete block (RCB) design analysis, spatial analysis, and spatial+genotype-by-environment (G × E) analysis were compared under linear mixed model framework. Spatial analysis detected significant local, global, and extraneous spatial variations, with positive spatial correlations. For the spatial + G × E analysis, increasing the order of the factor analytic (FA) models improved the explanation of G × E variance, though the optimal FA model order was dataset-dependent. Integrating spatial variability through the spatial + G × E modeling approach substantially improved genetic parameter estimates and minimized residual variability. This improvement was particularly notable in larger datasets, where the number of trials and the size of each trial played a crucial role for presence of spatial variability and strong GxE effects. Additionally, the genetic correlation heat maps and dendrograms provided intuitive insights into trial relationships, revealing patterns of strong positive, negative, and weak correlations, as well as distinct trial clusters. The results clearly demonstrate that linear mixed model-based approaches, especially the spatial + G × E analysis excel in capturing complex spatial plot variation and G × E effects in MET data by effectively integrating spatial and FA models. These insights have important implications for improving the efficiency and accuracy of MET data analysis, which is crucial for improving genetic gain estimation in plant breeding and agricultural research, ultimately accelerating the delivery of high-performing crop varieties to farmers and consumers.
Overview
CoChat Summary
TL;DR
This study compares RCB, spatial, and spatial + G×E linear mixed model analyses on 10 Ethiopian multi-environment grain yield datasets, showing that spatial + factor analytic G×E models better capture spatial variation and G×E and improve genetic parameter estimates. The optimal factor analytic model order was dataset-dependent, and improvements were most pronounced in larger datasets.
Key findings
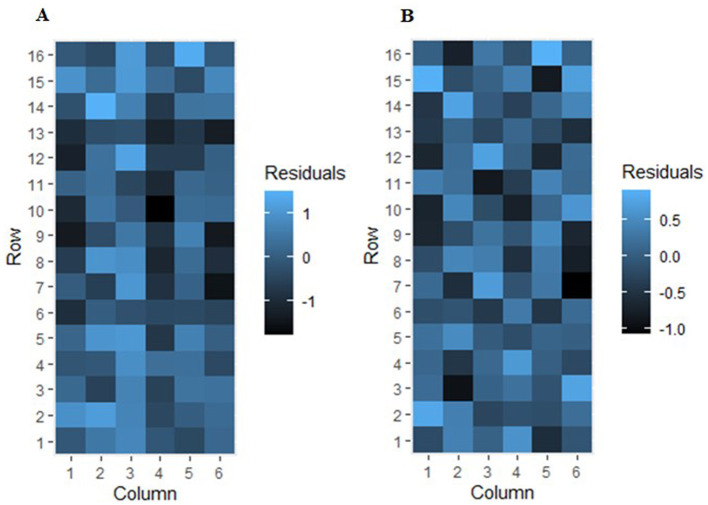
- Spatial analysis detected significant local, global, and extraneous spatial variation, with positive estimated AR1 correlations: ρcr = (0.28, 0.31); ρc = 0.56; ρr = 0.50.
- Increasing the FA model order improved the percentage of G×E variance explained; final models ranged from FA-2 to FA-6, with examples including SCB14-16 FA-2 = 100%, BCB15-18 FA-6 = 93.4%, DCP16-18 FA-4 = 92.2%, IHMZ20 FA-3 = 88.2%, DCP14-16 FA-3 = 87.6%, LCB19-20 FA-3 = 80.8%, LCB14-16 FA-3 = 80.0%, SCB19-20 FA-3 = 78.6%, BWT19-20 FA-4 = 69.1%, and ACB14-16 FA-5 = 65.1%.
- Spatial + G×E improved genetic variance estimates and reduced error variance relative to RCB and spatial analyses: genetic variance ranges were RCB 0.050–0.984, spatial 0.049–1.009, and spatial + G×E 0.052–1.057; error variance ranges were RCB 0.072–1.746, spatial 0.065–1.571, and spatial + G×E 0.061–1.568.
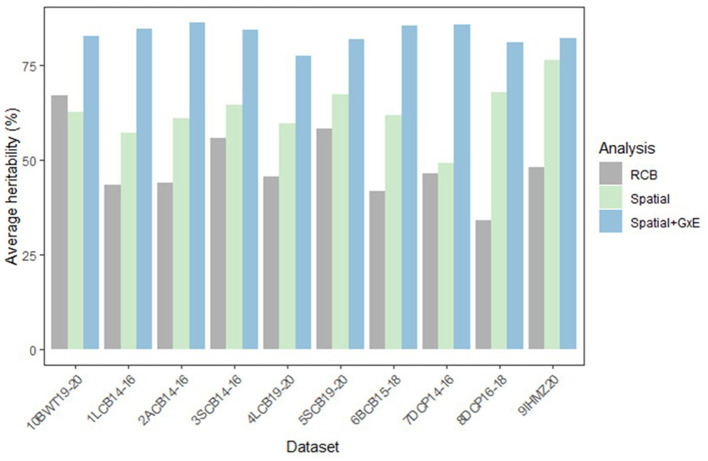
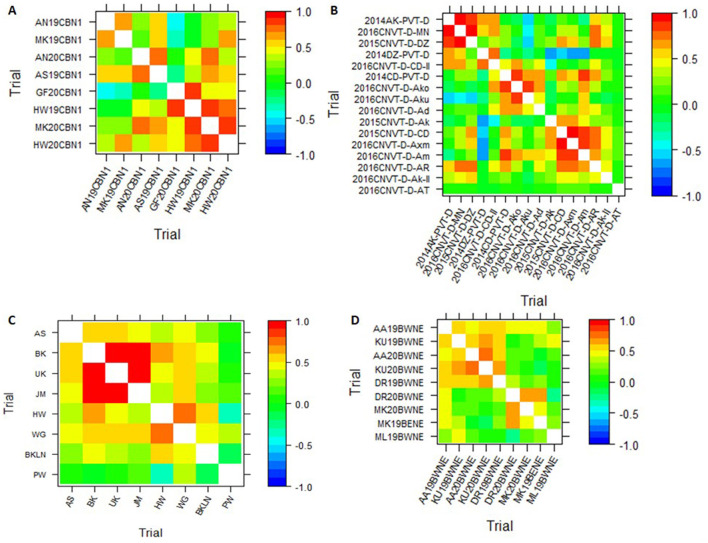
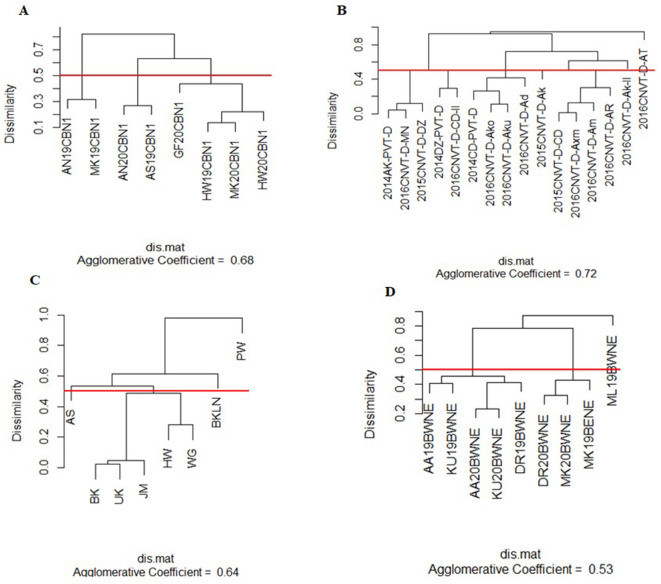
- Heritability estimates were higher for spatial than RCB and further improved by spatial + G×E across all datasets; improvements were larger in larger datasets such as DCP14-16 (16 trials, 27 entries) and LCB19-20 (8 trials, 117 entries) than in smaller datasets such as LCB14-16 (8 trials, 16 entries) and IHMZ20 (8 trials, 32 entries). Heat maps and dendrograms showed strong positive, negative, and weak correlations and distinct trial clusters: three clusters in SCB19-20 and BWT19-20, four in IHMZ20, and five in DCP14-16.
Methods
- Ten MET grain yield datasets from Ethiopian Institute of Agricultural Research national variety trials for common bean, chickpea, wheat, and maize, conducted 2014–2020 in RCB designs; grain yield was measured in tons per hectare, with 8–16 environments, 16–117 entries, and both complete and incomplete datasets.
- Compared RCB, spatial, and spatial + G×E analyses under linear mixed models; spatial models used separable AR1 row/column structures for local, extraneous, and global variation; G×E was modeled with factor analytic (FA) models, comparing FA-h vs. FA-h+1 via REMLRT and percentage of G×E variance explained.
- Estimation used REML, BLUE for fixed effects, BLUP for random effects, Wald and REMLRT tests, and heritability via Cullis et al. (2006); all models were fitted in ASReml-R.
Limitations
- Stated in the paper: the optimal FA model order was dataset-dependent; ACB14-16 had significant FA-2 and FA-5 but non-significant intermediate FA-3 and FA-4, and LCB14-16 FA-3 explained 80.0% of G×E variance but was not statistically significant. The paper also notes that poorly distributed trials and target population of environments misalignment can complicate MET analysis, and that more data does not inherently ensure advanced methods outperform conventional approaches; effectiveness depends on the presence of spatial variability or strong G×E.
- Evident from the text: no explicit limitations section is provided; analyses are restricted to 10 Ethiopian NVT datasets for four crops from 2014–2020, so generalizability to other crops, regions, or trial designs is not demonstrated. No simulation or independent validation is reported, and some datasets are small (e.g., LCB14-16 with 16 entries; IHMZ20 with 32 entries), where improvements were less pronounced.
Model-written summary. Check it against the paper before relying on it.
Integrity signals
Registry
Cites
Statistics
Figures
Verification
Claims the paper makes
9 Valid · 0 Not valid · 12 Not checked · 64 Own results and interpretations
Every source the paper cites for this claim was checked and supports it.
In the paper
“Additionally, these methods may fail to adequately account for non-genetic sources of variance associated withenvironmental factors or experimental design effects, which can significantly influence the observed phenotypic performance (Smith et al., 2005).”
§ Multi-environment trials data analysis: linear mixed model-based approaches using spatial and factor analytic models > 1 Introduction
What the sources say
- Supportedcites Smith et al., 2005 source
The Variance component mixed models section says classical ANOVA-type models can have unrealistic variance assumptions and fail to explore patterns of variety-by-environment interaction. The Models for residual effects section adds that simple block models often fit poorly, can produce misleading interaction effects, and may need spatial modelling to accommodate field variation. Together these support the qualified claim that such methods may inadequately account for environmental and design-related variation affecting observed performance (page numbers unavailable in our copy). (LLM, conf=0.89)
hedgedstates an association- Asserted: passes — The authors put it forward as true.
- Checkable: passes — It can be checked against evidence.
- Load-bearing: passes — The paper’s conclusions depend on it.
- Based: passes — The paper gives a reason why it holds.
- Supported
The cited sources support only part of this claim — read each source’s verdict below.
In the paper
“Furthermore, the ANOVA-based analysis commonly follows a two-stage modeling approach. This involves first analyzing the data within each environment, followed by a second stage of combining the results across environments for the G × E interaction analysis (Piepho et al., 2012; Smith et al., 2005).”
§ Multi-environment trials data analysis: linear mixed model-based approaches using spatial and factor analytic models > 1 Introduction
What the sources say
- Not checked — no full text of the sourcecites Piepho et al., 2012 source
- Partly supportedcites Smith et al., 2005 sourceExperimental — accuracy not yet measured
The Additional information section (page unavailable) says many authors use a two-stage approach: they analyze individual trials, then combine variety means for an overall analysis. It describes that second stage as a mixed-model analysis, however, and does not establish that ANOVA-based analysis commonly follows this procedure. (LLM, conf=0.82)
plain- Asserted: passes — The authors put it forward as true.
- Checkable: passes — It can be checked against evidence.
- Load-bearing: passes — The paper’s conclusions depend on it.
- Based: passes — The paper gives a reason why it holds.
The sources with a verdict support this claim; the rest weren’t checked yet, have no full text we could read, or their verdicts aren’t rated yet.
In the paper
“The observed patterns of strong positive, negative, and weak correlations in the heat maps (Figure 3), as well as the distinct trial clusters identified in the dendrograms (Figure 4), reflect the complex structure of the G × E interactions, as discussed in previous studies (Cullis et al., 2010; Argaw et al., 2024).”
§ Multi-environment trials data analysis: linear mixed model-based approaches using spatial and factor analytic models > 4 Discussion
What the sources say
- Not checked — no full text of the sourcecites Cullis et al., 2010 source
- Supportedcites Argaw et al., 2024 source
The Results (‘The Spatial+FA analysis’) describe highly correlated trials for some traits, weak correlations for yield, and strong negative yield correlations for particular trials. The same section identifies distinct trial clusters and says yield could have high genotype-by-environment interaction effects. The citing paper’s figure numbers refer to its own figures, not those in Argaw et al. (LLM, conf=0.93)
plainstates an association- Asserted: passes — The authors put it forward as true.
- Checkable: passes — It can be checked against evidence.
- Load-bearing: unclear — It is unclear whether the paper’s conclusions depend on it.
- Based: passes — The paper gives a reason why it holds.
The cited sources support only part of this claim — read each source’s verdict below.
In the paper
“Misalignment between trial locations and the intended target environments can result in inaccurate assessments of genotypic performance (Cooper et al., 2020, 2021; Hajjarpoor et al., 2022).”
§ Multi-environment trials data analysis: linear mixed model-based approaches using spatial and factor analytic models > 4 Discussion
What the sources say
- Not matchedcites Cooper et al., 2020, 2021
Couldn’t be matched to a paper in Crossref, so it can’t be checked.
- Supportedcites Hajjarpoor et al., 2022 sourceExperimental — accuracy not yet measured
Section 2.1 states that trial environments may fail to represent the stress conditions across the target population of environments, causing selection to favor genotypes that are not optimal for that target. This supports the claim that misaligned trial locations can lead to inaccurate assessments of genotypic performance. (LLM, conf=0.93)
plainstates a possible cause- Asserted: passes — The authors put it forward as true.
- Checkable: passes — It can be checked against evidence.
- Load-bearing: unclear — It is unclear whether the paper’s conclusions depend on it.
- Based: passes — The paper gives a reason why it holds.
- Not matched
A result the paper reports from its own data — it cites no other source for it, so there is none to check. The quote shows it is in the paper.
In the paper
“In terms of global linear spatial trends, these were found to be significant along both the row and column dimensions for the trial 2015CNVT-D-CD (p = 0.007 and p = 0.017, respectively)”
§ Multi-environment trials data analysis: linear mixed model-based approaches using spatial and factor analytic models > 3 Results > 3.1 Spatial analysis
plainSingle case ·- Asserted: passes — The authors put it forward as true.
- Checkable: passes — It can be checked against evidence.
- Load-bearing: unclear — It is unclear whether the paper’s conclusions depend on it.
- Based: passes — The paper gives a reason why it holds.
- Rests on 2 assumptions not shown here.
44 more claims
Create a free account to see all 85 claims and every source verdict.
- Probably not a substantial claim. 12
- It may state two separate claims as one. 28
Self-check
Percentages, sums and reported differences re-computed from the paper’s own numbers.
Each contradiction between two passages listed here was confirmed by an independent check.
Rated minor: it would not touch a result — a value no result rests on, a p-value that stays on the same side of the significance level, or a conflict that is clerical, resolved elsewhere in the paper, or outside its own findings.
In the paper
§ Multi-environment trials data analysis: linear mixed model-based approaches using spatial and factor analytic models > 3 Results > 3.2 Spatial + G × E analysis
“Additionally, the heat map reveals strong negative correlations between certain trials, represented by the deep blue shading. This is particularly evident in the DCP14-16 dataset (Figure 4B).”
§ Multi-environment trials data analysis: linear mixed model-based approaches using spatial and factor analytic models > 3 Results > 3.2 Spatial + G × E analysis
“Figure: Figure 4 Dendrogram representation of the dissimilarity matrix from spatial+G×E analysis for the datasets SCB19-20 (A), DCP14-16 (B), IHMZ20 (C), and BWT19-20 (D).”
Rated minor: it would not touch a result — a value no result rests on, a p-value that stays on the same side of the significance level, or a conflict that is clerical, resolved elsewhere in the paper, or outside its own findings.
In the paper
§ Multi-environment trials data analysis: linear mixed model-based approaches using spatial and factor analytic models > 3 Results > 3.1 Spatial analysis
“the trial AA20BWNE, which showed local spatial variation along the row dimension (p = 0.001).”
§ Multi-environment trials data analysis: linear mixed model-based approaches using spatial and factor analytic models > 3 Results > 3.1 Spatial analysis
“| BWT19-20 | AA20BWNE | Extraneous | Row | 13.98 | < 0.001 |”
Rated minor: it would not touch a result — a value no result rests on, a p-value that stays on the same side of the significance level, or a conflict that is clerical, resolved elsewhere in the paper, or outside its own findings.
In the paper
§ Multi-environment trials data analysis: linear mixed model-based approaches using spatial and factor analytic models > 3 Results > 3.2 Spatial + G × E analysis
“LCB14-16 (8 trials, 16 entries)”
§ Multi-environment trials data analysis: linear mixed model-based approaches using spatial and factor analytic models > 2 Data and methods > 2.1 Motivating data
“| 1 | Common bean | LCB14-16 | 9 | 16 | 16 | (4 × 12) |”
Rated minor: it would not touch a result — a value no result rests on, a p-value that stays on the same side of the significance level, or a conflict that is clerical, resolved elsewhere in the paper, or outside its own findings.
In the paper
§ Multi-environment trials data analysis: linear mixed model-based approaches using spatial and factor analytic models > 3 Results > 3.1 Spatial analysis
“along solely the row dimension for the environment 2020MZNVT-AS (p = 0.030).”
§ Multi-environment trials data analysis: linear mixed model-based approaches using spatial and factor analytic models > 3 Results > 3.1 Spatial analysis
“| IHMZ20 | 2020MZNVT- AS | Global | lcol | 11.21 | 0.030 |”
Citations
Cites
Small sample inference for fixed effects from restricted maximum likelihood
Kenward, M. G., & Roger, J. H. (1997) · Biometrics · doi:10.2307/2533558 · Cited by 4,552
Recovery of inter-block information when block sizes are unequal
PATTERSON, H. D., & THOMPSON, R. (1971) · Biometrika · doi:10.1093/biomet/58.3.545 · Cited by 4,058 · cited 1×
“First, the variance parameters of the model are estimated using Residual Maximum Likelihood (REML), an approach introduced by Patterson and Thompson (1971).”
On the design of early generation variety trials with correlated data
Cullis, B. R., Smith, A. B., & Coombes, N. E. (2006) · Journal of Agricultural, Biological, and Environmental Statistics · doi:10.1198/108571106x154443 · Cited by 926 · cited 1×
“According to the methodology outlined by Cullis et al. (2006), the heritability ( H 2 j ) value for the j th trial can be calculated from a generalized formula that is employed within the context of linear mixed model analysis.”
Accounting for natural and extraneous variation in the analysis of field experiments
Gilmour, A. R., Cullis, B. R., Verbyla, A. P., & Verbyla, A. P. (1997) · Journal of Agricultural, Biological, and Environmental Statistics · doi:10.2307/1400446 · Cited by 752
SMITH, A. B., CULLIS, B. R., & THOMPSON, R. (2005) · The Journal of Agricultural Science · doi:10.1017/s0021859605005587 · Cited by 623
Smith, A., Cullis, B., & Thompson, R. (2001) · Biometrics · doi:10.1111/j.0006-341x.2001.01138.x · Cited by 566
Malosetti, M., Ribaut, J.-M., & van Eeuwijk, F. A. (2013) · Frontiers in Physiology · doi:10.3389/fphys.2013.00044 · Cited by 539 · cited 1×
“This interaction is critical because it directly affects important agronomic outcomes, such as yield and the ability of plants to adapt to varying climates and soil types (Van Eeuwijk et al., 2016; Malosetti et al., 2013, 2016; Bustos-Korts et al., 2009).”
Role of New Plant Breeding Technologies for Food Security and Sustainable Agricultural Development
Qaim, M. (2020) · Applied Economic Perspectives and Policy · doi:10.1002/aepp.13044 · Cited by 524 · cited 1×
“Crop variety development is a fundamental pillar of modern agriculture, with advancements over the past century playing a vital role in enhancing global food security, improving farmer livelihoods, and promoting sustainable farming practices (Qaim, 2020; Begna and Begna, 2021).”
Genetic diversity is indispensable for plant breeding to improve crops
Swarup, S., Cargill, E. J., Crosby, K., Flagel, L., Kniskern, J., & Glenn, K. C. (2021) · Crop Science · doi:10.1002/csc2.20377 · Cited by 423
van Eeuwijk, F. A., Bustos‐Korts, D. V., & Malosetti, M. (2016) · Crop Science · doi:10.2135/cropsci2015.06.0375 · Cited by 286
Research works printed but not linked: 5
- Bustos-Korts, 2009, ASReml-R Reference Manual
- Butler, 2009, ASReml-R Reference Manual
- Mark, 2021, Tackling E × M interactions to close on-farm yield-gaps: creating novel pathways for crop improvement by predicting contributions of genetics and management to crop productivity, Theor. Appl. Genet., 134, 1625, 10.1007/s00122-021-03812-3 · DOI · Paper page
- Taye, 2005, Using spatial modelling techniques to improve data analysis from agricultural field trials
- Woldemeskel, 2022, Spatial mixed model analysis in varietal selection field trials, Ethiopian J. Crop Sci., 9, 233
Cited by
Resilient yet productive: maize that can thrive under stress and in optimal conditions
Das, R., Vinayan, M. T., Seetharam, K., Ahmad, S., Thaitad, S., Nguyễn, T. V., Patel, M. B., Phagna, R. K., Lenka, D., & Zaidi, P. H. (2025) · Frontiers in Plant Science · doi:10.3389/fpls.2025.1690230 · Cited by 10
“This highlights the dominant role of GEI in METs and its importance in identifying adaptable genotypes (Olivoto et al., 2019; Yue et al., 2022; Argaw et al., 2025).”
GGE biplot analysis of aromatic rice yield stability and adaptability in Texas
Alawadi, H. F. N., Abdelhamid, M. T., Ibrahim, A. M. H., Subramanian, N. K., & Samonte, S. O. P. (2025) · Agrosystems Geosciences & Environment · doi:10.1002/agg2.70216 · Cited by 2
Manzoor, I., Arshad, M. A., Gul, R. M. S., et al. (2025) · Journal of Stored Products Research · doi:10.1016/j.jspr.2025.102846 · Cited by 2
Bielsa, F. J., Errea, P., Iturmendi, N., et al. (2025) · Frontiers in Plant Science · doi:10.3389/fpls.2025.1623195 · Cited by 2
Does Breeding for Abiotic Stress Tolerance Mitigate G × E Interactions Under a Changing Climate?
Zaidi, P. H., Das, R., Singamsetti, A., Seetharam, K., Fatma, S., Kuchanur, P. H., Vinayan, M. T., & Patil, A. (2026) · Springer eBooks · doi:10.1007/978-981-95-5664-9_6 · Cited by 4
Metadata
- Authors
- Argaw, T., Fenta, B. A., Zegeye, H., Azmach, G., & Funga, A.
- Affiliations
- Ethiopian Institute of Agricultural Research (ET)
- Corresponding author
- Argaw, Tarekegn
- Venue
- Frontiers in Research Metrics and Analytics
- Publisher
- Frontiers Media SA
- Published
- 2025-04-11
- Volume
- 10
- Pages
- 1472282-1472282
- ISSN
- 2504-0537 (ISSN-L)
- PMC
- PMC12034942
- OpenAlex
- W4409376994
- Semantic Scholar
- 2ef9bd926d03695383309d3baf5f4e18e0d63a2d
- Cited by
- 19
- References
- 44
- Citations by year
- 2026: 15 · 2025: 4
- FWCI
- 10.27
- Type
- journal article
- Language
- en
- Open access
- gold
- doi.org
- Licence
- Locations
- Frontiers in Research Metrics and Analytics (publishedVersion, cc-by)
- PubMed Central (publishedVersion, cc-by)
- PubMed (publishedVersion)
- DOAJ (DOAJ: Directory of Open Access Journals) (submittedVersion, cc-by-sa)
- Funders
- Ethiopian Institute of Agricultural Research
- Topics
- Life Sciences › Agricultural and Biological Sciences › Plant Science › Genetics and Plant Breeding
- Life Sciences › Biochemistry, Genetics and Molecular Biology › Genetics › Genetic and phenotypic traits in livestock
- Life Sciences › Agricultural and Biological Sciences › Agronomy and Crop Science › Agriculture, Soil, Plant Science
- Keywords
- multi-environment trials, linear mixed models, spatial analysis, factor analytic models, gene-environment interaction, spatial correlation, grain yield, randomized complete block design, genetic parameter estimation, genetic correlation, plant breeding, cultivar evaluation, Ethiopia
About these checks
Registry, retraction, Cites and statistics results are computed, not judged, with one exception: a printed reference that no index lists is read once by a model before it counts as a citation error. Claims are extracted by a model and kept only when their quote appears verbatim in the text; each cited source is then checked, with a model’s help, for whether it says what the claim relies on. Those verdicts can be wrong — read the claim’s quote and the cited source before relying on one.
The claim verdicts this report counts are experimental: their accuracy is not yet measured.
A language model drew the claims from the paper on 2026-10-01, under version 3 of the claim definition (model deepseek-v4.1-flash, prompt extract-v3).
A second model labelled each claim on 2026-10-01 (model jev-1.13-20260917, definition revision gold-guideline-v0.2).
Cited sources are checked with a language model’s help (gpt-6-sol).
Statistics and arithmetic are recomputed, not judged.
Confidence bands are shown only for fields calibrated on our annotated test set. None is calibrated yet, so no band is shown.
What counts as a claim ›How we measure confidence ›How we check this ›
Are you an author, or do you see a problem with this page? Request a review
How to cite
Cite CoChat for the checks on this page, and the paper for its own findings.
- This page
- CoChat. (2026). Citation check: Multi-environment trials data analysis: linear mixed model-based approaches using spatial and factor analytic models. https://app.cochat.ai/papers/10.3389/frma.2025.1472282
- The paper
- Argaw, T., Fenta, B. A., Zegeye, H., Azmach, G., & Funga, A. (2025). Multi-environment trials data analysis: linear mixed model-based approaches using spatial and factor analytic models. Frontiers in Research Metrics and Analytics. https://doi.org/10.3389/frma.2025.1472282
Data sources
Bibliographic data: Semantic Scholar, OpenAlex, Crossref.
Contains information from the Semantic Scholar Academic Graph Datasets, made available under the ODC Attribution License (ODC-BY 1.0).
Semantic Scholar’s data is described in: Kinney, R., et al. (2023). The Semantic Scholar Open Data Platform. arXiv:2301.10140.
