

Automatic Crack Classification by Exploiting Statistical Event Descriptors for Deep Learning
Open accessThe DOI matches its Crossref record; 104 of the 104 references it cites were found in a registry or an index.
Abstract
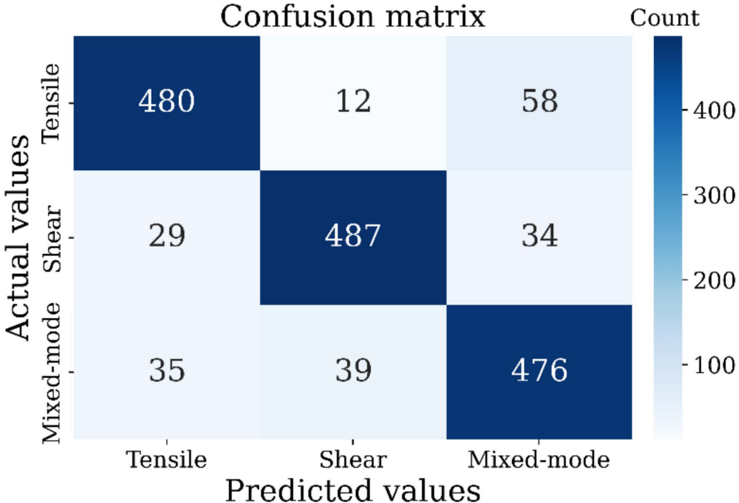
In modern building infrastructures, the chance to devise adaptive and unsupervised data-driven structural health monitoring (SHM) systems is gaining in popularity. This is due to the large availability of big data from low-cost sensors with communication capabilities and advanced modeling tools such as deep learning. A promising method suitable for smart SHM is the analysis of acoustic emissions (AEs), i.e., ultrasonic waves generated by internal ruptures of the concrete when it is stressed. The advantage in respect to traditional ultrasonic measurement methods is the absence of the emitter and the suitability to implement continuous monitoring. The main purpose of this paper is to combine deep neural networks with bidirectional long short term memory and advanced statistical analysis involving instantaneous frequency and spectral kurtosis to develop an accurate classification tool for tensile, shear and mixed modes originated from AE events (cracks). We investigated effective event descriptors to capture the unique characteristics from the different types of modes. Tests on experimental results confirm that this method achieves promising classification among different crack events and can impact on the design of the future of SHM technologies. This approach is effective to classify incipient damages with 92% of accuracy, which is advantageous to plan maintenance.
Overview
The claims and statistics of this paper haven’t been checked yet.
Free: it reads the open-access text and checks the first 5 claims that cite a source we can check. Create a free account to check every claim.
Integrity signals
Registry
Cites
Statistics
Figures
Verification
Claims the paper makes
The claims and statistics of this paper haven’t been checked yet.
Free: it reads the open-access text and checks the first 5 claims that cite a source we can check. Create a free account to check every claim.
Claims other papers make about this one
Each is checked against this paper’s own text: does it say what the citing paper says it does?
The cited source says what the claim attributes to it.
In the citing paper
“The main applications are fatigue crack localization in metal plates [80,81,147], damage localization in composite panels [19], and concrete crack detection [62].”
From Deep Learning for Structural Health Monitoring: Data, Algorithms, Applications, Challenges, and Trends (2023) · cites this paper as [62]
Self-check
Percentages, sums and reported differences re-computed from the paper’s own numbers.
The self-check needs the paper’s full text.
Citations
Cites
Hochreiter, S., & Schmidhuber, J. (1997) · Neural Computation · doi:10.1162/neco.1997.9.8.1735 · Cited by 102,318
Huang, N. E., Shen, Z., Long, S. R., Wu, M. C., Shih, H. H., Zheng, Q., Yen, N.-C., Tung, C. C., & Liu, H. H. (1998) · Proceedings of the Royal Society of London. Series A: Mathematical, Physical and Engineering Sciences · doi:10.1098/rspa.1998.0193 · Cited by 23,564
(2010) · International Conference on Machine Learning · Cited by 13,995
TensorFlow: Large-Scale Machine Learning on Heterogeneous Distributed Systems
Abadi, M., Agarwal, A., Barham, P., Brevdo, E., Chen, Z., Citro, C., Corrado, G. S., Davis, A., Dean, J., Devin, M., et al. (2016) · arXiv · doi:10.48550/arxiv.1603.04467 · Cited by 9,408
Framewise phoneme classification with bidirectional LSTM and other neural network architectures
Graves, A., & Schmidhuber, J. (2005) · Neural Networks · doi:10.1016/j.neunet.2005.06.042 · Cited by 5,839
Deep learning with long short-term memory networks for financial market predictions
Fischer, T., & Krauss, C. (2018) · European Journal of Operational Research · doi:10.1016/j.ejor.2017.11.054 · Cited by 2,785
An introduction to structural health monitoring
Farrar, C. R., & Worden, K. (2007) · Philosophical Transactions of the Royal Society A: Mathematical, Physical and Engineering Sciences · doi:10.1098/rsta.2006.1928 · Cited by 2,628
Time series classification from scratch with deep neural networks: A strong baseline
Wang, Z., Yan, W., & Oates, T. (2017) · 2017 International Joint Conference on Neural Networks (IJCNN) · doi:10.1109/ijcnn.2017.7966039 · Cited by 2,299 · cited 1×
“There are several works which illustrate that DL is suitable for classification problem and can outperform other algorithms [26,27] which encourage further work in this direction.”
BackgroundEstimating and interpreting the instantaneous frequency of a signal. I. Fundamentals
Boashash, B. (1992) · Proceedings of the IEEE · doi:10.1109/5.135376 · Cited by 1,955
LSTM Fully Convolutional Networks for Time Series Classification
Karim, F., Majumdar, S., Darabi, H., & Chen, S. (2018) · IEEE Access · doi:10.1109/access.2017.2779939 · Cited by 1,465
Research works printed but not linked: 7
- Barat, 2017, Acoustic signals recognition by convolutional neural network, Int. J. Appl. Eng. Res., 12, 3461
- Goodfellow, I., Bengio, Y., and Courville, A. (2016). Deep Learning, The MIT Press.
- Lamonaca, 2010, Sensors & Transducers of Acoustic Emissions in Civil Engineering Structures by Using Time Frequency, Representation, 8, 42
- Munoz, D., Lara, F.B., Vargas, C., and Enriquez-Caldera, R. (2009). Position Location Techniques and Applications, Elsevier.
- Maddela, 2015, Spectral Kurtosis Theory: A Review through Simulations Spectral Kurtosis Theory: A Review through Simulations, Glob. J. Res. Eng. F Electr. Electron. Eng., 15, 49
- Ohtsu, M. (2015). Acoustic emission and related non-destructive evaluation techniques in the Ffracture mechanics of concrete, Elsevier.
- Bishop, C.M. (2006). Pattern recognition and machine learning. Information Science and Statistics, Springer.
Cited by
Jia, J., & Li, Y. (2023) · Sensors · doi:10.3390/s23218824 · Cited by 182
“The main applications are fatigue crack localization in metal plates [80,81,147], damage localization in composite panels [19], and concrete crack detection [62].”
BackgroundMethod
Metadata
- Authors
- Siracusano, G., Garescì, F., Finocchio, G., Tomasello, R., Lamonaca, F., Scuro, C., Carpentieri, M., Chiappini, M., & La Corte, A.
- Affiliations
- University of Catania (IT)
- University of Messina (IT)
- Polytechnic University of Bari (IT)
- University of Calabria (IT)
- Istituto Nazionale di Geofisica e Vulcanologia (IT)
- Department of Electric, Electronic and Computer Engineering, University of Catania, Viale Andrea Doria 6, 95125 Catania, Italy
- Corresponding author
- Siracusano, Giulio
- Finocchio, Giovanni
- Chiappini, Massimo
- ORCID
- Venue
- Applied Sciences
- Publisher
- MDPI AG
- Published
- 2021-12-17
- Volume
- 11
- Issue
- 24
- Pages
- 12059
- ISSN
- 2076-3417 (ISSN-L)
- OpenAlex
- W3217263135
- Cited by
- 39
- References
- 104
- Citations by year
- 2026: 4 · 2025: 7 · 2024: 8 · 2023: 13 · 2022: 7
- FWCI
- 3.62
- Type
- journal article
- Language
- en
- Open access
- gold
- doi.org
- Licence
- Locations
- Applied Sciences (publishedVersion, cc-by)
- arXiv (Cornell University) (submittedVersion)
- DOAJ (DOAJ: Directory of Open Access Journals) (submittedVersion, cc-by-sa)
- Archive of Doctoral Theses and Digital Collections (University of Calabria) (submittedVersion)
- arXiv (Cornell University)
- Funders
- Ministry of Education, Universities and Research (J45F21000460001)
- Topics
- Physical Sciences › Engineering › Civil and Structural Engineering › Structural Health Monitoring Techniques
- Physical Sciences › Engineering › Civil and Structural Engineering › Structural Engineering and Materials Analysis
- Physical Sciences › Engineering › Mechanics of Materials › Ultrasonics and Acoustic Wave Propagation
- Keywords
- crack classification, acoustic emission, structural health monitoring, concrete damage detection, bidirectional LSTM, instantaneous frequency, spectral kurtosis, tensile cracks, shear cracks, mixed-mode cracks, maintenance planning
About these checks
Registry, retraction, Cites and statistics results are computed, not judged, with one exception: a printed reference that no index lists is read once by a model before it counts as a citation error. Claims are extracted by a model and kept only when their quote appears verbatim in the text; each cited source is then checked, with a model’s help, for whether it says what the claim relies on. Those verdicts can be wrong — read the claim’s quote and the cited source before relying on one.
Statistics and arithmetic are recomputed, not judged.
Confidence bands are shown only for fields calibrated on our annotated test set. None is calibrated yet, so no band is shown.
What counts as a claim ›How we measure confidence ›How we check this ›
Are you an author, or do you see a problem with this page? Request a review
Data sources
Bibliographic data: Semantic Scholar, OpenAlex, Crossref.
Contains information from the Semantic Scholar Academic Graph Datasets, made available under the ODC Attribution License (ODC-BY 1.0).
Semantic Scholar’s data is described in: Kinney, R., et al. (2023). The Semantic Scholar Open Data Platform. arXiv:2301.10140.
