

The DOI matches its Crossref record; 85 of the 86 references it cites were found in a registry or an index.
Functional and Molecular Analysis of Human Osteoarthritic Chondrocytes Treated with Bone Marrow-Derived MSC-EVs
Open accessAbstract
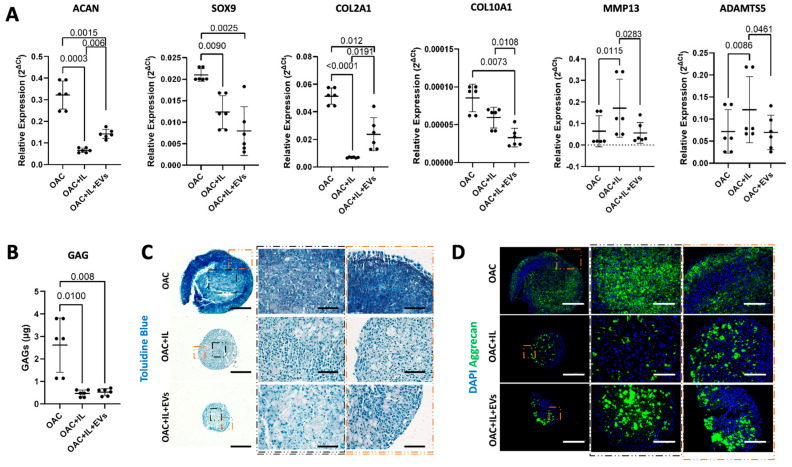
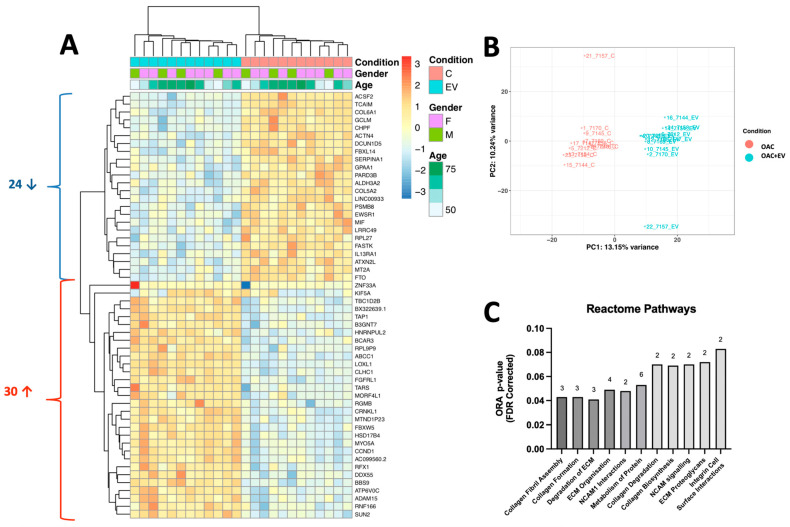
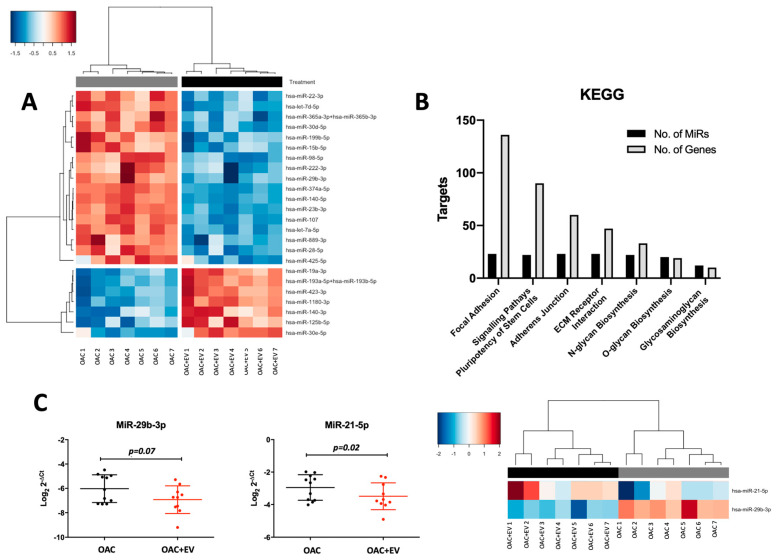
Osteoarthritis (OA) is a degenerative joint disease, causing impaired mobility. There are currently no effective therapies other than palliative treatment. Mesenchymal stromal cells (MSCs) and their secreted extracellular vesicles (MSC-EVs) have shown promise in attenuating OA progression, promoting chondral regeneration, and modulating joint inflammation. However, the precise molecular mechanism of action driving their beneficial effects has not been fully elucidated. In this study, we analyzed MSC-EV-treated human OA chondrocytes (OACs) to assess viability, proliferation, migration, cytokine and catabolic protein expression, and microRNA and mRNA profiles. We observed that MSC-EV-treated OACs displayed increased metabolic activity, proliferation, and migration compared to the controls. They produced decreased proinflammatory (Il-8 and IFN-γ) and increased anti-inflammatory (IL-13) cytokines, and lower levels of MMP13 protein coupled with reduced expression of MMP13 mRNA, as well as negative microRNA regulators of chondrogenesis (miR-145-5p and miR-21-5p). In 3D models, MSC-EV-treated OACs exhibited enhanced chondrogenesis-promoting features (elevated sGAG, ACAN, and aggrecan). MSC-EV treatment also reversed the pathological impact of IL-1β on chondrogenic gene expression and extracellular matrix component (ECM) production. Finally, MSC-EV-treated OACs demonstrated the enhanced expression of genes associated with cartilage function, collagen biosynthesis, and ECM organization and exhibited a signature of 24 differentially expressed microRNAs, associated with chondrogenesis-associated pathways and ECM interactions. In conclusion, our data provide new insights on the potential mechanism of action of MSC-EVs as a treatment option for early-stage OA, including transcriptomic analysis of MSC-EV-treated OA, which may pave the way for more targeted novel therapeutics.
Overview
The claims and statistics of this paper haven’t been checked yet.
Run the check — free, no account needed. It reads the open-access text and checks the sources it cites.
Integrity signals
Registry
Cites
Statistics
Figures
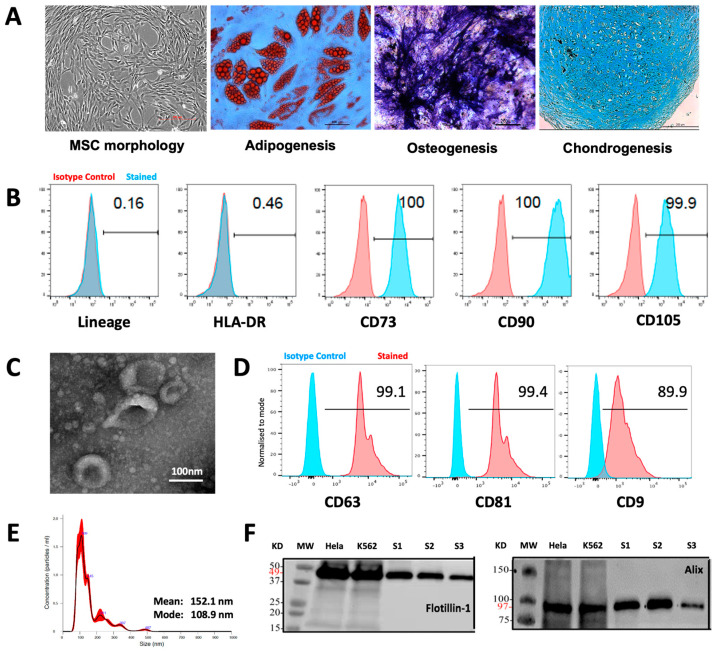
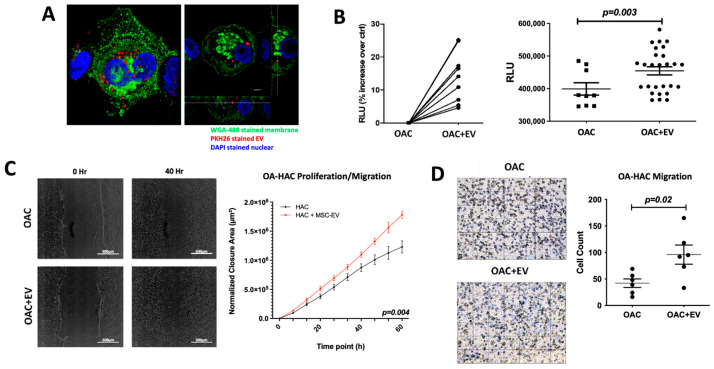
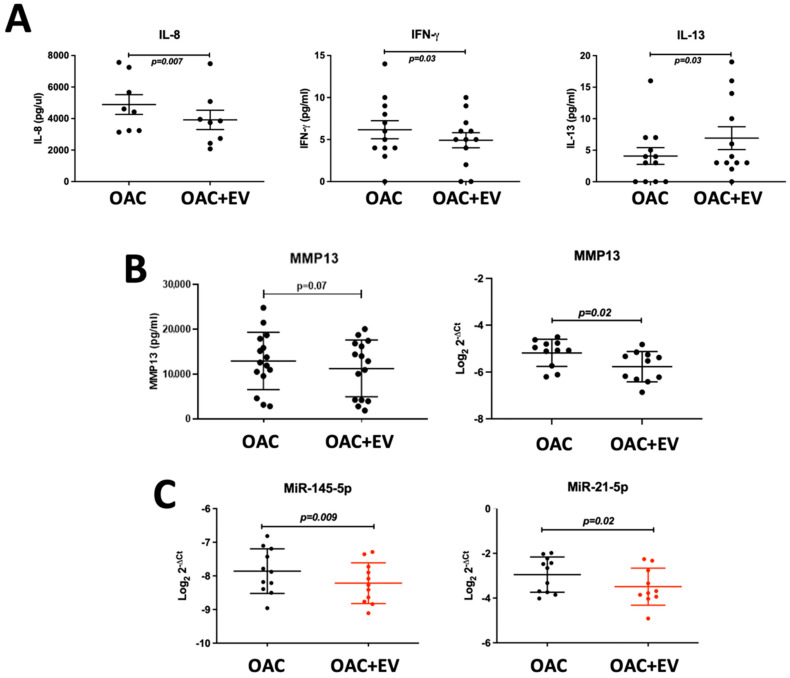
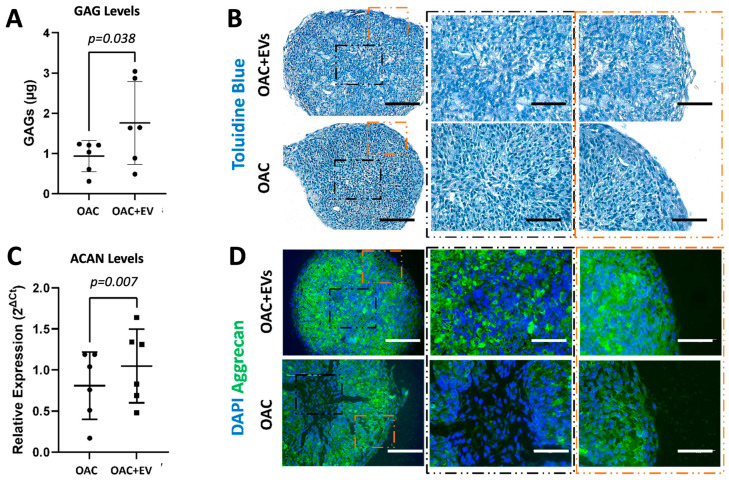
Verification
Claims the paper makes
The claims and statistics of this paper haven’t been checked yet.
Run the check — free, no account needed. It reads the open-access text and checks the sources it cites.
Claims other papers make about this one
Each is checked against this paper’s own text: does it say what the citing paper says it does?
The cited source says what the claim attributes to it.
In the citing paper
“Recent advances in exosome therapy and MSC-derived extracellular vesicles (EVs) have shown promise as alternative regenerative strategies, delivering the therapeutic benefits of MSCs without the challenges of direct cell transplantation [113].”
Self-check
Percentages, sums and reported differences re-computed from the paper’s own numbers.
The self-check needs the paper’s full text.
Citations
Cites
2 retracted
Li, H., Hu, J., Zhao, J., Liu, J., Ouyang, W., Yang, C., Gong, N., Du, L., Khanal, A., & Chen, L. (2013) · BioMed Research International · doi:10.1155/2013/438243 · Cited by 72
RetractedYu, C., & Wang, Y. (2018) · Biomedicine & Pharmacotherapy · doi:10.1016/j.biopha.2017.11.132 · Cited by 19
RetractedModerated estimation of fold change and dispersion for RNA-seq data with DESeq2
Love, M. I., Huber, W., & Anders, S. (2014) · Genome Biology · doi:10.1186/s13059-014-0550-8 · Cited by 95,106
Dominici, M., Le Blanc, K., Mueller, I., Slaper-Cortenbach, I., Marini, F. C., Krause, D. S., Deans, R. J., Keating, A., Prockop, D. J., & Horwitz, E. M. (2006) · Cytotherapy · doi:10.1080/14653240600855905 · Cited by 17,766
Valadi, H., Ekström, K., Bossios, A., Sjöstrand, M., Lee, J. J., & Lötvall, J. O. (2007) · Nature Cell Biology · doi:10.1038/ncb1596 · Cited by 12,834
Salmon provides fast and bias-aware quantification of transcript expression
Patro, R., Duggal, G., Love, M. I., Irizarry, R. A., & Kingsford, C. (2017) · Nature Methods · doi:10.1038/nmeth.4197 · Cited by 12,700
Théry, C., Witwer, K. W., Aikawa, E., Alcaraz, M. J., Anderson, J. D., Andriantsitohaina, R., Antoniou, A., Arab, T., Archer, F., Atkin‐Smith, G. K., et al. (2018) · Journal of Extracellular Vesicles · doi:10.1080/20013078.2018.1535750 · Cited by 11,099
Isolation and Characterization of Exosomes from Cell Culture Supernatants and Biological Fluids
Théry, C., Amigorena, S., Raposo, G., & Clayton, A. (2006) · Current Protocols in Cell Biology · doi:10.1002/0471143030.cb0322s30 · Cited by 5,766
Osteoarthritis: A disease of the joint as an organ
Loeser, R. F., Goldring, S. R., Scanzello, C. R., & Goldring, M. B. (2012) · Arthritis & Rheumatism · doi:10.1002/art.34453 · Cited by 3,234
DIANA-miRPath v3.0: deciphering microRNA function with experimental support
Vlachos, I. S., Zagganas, K., Paraskevopoulou, M. D., Georgakilas, G. K., Karagkouni, D., Vergoulis, T., Dalamagas, T., & Hatzigeorgiou, A. G. (2015) · Nucleic Acids Research · doi:10.1093/nar/gkv403 · Cited by 1,682
Research works printed but not linked: 1
- Théry, C., Amigorena, S., Raposo, G., and Clayton, A. (2006). Current Protocols in Cell Biology, Wiley. Chapter 3, Unit 3.22.
Cited by
Sorted by citations
Liu, X., Zhang, C., Fu, Y., Xie, L., Kong, Y., & Yang, X. (2025) · Current Issues in Molecular Biology · doi:10.3390/cimb47110885 · Cited by 39
Targeting the senescence-associated secretory phenotype to modify osteoarthritis in aging
Afzal, M., Rekha, M. M., Sahoo, S., Pandey, S. N., Maji, C., Goyal, K., Ali, H., Singh, S. K., Gupta, G., & Hussain, M. S. (2025) · Inflammopharmacology · doi:10.1007/s10787-025-02001-8 · Cited by 27
Goulian, A. J., Goldstein, B., & Saad, M. A. (2025) · Journal of Clinical Medicine · doi:10.3390/jcm14062061 · Cited by 25
“Recent advances in exosome therapy and MSC-derived extracellular vesicles (EVs) have shown promise as alternative regenerative strategies, delivering the therapeutic benefits of MSCs without the challenges of direct cell transplantation [113].”
Targeting osteoarthritis with small extracellular vesicle therapy: potential and perspectives
Rodríguez, A. G., Toro, F. J. D., Mora, A. J., Fernández‐Pernas, P., Rivadulla, C. P., Fraga, M. F., Fafián‐Labora, J., & Arufe, M. C. (2025) · Frontiers in Bioengineering and Biotechnology · doi:10.3389/fbioe.2025.1570526 · Cited by 17
Kong, H., Zheng, J., Han, J., Meng, X., Li, X., Wang, X., & Zhang, X.-A. (2025) · Stem Cell Research & Therapy · doi:10.1186/s13287-025-04659-x · Cited by 16
Self-citationZhang, W., Li, S., Peng, Y., Deng, Z., Li, Q., Tian, R., Kuang, X., Kang, Y., Sun, R., Huang, C., et al. (2025) · Biomedical Materials · doi:10.1088/1748-605x/adb22e · Cited by 12
Jones, M., Jones, E., & Kouroupis, D. (2024) · Bioengineering · doi:10.3390/bioengineering11100961 · Cited by 11
Self-citationFecskeová, L. K., Matejová, J., Slovinská, L., Bzdilova, J., Kozovská, Z., & Harvanová, D. (2025) · Stem Cell Research & Therapy · doi:10.1186/s13287-025-04542-9 · Cited by 6
Aixirefu, A. (2024) · American Journal of Translational Research · doi:10.62347/jujv3321 · Cited by 5
Kugaudaite, G., Bakutyte, I., Bagdonas, E., Vaičiulevičiūtė, R., Talaikis, M., Mikšiūnas, R., Lebedis, I., Pachaleva, J., Kvederas, G., Krugly, E., et al. (2026) · Scientific Reports · doi:10.1038/s41598-026-40854-3 · Cited by 3
Epigenetic regulation in osteoarthritis: recent updates and emerging mechanisms
Zhao, Y., & Liu, X. (2026) · Frontiers in Genetics · doi:10.3389/fgene.2026.1862466 · Cited by 2
Wen, Y., Meng, G., Yang, S. H., & Mei, H. (2026) · Journal of Translational Medicine · doi:10.1186/s12967-025-07427-w · Cited by 1
Leal, A. F., Pachajoa, H., & Tomatsu, S. (2025) · International Journal of Molecular Sciences · doi:10.3390/ijms26136448 · Cited by 1
Fang, Y., Du, W., Zheng, W., Chen, H., Gao, L., & Guo, L. (2025) · Journal of Orthopaedics · doi:10.1016/j.jor.2025.10.002
RetractedMesenchymal stem cells and extracellular vesicles in cartilage regeneration
Natarajan, A., Anjali, S., & Aswathy, J. (2026) · Elsevier eBooks · doi:10.1016/b978-0-443-45056-3.00010-8
Liu, Z., Liu, B., Shi, Y., & Jiang, Q. Y. (2026) · Journal of Nanobiotechnology · doi:10.1186/s12951-026-04894-1
Niu, J., Li, Z., Zou, Y., Wang, Z., Sun, M., Ning, B., Wang, W., & Liu, R. (2026) · Artificial Intelligence Surgery · doi:10.20517/ais.2026.48
Metadata
- Authors
- Scalzone, A., Sanjurjo-Rodríguez, C., Berlinguer-Palmini, R., Dickinson, A. M., Jones, E., Wang, X.-N., & Crossland, R. E.
- Affiliations
- Italian Institute of Technology (IT)
- Leeds Institute of Rheumatic and Musculoskeletal Medicine, University of Leeds, Leeds LS7 4SA, UK
- Bioimaging Unit, Faculty of Medical Sciences, Newcastle University, Newcastle upon Tyne NE2 4HH, UK
- Newcastle University (GB)
- University of Leeds (GB)
- Translational and Clinical Research Institute, Faculty of Medical Sciences, Newcastle University, Newcastle upon Tyne NE2 4HH, UK
- Corresponding author
- Crossland, Rachel E.
- ORCID
- Venue
- Bioengineering
- Publisher
- MDPI AG
- Published
- 2024-04-17
- Volume
- 11
- Issue
- 4
- Pages
- 388
- ISSN
- 2306-5354 (ISSN-L)
- PMC
- PMC11047960
- OpenAlex
- W4394915029
- Cited by
- 16
- References
- 86
- Citations by year
- 2026: 4 · 2025: 10 · 2024: 2
- FWCI
- 5.18
- Type
- journal article
- Language
- en
- Open access
- gold
- doi.org
- Licence
- Locations
- Bioengineering (publishedVersion, cc-by)
- PubMed Central (publishedVersion, cc-by)
- PubMed (publishedVersion)
- DOAJ (DOAJ: Directory of Open Access Journals) (submittedVersion, cc-by-sa)
- Newcastle University ePrints (Newcastle Univesity) (cc-by)
- Funders
- Tissue Engineering and Regenerative Therapies Centre Versus Arthritis (21156)
- Topics
- Health Sciences › Medicine › Rheumatology › Osteoarthritis Treatment and Mechanisms
- Life Sciences › Biochemistry, Genetics and Molecular Biology › Cell Biology › Mesenchymal stem cell research
- Life Sciences › Biochemistry, Genetics and Molecular Biology › Molecular Biology › Extracellular vesicles in disease
- Keywords
- osteoarthritis, chondrocytes, chondrogenesis, extracellular matrix, microRNA, MMP-13, IL-1β, cytokine expression, cartilage regeneration, gene expression profiling
About these checks
Registry, retraction, Cites and statistics results are computed, not judged, with one exception: a printed reference that no index lists is read once by a model before it counts as a citation error. Claims are extracted by a model and kept only when their quote appears verbatim in the text; each cited source is then checked, with a model’s help, for whether it says what the claim relies on. Those verdicts can be wrong — read the claim’s quote and the cited source before relying on one.
Statistics and arithmetic are recomputed, not judged.
Confidence bands are shown only for fields calibrated on our annotated test set. None is calibrated yet, so no band is shown.
What counts as a claim ›How we measure confidence ›How we check this ›
Are you an author, or do you see a problem with this page? Request a review
