Cited by 28

The DOI matches its Crossref record; 2 of the 2 references it cites were found in a registry or an index.

Aberrantly Expressed RECQL4 Helicase Supports Proliferation and Drug Resistance of Human Glioma Cells and Glioma Stem Cells

Król, Sylwia K., Kaczmarczyk, Agnieszka, Wojnicki, Kamil, Wojtas, Bartosz, Gielniewski, Bartłomiej, Grajkowska, Wieslawa, Kotulska, Katarzyna, Szczylik, Cezary, Czepko, Ryszard, Banach, Mariusz, Kaspera, Wojciech, Szopa, Wojciech, Marchel, Andrzej, Czernicki, Tomasz, Kaminska, Bozena·2020·Cancers

Abstract

Anti-tumour therapies eliminate proliferating tumour cells by induction of DNA damage, but genomic aberrations or transcriptional deregulation may limit responses to therapy. Glioblastoma (GBM) is a malignant brain tumour, which recurs inevitably due to chemo- and radio-resistance. Human RecQ helicases participate in DNA repair, responses to DNA damage and replication stress. We explored if a helicase RECQL4 contributes to gliomagenesis and responses to chemotherapy. We found upregulated RECQL4 expression in GBMs associated with poor survival of GBM patients. Increased levels of nuclear and cytosolic RECQL4 proteins were detected in GBMs on tissue arrays and in six glioma cell lines. RECQL4 was detected both in cytoplasm and mitochondria by Western blotting and immunofluorescence. RECQL4 depletion in glioma cells with siRNAs and CRISPR/Cas9 did not affect basal cell viability, slightly impaired DNA replication, but induced profound transcriptomic changes and increased chemosensitivity of glioma cells. Sphere cultures originated from RECQL4-depleted cells had reduced sphere forming capacity, stronger responded to temozolomide upregulating cell cycle inhibitors and pro-apoptotic proteins. RECQL4 deficiency affected mitochondrial network and reduced mitochondrial membrane polarization in LN18 glioblastoma cells. We demonstrate that targeting RECQL4 overexpressed in glioblastoma could be a new strategy to sensitize glioma cells to chemotherapeutics.

Overview

The claims and statistics of this paper haven’t been checked yet.

Run the check — free, no account needed. It reads the open-access text and checks the sources it cites.

A few free checks a day · papers already verified open instantly · results are public

Integrity signals

Registry

Crossref · 10.3390/cancers12102919

Cites

2 of 2 references verified0 citation errors · 0 not checkable

Statistics

Figures

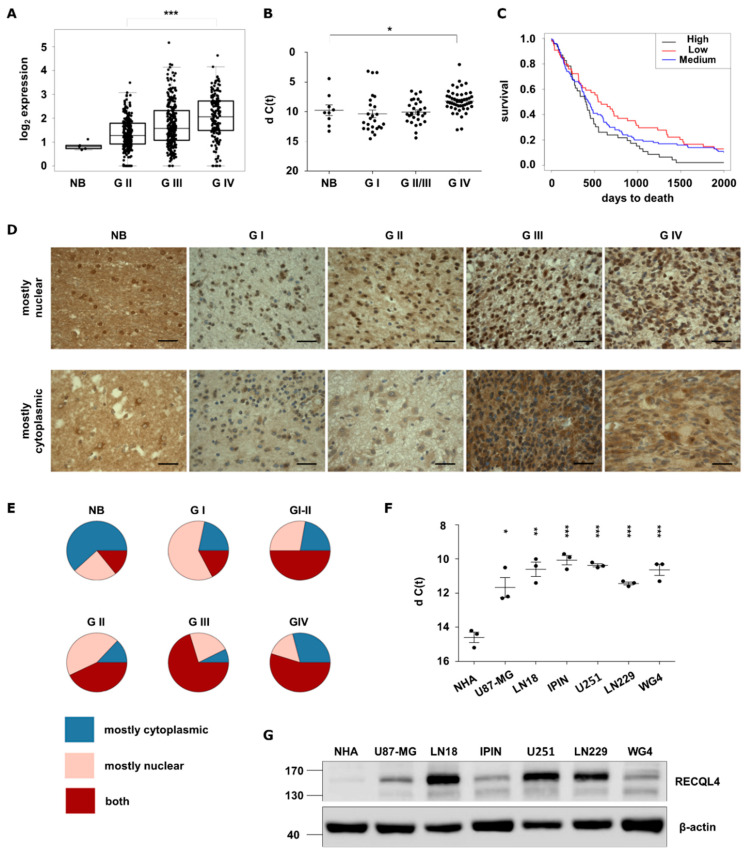
Figure 1 RECQL4 expression is upregulated in human malignant gliomas. (A) RECQL4 expression in normal brain (NB), WHO grade II and grade III gliomas and glioblastomas (GBM, WHO grade IV) in TCGA datasets. Presented values are log2 of FPKM values. Statistical significance was determined by Welch’s analysis of variance (ANOVA) between GII, GIII and GIV groups. (B) Quantitative analysis of RECQL4 mRNA levels in NB (n = 9), and gliomas of different grades: GI (n = 25), GII/III (n = 29) and GBM (n = 50). The RECQL4 expression was normalized to GAPDH; results represent means ± SEM; statistical significance was determined by one-way ANOVA, followed by Dunnett’s post hoc test. p-Values were considered as significant when * p < 0.05. (C) Kaplan–Meier overall survival analysis of LGG and GBM patients from TCGA. Log-rank test was calculated between RECQL4 LOW and HIGH expression groups (* p < 0.05). (D) Representative immunostaining showing expression of RECQL4 protein in the glioma tissue microarray including astrocytomas (n = 132), glioblastomas (n = 31), oligoastrocytomas (n = 7), oligodendrogliomas (n = 9), ependymomas (n = 11), ganglioglioma (n = 1) and gliosarcoma (n = 1), plus tumour adjacent and normal brain (NB) tissues (n = 8). RECQL4 expression appeared as high nuclear and low cytoplasmic signal (upper panel) and low nuclear and high cytoplasmic signal (bottom panel). (E) Quantification of RECQL4 immunoreactivity. Statistical significance was determined by chi-squared test. p-values of NB p = 1.0, GI p = 0.019, GII p = 1.1 × 10⁻⁵, GIII p = 6.3 × 10⁻⁵, GIV p = 0.011. (F) Quantitative analysis of RECQL4 mRNA levels in established glioma cell lines, patient-derived primary cultures, and normal human astrocytes (NHA). The expression was normalized to GAPDH; results represent means ± SEM of 3 cell passages (n =3). Statistical significance was determined by one-way ANOVA. p-Values were considered as significant when * p < 0.05, ** p < 0.01, *** p < 0.001. (G) Representative immunoblot shows RECQL4 expression in established glioma cell lines and GBM primary cultures in comparison to NHA. β-Actin was used as a loading control.
Figure 1 RECQL4 expression is upregulated in human malignant gliomas. (A) RECQL4 expression in normal brain (NB), WHO grade II and grade III gliomas and glioblastomas (GBM, WHO grade IV) in TCGA datasets. Presented values are log2 of FPKM values. Statistical significance was determined by Welch’s analysis of variance (ANOVA) between GII, GIII and GIV groups. (B) Quantitative analysis of RECQL4 mRNA levels in NB (n = 9), and gliomas of different grades: GI (n = 25), GII/III (n = 29) and GBM (n = 50). The RECQL4 expression was normalized to GAPDH; results represent means ± SEM; statistical significance was determined by one-way ANOVA, followed by Dunnett’s post hoc test. p-Values were considered as significant when * p < 0.05. (C) Kaplan–Meier overall survival analysis of LGG and GBM patients from TCGA. Log-rank test was calculated between RECQL4 LOW and HIGH expression groups (* p < 0.05). (D) Representative immunostaining showing expression of RECQL4 protein in the glioma tissue microarray including astrocytomas (n = 132), glioblastomas (n = 31), oligoastrocytomas (n = 7), oligodendrogliomas (n = 9), ependymomas (n = 11), ganglioglioma (n = 1) and gliosarcoma (n = 1), plus tumour adjacent and normal brain (NB) tissues (n = 8). RECQL4 expression appeared as high nuclear and low cytoplasmic signal (upper panel) and low nuclear and high cytoplasmic signal (bottom panel). (E) Quantification of RECQL4 immunoreactivity. Statistical significance was determined by chi-squared test. p-values of NB p = 1.0, GI p = 0.019, GII p = 1.1 × 10⁻⁵, GIII p = 6.3 × 10⁻⁵, GIV p = 0.011. (F) Quantitative analysis of RECQL4 mRNA levels in established glioma cell lines, patient-derived primary cultures, and normal human astrocytes (NHA). The expression was normalized to GAPDH; results represent means ± SEM of 3 cell passages (n =3). Statistical significance was determined by one-way ANOVA. p-Values were considered as significant when * p < 0.05, ** p < 0.01, *** p < 0.001. (G) Representative immunoblot shows RECQL4 expression in established glioma cell lines and GBM primary cultures in comparison to NHA. β-Actin was used as a loading control.CC BY · PubMed Central
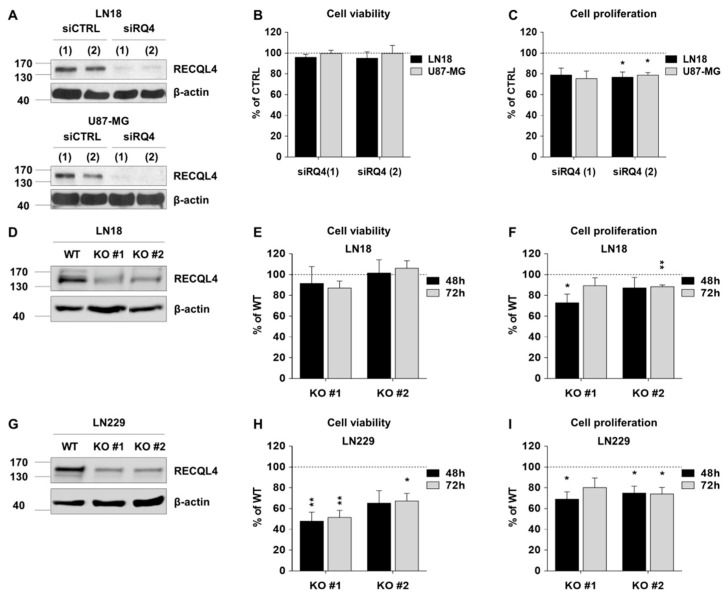
Figure 2 RECQL4 depletion affects cell viability and proliferation of certain glioblastoma cells. (A) Representative immunoblots showing effective knockdown of RECQL4 (48 h post-transfection) with two different siRNAs (siRQ) in LN18 (upper panel) and U87-MG (bottom panel) cells. β-Actin was used as a loading control. Viability (B) and proliferation (C) of LN18 and U87-MG 48 h post-transfection was assessed by MTT metabolism and BrdU incorporation tests, respectively. The results were normalized to cells transfected with the non-targeting control siRNA (siCTRL) and represent the mean ± SEM (n = 4). Statistical significance was determined with by two-tailed t-test; statistically significant when * p < 0.05. (D,E) Representative immunoblots show knockout of RECQL4 by CRISPR/Cas9 in two independent clones (RECQL4 KO #1 and KO #2) of LN18 and LN229 cells. Viability (G,H) and proliferation (F–I) of LN18 or LN229 cells were assessed 48 h and 72 h after seeding as described above. The results were normalized to wild type (WT) cells and represent the mean ± SEM of four independent experiments. Statistical significance was determined by one sample t-test; significant when * p < 0.05, ** p < 0.01.
Figure 2 RECQL4 depletion affects cell viability and proliferation of certain glioblastoma cells. (A) Representative immunoblots showing effective knockdown of RECQL4 (48 h post-transfection) with two different siRNAs (siRQ) in LN18 (upper panel) and U87-MG (bottom panel) cells. β-Actin was used as a loading control. Viability (B) and proliferation (C) of LN18 and U87-MG 48 h post-transfection was assessed by MTT metabolism and BrdU incorporation tests, respectively. The results were normalized to cells transfected with the non-targeting control siRNA (siCTRL) and represent the mean ± SEM (n = 4). Statistical significance was determined with by two-tailed t-test; statistically significant when * p < 0.05. (D,E) Representative immunoblots show knockout of RECQL4 by CRISPR/Cas9 in two independent clones (RECQL4 KO #1 and KO #2) of LN18 and LN229 cells. Viability (G,H) and proliferation (F–I) of LN18 or LN229 cells were assessed 48 h and 72 h after seeding as described above. The results were normalized to wild type (WT) cells and represent the mean ± SEM of four independent experiments. Statistical significance was determined by one sample t-test; significant when * p < 0.05, ** p < 0.01.CC BY · PubMed Central
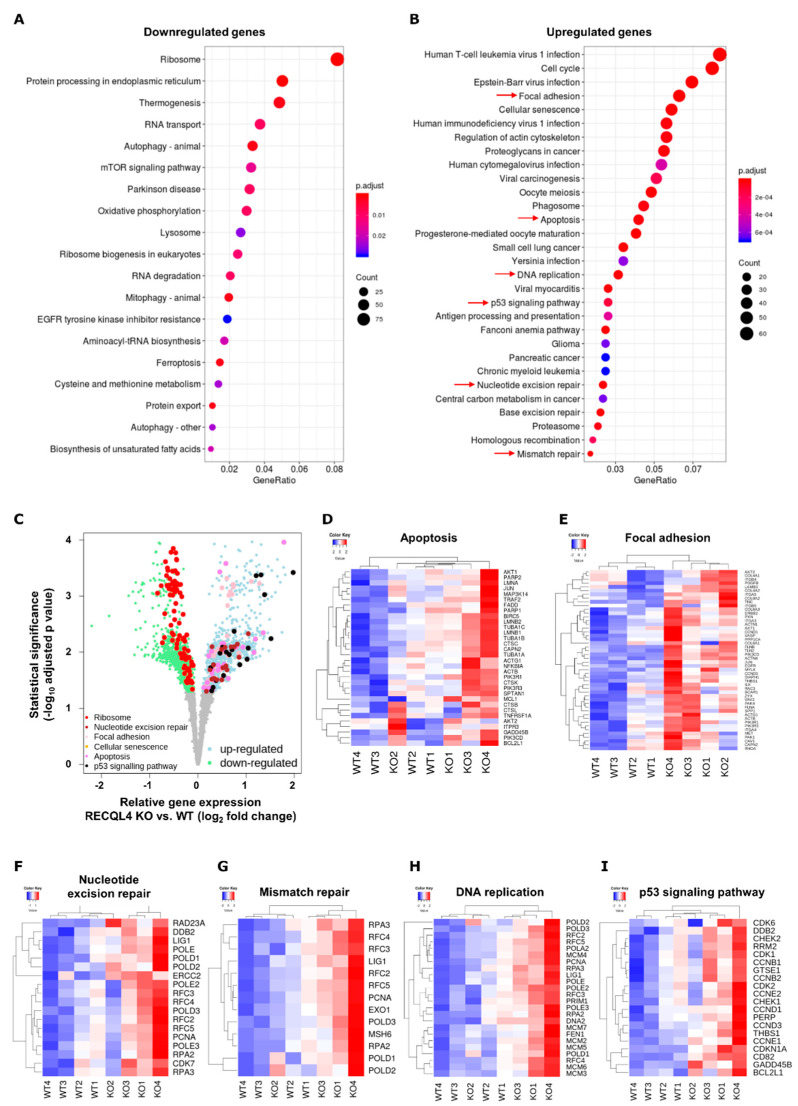
Figure 3 RNA-seq reveals gross transcriptomic changes in RECQL4-depleted glioma cells. Total RNA from WT and RECQL4 KO#2 glioma cells were subjected to RNA sequencing. KEGG analysis of DE genes (FDR corrected p < 0.05) shows genes/pathways downregulated (A) or upregulated (B) in RECQ4 KO cells when compared to WT cells. (C) Volcano plot shows down- and upregulated genes (log2 fold change < 0 and log2 fold change > 0, respectively, and FDR-correction p < 0.05) in RECQ4 KO cell lines relative to the WT. Genes from selected functional KEGG categories (q-value < 0.05) as marked by red arrows on panel (B) are marked in different colours, as indicated in the legend in bottom left of the panel (C). Selected KEGG pathways are also presented on z-score heatmaps: apoptosis (D) focal adhesion (E) nucleotide excision repair (F) mismatch repair (G) DNA replication (H) and p53 signalling pathway (I).
Figure 3 RNA-seq reveals gross transcriptomic changes in RECQL4-depleted glioma cells. Total RNA from WT and RECQL4 KO#2 glioma cells were subjected to RNA sequencing. KEGG analysis of DE genes (FDR corrected p < 0.05) shows genes/pathways downregulated (A) or upregulated (B) in RECQ4 KO cells when compared to WT cells. (C) Volcano plot shows down- and upregulated genes (log2 fold change < 0 and log2 fold change > 0, respectively, and FDR-correction p < 0.05) in RECQ4 KO cell lines relative to the WT. Genes from selected functional KEGG categories (q-value < 0.05) as marked by red arrows on panel (B) are marked in different colours, as indicated in the legend in bottom left of the panel (C). Selected KEGG pathways are also presented on z-score heatmaps: apoptosis (D) focal adhesion (E) nucleotide excision repair (F) mismatch repair (G) DNA replication (H) and p53 signalling pathway (I).CC BY · PubMed Central
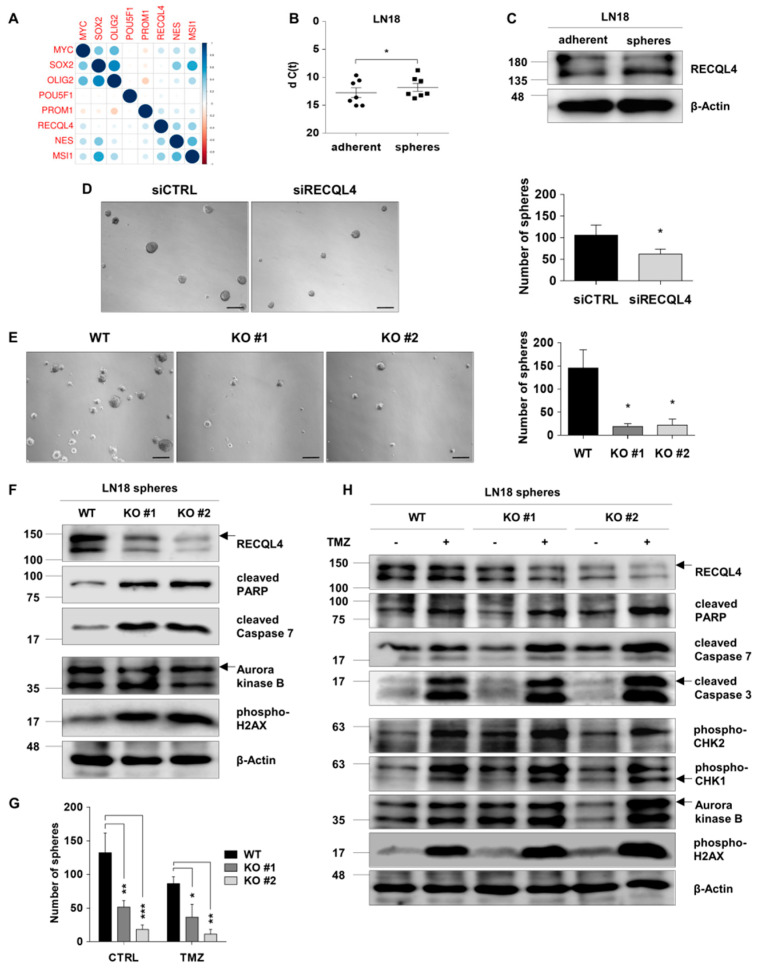
Figure 4 RECQL4 supports self-renewal of glioma stem cells and their resistance to temozolomide. (A) Pearson’s correlation between expression of RECQL4 and selected stem cell markers in the TCGA dataset showed significant positive correlation of RECQL4 and MYC, NES, PROM1 and MSI1 genes. (B) qPCR analysis of the RECQL4 mRNA level in LN18 spheres and parental adherent cells. The expression was normalized to GAPDH; the results represent mean ± SEM (n = 7 different sphere cultures). Statistical significance was determined by two-tailed paired t-test. p-Values were considered as significant when * p < 0.05. (C) Representative immunoblot showing RECQL4 expression in LN18 spheres and adherent cells. β-Actin was used as a loading control. (D) Representative images and quantification of LN18 spheres (at day 7th) after siRNA-mediated RECQL4 knockdown compared to control siRNA transfected spheres. Scale bar represents 200 µm. The results are shown as numbers of spheres (≥100 µm in diameter were counted) and represent means ± SEM (n = 4). Statistical significance was determined by two-tailed paired t-test. p-Values were considered as significant when * p < 0.05. (E) Representative images and quantification of (at day 7th) WT and RECQL4 knockout LN18 spheres. (F) Representative immunoblots showing analysis of cell death, proliferation and cell cycle proteins in WT and RECQL4 KO LN18 spheres. (G) Quantification of spheres in WT and RECQL4 KO cultures exposed to 500 µM TMZ for 72 h. The results are shown as numbers of spheres and represent the means ± SEM (n = 3). Statistical significance was determined by RM two-way ANOVA, with followed by Tukey’s HSD post hoc test. P values were considered as significant when * p < 0.05, ** p < 0.01, *** p < 0.001. (H) Representative immunoblots show the levels of cell death, proliferation and cell cycle proteins in WT and RECQL4 KO LN18 spheres 72 h after TMZ treatment.
Figure 4 RECQL4 supports self-renewal of glioma stem cells and their resistance to temozolomide. (A) Pearson’s correlation between expression of RECQL4 and selected stem cell markers in the TCGA dataset showed significant positive correlation of RECQL4 and MYC, NES, PROM1 and MSI1 genes. (B) qPCR analysis of the RECQL4 mRNA level in LN18 spheres and parental adherent cells. The expression was normalized to GAPDH; the results represent mean ± SEM (n = 7 different sphere cultures). Statistical significance was determined by two-tailed paired t-test. p-Values were considered as significant when * p < 0.05. (C) Representative immunoblot showing RECQL4 expression in LN18 spheres and adherent cells. β-Actin was used as a loading control. (D) Representative images and quantification of LN18 spheres (at day 7th) after siRNA-mediated RECQL4 knockdown compared to control siRNA transfected spheres. Scale bar represents 200 µm. The results are shown as numbers of spheres (≥100 µm in diameter were counted) and represent means ± SEM (n = 4). Statistical significance was determined by two-tailed paired t-test. p-Values were considered as significant when * p < 0.05. (E) Representative images and quantification of (at day 7th) WT and RECQL4 knockout LN18 spheres. (F) Representative immunoblots showing analysis of cell death, proliferation and cell cycle proteins in WT and RECQL4 KO LN18 spheres. (G) Quantification of spheres in WT and RECQL4 KO cultures exposed to 500 µM TMZ for 72 h. The results are shown as numbers of spheres and represent the means ± SEM (n = 3). Statistical significance was determined by RM two-way ANOVA, with followed by Tukey’s HSD post hoc test. P values were considered as significant when * p < 0.05, ** p < 0.01, *** p < 0.001. (H) Representative immunoblots show the levels of cell death, proliferation and cell cycle proteins in WT and RECQL4 KO LN18 spheres 72 h after TMZ treatment.CC BY · PubMed Central
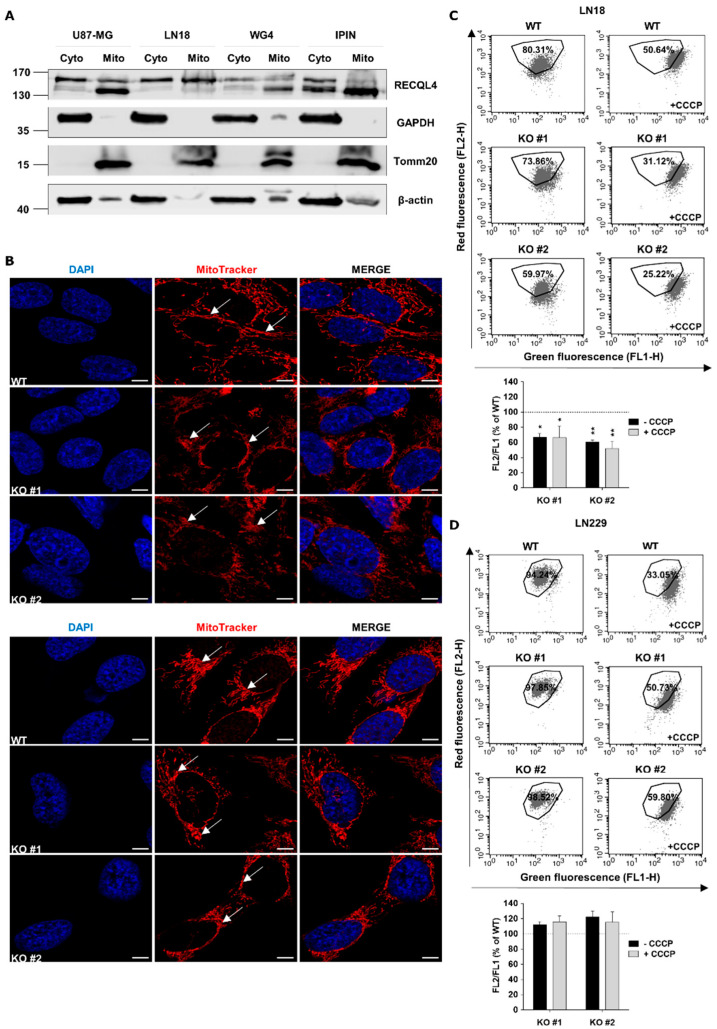
Figure 5 RECQL4 depletion affects morphology and functions of mitochondrial network in glioblastoma cells. (A) Representative immunoblots showing subcellular distribution of RECQL4 in cytosolic (Cyto) and mitochondrial (Mito) fractions of human U87-MG, LN18 and primary WG4, IPIN cultures of glioblastoma cells. Expression of GAPDH and Tomm20 was used as a loading control and markers for cytosolic and mitochondrial fractions, respectively. (B) Representative images of mitochondrial morphology and network organisation in LN18 (upper panel) and LN229 (bottom panel) cells analysed by confocal microscopy. WT and RECQL4 KO cells were stained for mitochondria (MitoTracker, red) and nuclei (DAPI, blue). Scale bar represents 5 µm. (C) Representative histograms and quantification of mitochondrial transmembrane potential changes in WT and KO LN18 cells. The cells were stained with JC-1 probe and analysed by FACS. CCCP was used as a positive control. The results are shown as red/ green fluorescence intensity ratio (relative FL-2/ FL-1) in RECQL4 KO cells normalized to WT cells, and represent means ± SEM (n = 3). Statistical significance was determined by RM two-way ANOVA, with followed by Tukey’s HSD post hoc test. P values were considered as significant when * p < 0.05, ** p < 0.01. (D) Representative histograms and quantification of mitochondrial transmembrane potential changes in WT and RECQL KO LN229 cells.
Figure 5 RECQL4 depletion affects morphology and functions of mitochondrial network in glioblastoma cells. (A) Representative immunoblots showing subcellular distribution of RECQL4 in cytosolic (Cyto) and mitochondrial (Mito) fractions of human U87-MG, LN18 and primary WG4, IPIN cultures of glioblastoma cells. Expression of GAPDH and Tomm20 was used as a loading control and markers for cytosolic and mitochondrial fractions, respectively. (B) Representative images of mitochondrial morphology and network organisation in LN18 (upper panel) and LN229 (bottom panel) cells analysed by confocal microscopy. WT and RECQL4 KO cells were stained for mitochondria (MitoTracker, red) and nuclei (DAPI, blue). Scale bar represents 5 µm. (C) Representative histograms and quantification of mitochondrial transmembrane potential changes in WT and KO LN18 cells. The cells were stained with JC-1 probe and analysed by FACS. CCCP was used as a positive control. The results are shown as red/ green fluorescence intensity ratio (relative FL-2/ FL-1) in RECQL4 KO cells normalized to WT cells, and represent means ± SEM (n = 3). Statistical significance was determined by RM two-way ANOVA, with followed by Tukey’s HSD post hoc test. P values were considered as significant when * p < 0.05, ** p < 0.01. (D) Representative histograms and quantification of mitochondrial transmembrane potential changes in WT and RECQL KO LN229 cells.CC BY · PubMed Central
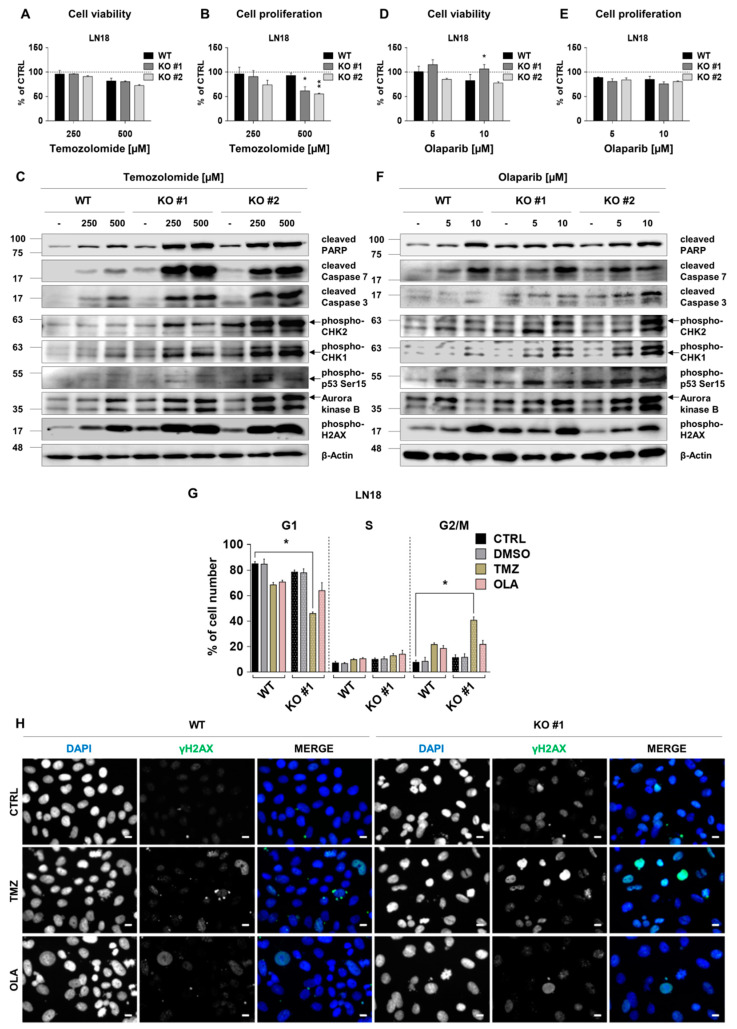
Figure 6 RECQL4 deficiency sensitises LN18 glioblastoma cells to temozolomide or olaparib. WT and RECQL4 KO LN18 cells were exposed to TMZ at concentrations of 250 and 500 µM for 72 h, and cell viability (A) and proliferation (B) were analysed. The results were normalized to untreated cells (CTRL) and represent means ± SEM (n = 4). Statistical significance was determined by RM two-way ANOVA, followed by Tukey’s HSD post hoc test. p-Values were considered as significant when * p < 0.05, ** p < 0.01. (C) Representative immunoblots showing the levels of cell death, proliferation and cell cycle proteins after TMZ treatment. β-Actin was used as a loading control. WT and RECQL4 KO LN18 were exposed to olaparib for 72 h and analysed for cell viability (D) and proliferation (E). The results were normalized to control cells (CTRL, with 0.05% DMSO as a solvent) and represent means ± SEM (n = 4). Statistical significance was calculated as above. (F) Representative immunoblots showing the levels of cell death, proliferation and cell cycle proteins after olaparib treatment in WT and RECQL4 KO cells. β-Actin was used as a loading control. (G) Cell cycle distribution analysis of WT and RECQL4 KO LN18 cells after TMZ (500 µM) or OLA (10 µM) treatment for 72 h. The results are shown as percentage of cell number in each phase of the cell cycle and represent means ± SEM (n = 3). Statistical significance was determined by Kruskal–Wallis one-way ANOVA followed by Dunnett’s post hoc test. p-Values were considered as significant when * p < 0.05., ** p < 0.01. (H) Representative images of immunofluorescent staining showing γH2AX foci and cell nuclei in WT and RECQL4 KO LN18 cells exposed to TMZ (500 µM) or OLA (10 µM) for 48 h. Scale bar represents 10 µm.
Figure 6 RECQL4 deficiency sensitises LN18 glioblastoma cells to temozolomide or olaparib. WT and RECQL4 KO LN18 cells were exposed to TMZ at concentrations of 250 and 500 µM for 72 h, and cell viability (A) and proliferation (B) were analysed. The results were normalized to untreated cells (CTRL) and represent means ± SEM (n = 4). Statistical significance was determined by RM two-way ANOVA, followed by Tukey’s HSD post hoc test. p-Values were considered as significant when * p < 0.05, ** p < 0.01. (C) Representative immunoblots showing the levels of cell death, proliferation and cell cycle proteins after TMZ treatment. β-Actin was used as a loading control. WT and RECQL4 KO LN18 were exposed to olaparib for 72 h and analysed for cell viability (D) and proliferation (E). The results were normalized to control cells (CTRL, with 0.05% DMSO as a solvent) and represent means ± SEM (n = 4). Statistical significance was calculated as above. (F) Representative immunoblots showing the levels of cell death, proliferation and cell cycle proteins after olaparib treatment in WT and RECQL4 KO cells. β-Actin was used as a loading control. (G) Cell cycle distribution analysis of WT and RECQL4 KO LN18 cells after TMZ (500 µM) or OLA (10 µM) treatment for 72 h. The results are shown as percentage of cell number in each phase of the cell cycle and represent means ± SEM (n = 3). Statistical significance was determined by Kruskal–Wallis one-way ANOVA followed by Dunnett’s post hoc test. p-Values were considered as significant when * p < 0.05., ** p < 0.01. (H) Representative images of immunofluorescent staining showing γH2AX foci and cell nuclei in WT and RECQL4 KO LN18 cells exposed to TMZ (500 µM) or OLA (10 µM) for 48 h. Scale bar represents 10 µm.CC BY · PubMed Central
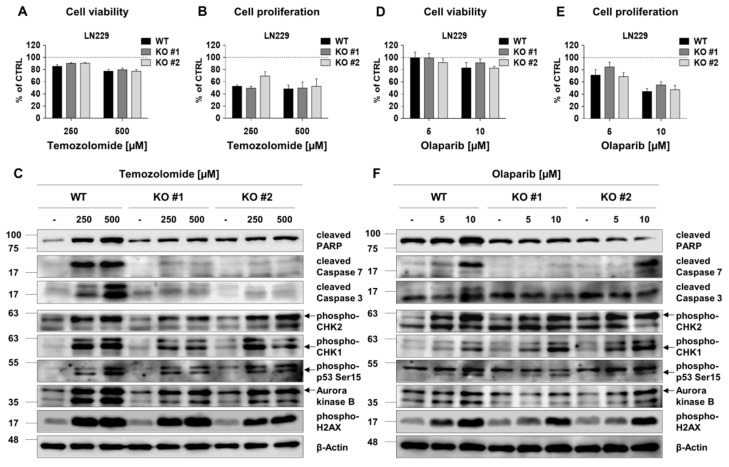
Figure 7 RECQL4 depletion does not sensitize LN229 glioma cells to temozolomide or olaparib. Analyses of viability and proliferation of WT and RECQL4-deficient LN229 cells exposed for 72 h to TMZ (250 and 500 µM) (A,B) or olaparib (5 and 10 µM) (D,E). The results were normalized to control cells (CTRL) and represent means ± SEM (n =4). Statistical significance was determined by RM two-way ANOVA, with followed by Tukey’s HSD post hoc test. Representative immunoblots show the levels of cell death, proliferation and cell cycle proteins after the treatments of WT and RECQL4 KO LN229 cells with TMZ (C) or olaparib (F). β-Actin was used as a loading control.
Figure 7 RECQL4 depletion does not sensitize LN229 glioma cells to temozolomide or olaparib. Analyses of viability and proliferation of WT and RECQL4-deficient LN229 cells exposed for 72 h to TMZ (250 and 500 µM) (A,B) or olaparib (5 and 10 µM) (D,E). The results were normalized to control cells (CTRL) and represent means ± SEM (n =4). Statistical significance was determined by RM two-way ANOVA, with followed by Tukey’s HSD post hoc test. Representative immunoblots show the levels of cell death, proliferation and cell cycle proteins after the treatments of WT and RECQL4 KO LN229 cells with TMZ (C) or olaparib (F). β-Actin was used as a loading control.CC BY · PubMed Central

Verification

Claims the paper makes

The claims and statistics of this paper haven’t been checked yet.

Run the check — free, no account needed. It reads the open-access text and checks the sources it cites.

A few free checks a day · papers already verified open instantly · results are public

Claims other papers make about this one

Each is checked against this paper’s own text: does it say what the citing paper says it does?

Self-check

Percentages, sums and reported differences re-computed from the paper’s own numbers.

The self-check needs the paper’s full text.

Citations

Cites

Show all 2 references

Research works printed but not linked: 37

  1. Mo, 2018, Human RecQL4 helicase plays multifaceted roles in the genomic stability of normal and cancer cells, Cancer Lett., 413, 1, 10.1016/j.canlet.2017.10.021 · DOI
  2. Popuri, 2013, Human RECQL5: Guarding the crossroads of DNA replication and transcription and providing backup capability, Crit. Rev. Biochem. Mol. Biol., 48, 289, 10.3109/10409238.2013.792770 · DOI
  3. Lu, 2014, Senescence induced by RECQL4 dysfunction contributes to Rothmund-Thomson syndrome features in mice, Cell Death Dis., 5, e1226, 10.1038/cddis.2014.168 · DOI
  4. Singh, 2010, The involvement of human RECQL4 in DNA double-strand break repair, Aging Cell., 9, 358, 10.1111/j.1474-9726.2010.00562.x · DOI
  5. Werner, 2006, RECQL4-deficient cells are hypersensitive to oxidative stress/damage: Insights for osteosarcoma prevalence and heterogeneity in Rothmund-Thomson syndrome, Biochem. Biophys. Res. Commun., 345, 403, 10.1016/j.bbrc.2006.04.093 · DOI
  6. Jin, 2008, Sensitivity of RECQL4-deficient fibroblasts from Rothmund-Thomson syndrome patients to genotoxic agents, Hum. Genet., 123, 643, 10.1007/s00439-008-0518-4 · DOI
  7. Abe, 2011, The N-terminal region of RECQL4 lacking the helicase domain is both essential and sufficient for the viability of vertebrate cells. Role of the N-terminal region of RECQL4 in cells, Biochim. Biophys. Acta., 1813, 473, 10.1016/j.bbamcr.2011.01.001 · DOI
  8. Sun, J., Wang, Y., Xia, Y., Xu, Y., Ouyang, T., Li, J., Wang, T., Fan, Z., Fan, T., and Lin, B. (2015). Mutations in RECQL Gene Are Associated with Predisposition to Breast Cancer. PLoS Genet., 11. · DOI
  9. Wibom, 2012, DNA-repair gene variants are associated with glioblastoma survival, Acta Oncol., 51, 325, 10.3109/0284186X.2011.616284 · DOI
  10. Maire, 2009, Recurrent RECQL4 imbalance and increased gene expression levels are associated with structural chromosomal instability in sporadic osteosarcoma, Neoplasia., 11, 260, 10.1593/neo.81384 · DOI
  11. Fang, H., Nie, L., Chi, Z., Liu, J., Guo, D., Lu, X., Hei, T.K., Balajee, A.S., and Zhao, Y. (2013). RecQL4 helicase amplification is involved in human breast tumorigenesis. PLoS ONE., 8. · DOI
  12. Arora, 2016, RECQL4 helicase has oncogenic potential in sporadic breast cancers, J. Pathol., 238, 495, 10.1002/path.4681 · DOI
  13. Su, 2010, Human RecQL4 helicase plays critical roles in prostate carcinogenesis, Cancer Res., 70, 9207, 10.1158/0008-5472.CAN-10-1743 · DOI
  14. Ostrom, 2014, The epidemiology of glioma in adults: A "state of the science" review, Neuro Oncol., 16, 896, 10.1093/neuonc/nou087 · DOI
  15. Anjum, 2017, Current status and future therapeutic perspectives of glioblastoma multiforme (GBM) therapy: A review, Biomed. Pharmacother., 92, 681, 10.1016/j.biopha.2017.05.125 · DOI
  16. Visvader, 2012, Cancer stem cells: Current status and evolving complexities, Cell Stem. Cell., 10, 717, 10.1016/j.stem.2012.05.007 · DOI
  17. Auffinger, 2015, The role of glioma stem cells in chemotherapy resistance and glioblastoma multiforme recurrence, Expert Rev. Neurother., 15, 741, 10.1586/14737175.2015.1051968 · DOI
  18. Stupp, 2009, Effects of radiotherapy with concomitant and adjuvant temozolomide versus radiotherapy alone on survival in glioblastoma in a randomised phase III study: 5-year analysis of the EORTC-NCIC trial, Lancet Oncol., 10, 459, 10.1016/S1470-2045(09)70025-7 · DOI
  19. Lee, 2016, Temozolomide resistance in glioblastoma multiforme, Genes Dis., 3, 198, 10.1016/j.gendis.2016.04.007 · DOI
  20. Ciechomska, 2016, BIX01294, an inhibitor of histone methyltransferase, induces autophagy-dependent differentiation of glioma stem-like cells, Sci. Rep., 6, 38723, 10.1038/srep38723 · DOI
  21. Kent, 2002, The human genome browser at UCSC, Genome Res., 12, 996, 10.1101/gr.229102 · DOI · Paper page
  22. Tarazona, 2015, Data quality aware analysis of differential expression in RNA-seq with NOISeq R/Bioc package, Nucleic. Acids Res., 43, e140
  23. Chikina, 2016, Hundreds of Genes Experienced Convergent Shifts in Selective Pressure in Marine Mammals, Mol. Biol. Evol., 33, 2182, 10.1093/molbev/msw112 · DOI · Paper page
  24. Croteau, 2012, RECQL4 localizes to mitochondria and preserves mitochondrial DNA integrity, Aging Cell., 11, 456, 10.1111/j.1474-9726.2012.00803.x · DOI
  25. Hermisson, 2006, O6-methylguanine DNA methyltransferase and p53 status predict temozolomide sensitivity in human malignant glioma cells, J. Neurochem., 96, 766, 10.1111/j.1471-4159.2005.03583.x · DOI
  26. Jariyal, 2020, Synthetic lethality: A step forward for personalized medicine in cancer, Drug Discov. Today, 25, 305, 10.1016/j.drudis.2019.11.014 · DOI
  27. Washington, 2019, Olaparib in the treatment of ovarian cancer, Future Oncol., 15, 3435, 10.2217/fon-2019-0271 · DOI
  28. Caulfield, 2019, Olaparib: A Novel Therapy for Metastatic Breast Cancer in Patients with a BCRA1/2 mutation, J. Adv. Pract. Oncol., 10, 167
  29. Berte, 2016, Targeting Homologous Recombination by Pharmacological Inhibitors Enhances the Killing Response of Glioblastoma Cells Treated with Alkylating Drugs, Mol. Cancer Ther., 15, 2665, 10.1158/1535-7163.MCT-16-0176 · DOI
  30. Veith, 2015, RecQ helicases and PARP1 team up in maintaining genome integrity, Ageing Res. Rev., 23, 12, 10.1016/j.arr.2014.12.006 · DOI
  31. Ahmed, 2015, Selective Inhibition of Parallel DNA Damage Response Pathways Optimizes Radiosensitization of Glioblastoma Stem-like Cells, Cancer Res., 75, 4416, 10.1158/0008-5472.CAN-14-3790 · DOI
  32. Farmer, 2005, Targeting the DNA repair defect in BRCA mutant cells as a therapeutic strategy, Nature, 434, 917, 10.1038/nature03445 · DOI · Paper page
  33. Bryant, 2005, Specific killing of BRCA2-deficient tumours with inhibitors of poly(ADP-ribose) polymerase, Nature, 434, 913, 10.1038/nature03443 · DOI · Paper page
  34. Woo, 2006, The Rothmund-Thomson gene product RECQL4 localizes to the nucleolus in response to oxidative stress, Exp. Cell Res., 312, 3443, 10.1016/j.yexcr.2006.07.023 · DOI
  35. Mo, 2016, Human Helicase RECQL4 Drives Cisplatin Resistance in Gastric Cancer by Activating an AKT-YB1-MDR1 Signaling Pathway, Cancer Res., 76, 3057, 10.1158/0008-5472.CAN-15-2361 · DOI
  36. Ceccarelli, 2016, Molecular Profiling Reveals Biologically Discrete Subsets and Pathways of Progression in Diffuse Glioma, Cell, 164, 550, 10.1016/j.cell.2015.12.028 · DOI
  37. Gao, 2013, Integrative analysis of complex cancer genomics and clinical profiles using the cBioPortal, Sci. Signal., 6, l1, 10.1126/scisignal.2004088 · DOI · Paper page

Cited by

Sorted by citations

See all 28

Metadata

Authors
Król, S. K., Kaczmarczyk, A., Wojnicki, K., Wojtas, B., Gielniewski, B., Grajkowska, W., Kotulska, K., Szczylik, C., Czepko, R., Banach, M., Kaspera, W., Szopa, W., Marchel, A., Czernicki, T., & Kaminska, B.
Affiliations
  • Laboratory of Molecular Neurobiology, Nencki Institute of Experimental Biology of the Polish Academy of Sciences, 02-093 Warsaw, Poland
  • Depts. Neurology and Neuropathology, Children’s Memorial Health Institute, 04-730 Warsaw, Poland
  • Department of Oncology, Military Institute of Medicine, 04-141 Warsaw, Poland
  • Department of Neurosurgery, Scanmed S.A. St. Raphael Hospital, Andrzej Frycz Modrzewski Krakow University, 31-705 Krakow, Poland
  • Department of Neurosurgery, Medical University of Silesia, Regional Hospital, 04-730 Sosnowiec, Poland
  • Department of Neurosurgery, Medical University of Warsaw, 02-097 Warsaw, Poland
Venue
Cancers
Publisher
MDPI AG
Published
2020-10-11
Volume
12
Issue
10
Pages
2919
ISSN
2072-6694
Cited by
28
References
2
Language
en
Funders
  • Narodowe Centrum Nauki (2015/19/N/NZ3/02374 (SKK) and 2016/22/M/NZ3/00679 (BK))
  • Fundacja na rzecz Nauki Polskiej (TEAM-TECH Core Facility project „NGS platform for comprehensive diagnostics and personalized therapy in neuro-oncology)

About these checks

Registry, retraction, Cites and statistics results are computed, not judged, with one exception: a printed reference that no index lists is read once by a model before it counts as a citation error. Claims are extracted by a model and kept only when their quote appears verbatim in the text; each cited source is then checked, with a model’s help, for whether it says what the claim relies on. Those verdicts can be wrong — read the claim’s quote and the cited source before relying on one.

Statistics and arithmetic are recomputed, not judged.

Confidence bands are shown only for fields calibrated on our annotated test set. None is calibrated yet, so no band is shown.

What counts as a claim ›How we measure confidence ›How we check this ›

Are you an author, or do you see a problem with this page? Request a review

How to cite

Cite CoChat for the checks on this page, and the paper for its own findings.

This page
CoChat. (2026). Citation check: Aberrantly Expressed RECQL4 Helicase Supports Proliferation and Drug Resistance of Human Glioma Cells and Glioma Stem Cells. https://app.cochat.ai/papers/10.3390/cancers12102919
The paper
Król, S. K., Kaczmarczyk, A., Wojnicki, K., Wojtas, B., Gielniewski, B., Grajkowska, W., Kotulska, K., Szczylik, C., Czepko, R., Banach, M., Kaspera, W., Szopa, W., Marchel, A., Czernicki, T., & Kaminska, B. (2020). Aberrantly Expressed RECQL4 Helicase Supports Proliferation and Drug Resistance of Human Glioma Cells and Glioma Stem Cells. Cancers. https://doi.org/10.3390/cancers12102919