

The DOI matches its Crossref record; 205 of the 205 references it cites were found in a registry or an index.
Linking Metabolic Reprogramming, Plasticity and Tumor Progression
Open accessAbstract
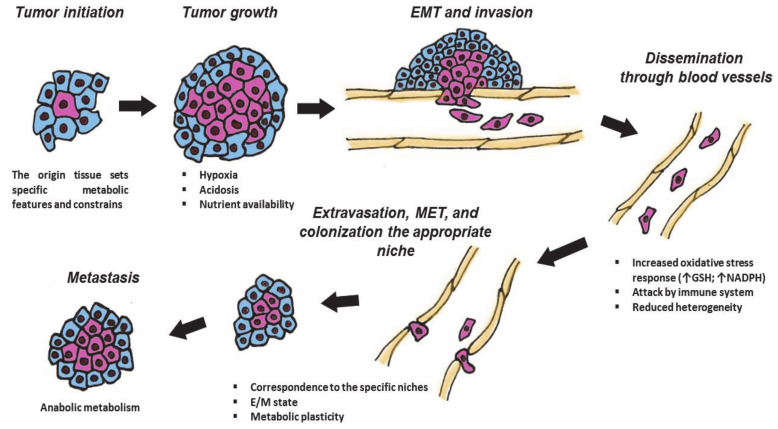
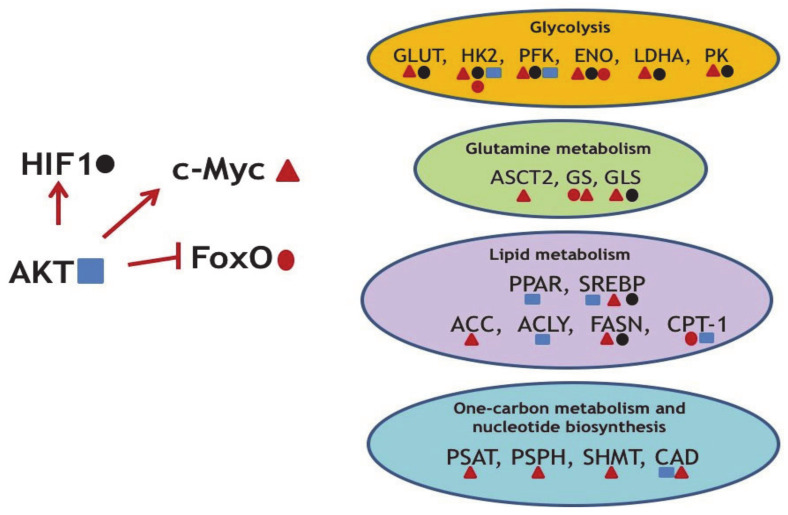
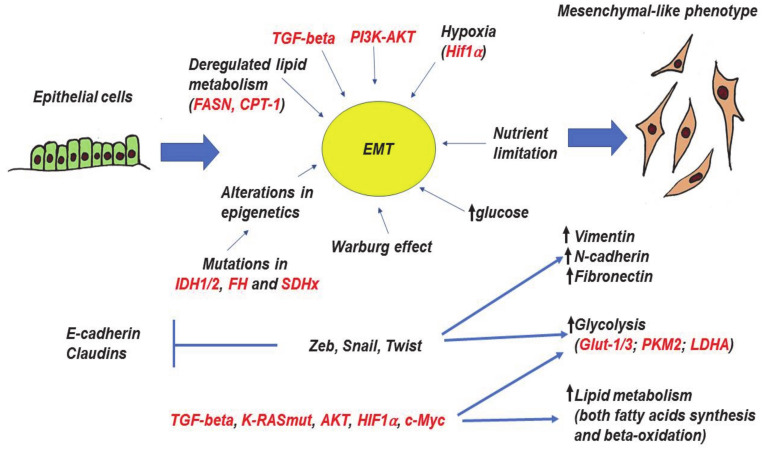
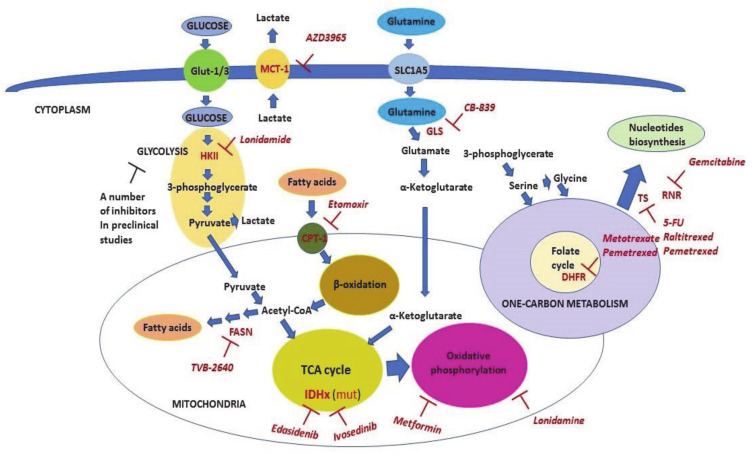
The specific molecular features of cancer cells that distinguish them from the normal ones are denoted as “hallmarks of cancer”. One of the critical hallmarks of cancer is an altered metabolism which provides tumor cells with energy and structural resources necessary for rapid proliferation. The key feature of a cancer-reprogrammed metabolism is its plasticity, allowing cancer cells to better adapt to various conditions and to oppose different therapies. Furthermore, the alterations of metabolic pathways in malignant cells are heterogeneous and are defined by several factors including the tissue of origin, driving mutations, and microenvironment. In the present review, we discuss the key features of metabolic reprogramming and plasticity associated with different stages of tumor, from primary tumors to metastases. We also provide evidence of the successful usage of metabolic drugs in anticancer therapy. Finally, we highlight new promising targets for the development of new metabolic drugs.
Overview
The claims and statistics of this paper haven’t been checked yet.
Run the check — free, no account needed. It reads the open-access text and checks the sources it cites.
Integrity signals
Registry
Cites
Statistics
Figures
Verification
Claims the paper makes
The claims and statistics of this paper haven’t been checked yet.
Run the check — free, no account needed. It reads the open-access text and checks the sources it cites.
Claims other papers make about this one
Each is checked against this paper’s own text: does it say what the citing paper says it does?
In the citing paper
“Metabolic rewiring, including different metabolic alterations, is considered to be one of the “hallmarks of cancer” [20].”
From 20-Hydroxyecdysone Confers Antioxidant and Antineoplastic Properties in Human Non-Small Cell Lung Cancer Cells (2023) · cites this paper as [20]
In the citing paper
“As stated earlier, increased glycolysis and one-carbon metabolism are known to be widely observed in various malignancies [20].”
From 20-Hydroxyecdysone Confers Antioxidant and Antineoplastic Properties in Human Non-Small Cell Lung Cancer Cells (2023) · cites this paper as [20]
In the citing paper
“Different oncogenes and oncosupressors have a critical impact on these metabolic pathways [20,40,46,47,75,76].”
From 20-Hydroxyecdysone Confers Antioxidant and Antineoplastic Properties in Human Non-Small Cell Lung Cancer Cells (2023) · cites this paper as [20]
In the citing paper
“Metabolic rewiring is considered one of the “hallmarks of cancer” [20].”
From 20-Hydroxyecdysone Confers Antioxidant and Antineoplastic Properties in Human Non-Small Cell Lung Cancer Cells (2023) · cites this paper as [20]
In the citing paper
“A number of glycolytic and OxPHOS inhibitors are currently being investigated in preclinical and clinical studies [20,77].”
From 20-Hydroxyecdysone Confers Antioxidant and Antineoplastic Properties in Human Non-Small Cell Lung Cancer Cells (2023) · cites this paper as [20]
Self-check
Percentages, sums and reported differences re-computed from the paper’s own numbers.
The self-check needs the paper’s full text.
Citations
Cites
1 retracted
Wang, L., Li, C., Song, Y., et al. (2020) · Archives of Biochemistry and Biophysics · doi:10.1016/j.abb.2020.108664 · Cited by 56
RetractedHallmarks of Cancer: The Next Generation
Hanahan, D., & Weinberg, R. A. (2011) · Cell · doi:10.1016/j.cell.2011.02.013 · Cited by 66,590
The Warburg Effect: How Does it Benefit Cancer Cells?
Liberti, M. V., & Locasale, J. W. (2016) · Trends in Biochemical Sciences · doi:10.1016/j.tibs.2015.12.001 · Cited by 5,150
Figueroa, M. E., Abdel-Wahab, O., Lu, C., Ward, P. S., Patel, J., Shih, A., Li, Y., Bhagwat, N., Vasanthakumar, A., Fernandez, H. F., et al. (2010) · Cancer Cell · doi:10.1016/j.ccr.2010.11.015 · Cited by 2,766
Metabolic reprogramming and cancer progression
Faubert, B., Solmonson, A., & DeBerardinis, R. J. (2020) · Science · doi:10.1126/science.aaw5473 · Cited by 2,740
From Krebs to clinic: glutamine metabolism to cancer therapy
Altman, B. J., Stine, Z. E., & Dang, C. V. (2016) · Nature Reviews Cancer · doi:10.1038/nrc.2016.71 · Cited by 2,119
Succinate links TCA cycle dysfunction to oncogenesis by inhibiting HIF-α prolyl hydroxylase
Selak, M. A., Armour, S. M., MacKenzie, E. D., Boulahbel, H., Watson, D. G., Mansfield, K. D., Pan, Y., Simon, M. C., Thompson, C. B., & Gottlieb, E. (2005) · Cancer Cell · doi:10.1016/j.ccr.2004.11.022 · Cited by 2,108 · cited 1×
“Another mechanism that mediates progression of tumors with FH and SDHx mutations relies on the intracellular accumulation of both fumarate and succinate, which consequently promote HIF1a stabilization [164,165] and execution of its transcriptional program.”
BackgroundWise, D. R., DeBerardinis, R. J., Mancuso, A., Sayed, N., Zhang, X.-Y., Pfeiffer, H. K., Nissim, I., Daikhin, E., Yudkoff, M., McMahon, S. B., et al. (2008) · Proceedings of the National Academy of Sciences · doi:10.1073/pnas.0810199105 · Cited by 2,001
IDH1 mutation is sufficient to establish the glioma hypermethylator phenotype
Turcan, S., Rohle, D., Goenka, A., Walsh, L. A., Fang, F., Yilmaz, E., Campos, C., Fabius, A. W. M., Lu, C., Ward, P. S., et al. (2012) · Nature · doi:10.1038/nature10866 · Cited by 1,974
RAS Proteins and Their Regulators in Human Disease
Simanshu, D. K., Nissley, D. V., & McCormick, F. (2017) · Cell · doi:10.1016/j.cell.2017.06.009 · Cited by 1,943
Cited by
Sorted by citations
Shuvalov, O., Kirdeeva, Y., Fefilova, E., Netsvetay, S., Zorin, M., Vlasova, Y., Fedorova, O., Daks, A., Parfenyev, S., & Barlev, N. (2023) · Metabolites · doi:10.3390/metabo13050656 · Cited by 21
Self-citationDaks, A., Shuvalov, O., Fedorova, O., Petukhov, A., Lezina, L., Zharova, A., Baidyuk, E., Khudiakov, A., & Barlev, N. A. (2021) · Frontiers in Oncology · doi:10.3389/fonc.2021.706668 · Cited by 15
Shuvalov, O., Kirdeeva, Y., Fefilova, E., Daks, A., Fedorova, O., Parfenyev, S., Nazarov, A., Vlasova, Y., Krasnov, G. S., & Barlev, N. A. (2024) · Antioxidants · doi:10.3390/antiox13111349 · Cited by 9
Self-citation
Metadata
- Authors
- Shuvalov, O., Daks, A., Fedorova, O., Petukhov, A., & Barlev, N.
- Affiliations
- Institute of Cytology (RU)
- Federal Almazov North-West Medical Research Centre (RU)
- Moscow Institute of Physics and Technology (RU)
- Corresponding author
- Barlev, Nickolai
- Venue
- Cancers
- Publisher
- MDPI AG
- Published
- 2021-02-12
- Volume
- 13
- Issue
- 4
- Pages
- 762
- ISSN
- 2072-6694 (ISSN-L)
- PMC
- PMC7917602
- OpenAlex
- W3132705638
- Cited by
- 63
- References
- 205
- Citations by year
- 2026: 13 · 2025: 13 · 2024: 10 · 2023: 6 · 2022: 14 · 2021: 7
- FWCI
- 1.12
- Type
- journal article
- Language
- en
- Open access
- gold
- doi.org
- Licence
- Locations
- Cancers (publishedVersion, cc-by)
- PubMed Central (publishedVersion, cc-by)
- PubMed (publishedVersion)
- DOAJ (DOAJ: Directory of Open Access Journals) (submittedVersion, cc-by-sa)
- Funders
- Russian Science Foundation (#19-45-02011)
- Topics
- Life Sciences › Biochemistry, Genetics and Molecular Biology › Cancer Research › Cancer, Hypoxia, and Metabolism
- Life Sciences › Biochemistry, Genetics and Molecular Biology › Molecular Biology › Metabolism, Diabetes, and Cancer
- Life Sciences › Biochemistry, Genetics and Molecular Biology › Cancer Research › Cancer, Lipids, and Metabolism
- Keywords
- tumor metabolic reprogramming, metabolic plasticity, tumor progression, cancer hallmarks, tumor microenvironment, metastasis, metabolic drugs, cancer therapy, tumor heterogeneity
About these checks
Registry, retraction, Cites and statistics results are computed, not judged, with one exception: a printed reference that no index lists is read once by a model before it counts as a citation error. Claims are extracted by a model and kept only when their quote appears verbatim in the text; each cited source is then checked, with a model’s help, for whether it says what the claim relies on. Those verdicts can be wrong — read the claim’s quote and the cited source before relying on one.
Statistics and arithmetic are recomputed, not judged.
Confidence bands are shown only for fields calibrated on our annotated test set. None is calibrated yet, so no band is shown.
What counts as a claim ›How we measure confidence ›How we check this ›
Are you an author, or do you see a problem with this page? Request a review
