Cited by 25

The DOI matches its Crossref record.

Rewiring Lipid Metabolism by Targeting PCSK9 and HMGCR to Treat Liver Cancer

Alannan, Malak, Trézéguet, Véronique, Amoêdo, Nivea Dias, Rossignol, Rodrigue, Mahfouf, Walid, Rezvani, Hamid Reza, Dittrich-Domergue, Franziska, Moreau, Patrick, Lacomme, Sabrina, Gontier, Etienne, Grosset, Christophe F., Badran, Bassam, Fayyad-Kazan, Hussein, Merched, Aksam J.·2022·Cancers

Abstract

Alterations in lipid handling are an important hallmark in cancer. Our aim here is to target key metabolic enzymes to reshape the oncogenic lipid metabolism triggering irreversible cell breakdown. We targeted the key metabolic player proprotein convertase subtilisin/kexin type 9 (PCSK9) using a pharmacological inhibitor (R-IMPP) alone or in combination with 3-hydroxy 3-methylglutaryl-Coenzyme A reductase (HMGCR) inhibitor, simvastatin. We assessed the effect of these treatments using 3 hepatoma cell lines, Huh6, Huh7 and HepG2 and a tumor xenograft in chicken choriorallantoic membrane (CAM) model. PCSK9 deficiency led to dose-dependent inhibition of cell proliferation in all cell lines and a decrease in cell migration. Co-treatment with simvastatin presented synergetic anti-proliferative effects. At the metabolic level, mitochondrial respiration assays as well as the assessment of glucose and glutamine consumption showed higher metabolic adaptability and surge in the absence of PCSK9. Enhanced lipid uptake and biogenesis led to excessive accumulation of intracellular lipid droplets as revealed by electron microscopy and metabolic tracing. Using xenograft experiments in CAM model, we further demonstrated the effect of anti-PCSK9 treatment in reducing tumor aggressiveness. Targeting PCSK9 alone or in combination with statins deserves to be considered as a new therapeutic option in liver cancer clinical applications.

Overview

The claims and statistics of this paper haven’t been checked yet.

Run the check — free, no account needed. It reads the open-access text and checks the sources it cites.

A few free checks a day · papers already verified open instantly · results are public

Integrity signals

Registry

Crossref · 10.3390/cancers15010003

Cites

Statistics

Figures

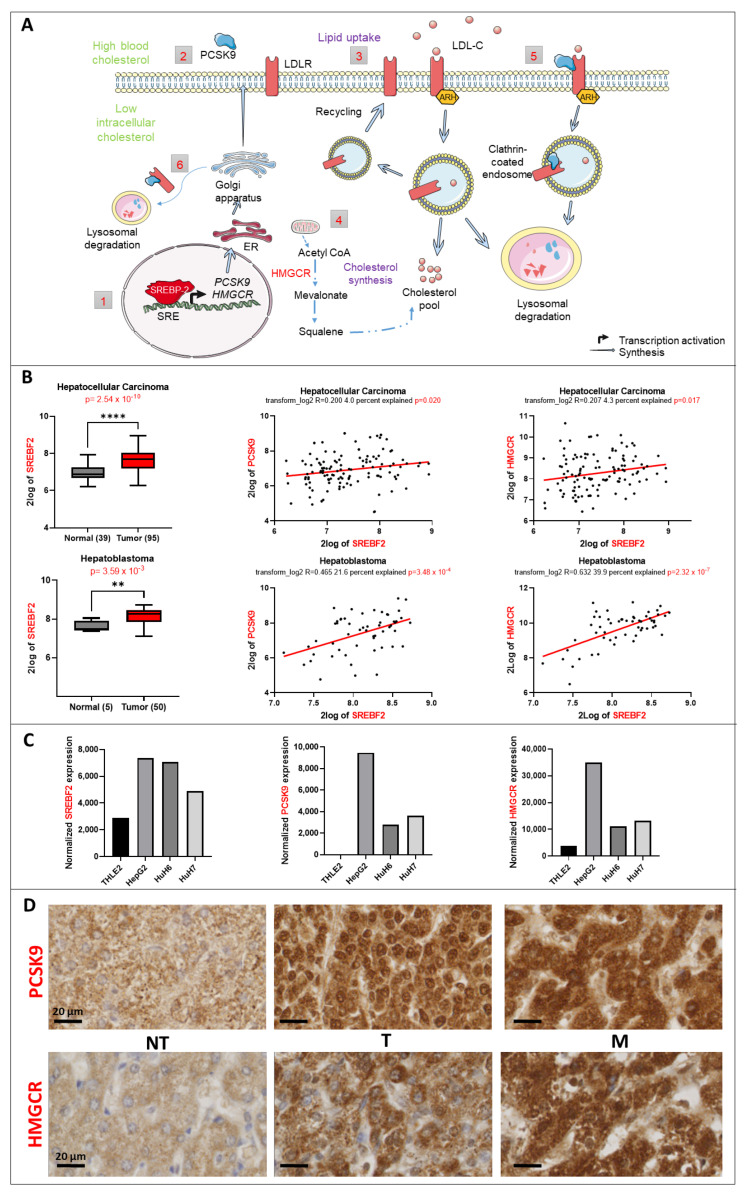
Figure 1 Lipid metabolic changes in liver cancer. (A) Control of the lipid metabolism by the transcription factor SREBP2. (1) SREBP2 is a transcription factor that regulates the expression of PCSK9 and HMGCR genes (2) The synthesis of PCSK9 is regulated transcriptionally by SREBP-2. Once translated, it will travel through the endoplasmic reticulum (ER) and Golgi apparatus for maturation before being secreted. (3) Lipid uptake: In response to high blood cholesterol, LDLR expressed on the cell surface will bind to LDL-cholesterol (LDL-C) and will be internalized in an autosomal recessive hypercholesterolemia (ARH)-dependent manner via clathrin-coated endosomes. Inside the endosomes, LDL-C will dissociate from the receptor and will be directed toward lysosomal degradation, whilst LDLR will be recycled back to the cell surface. (4) Cholesterol synthesis: HMGCR is the rate-limiting enzyme that catalyzes the de novo synthesis of cholesterol to increase its levels in response to a decrease in the intracellular levels of cholesterol. (5) Extracellular and (6) intracellular pathway regulation of LDLR by PCSK9: in both pathways, PCSK9 binds to the epidermal growth factor (EGF)-like domain of LDLR and targets it to lysosomal degradation instead of recycling. (B) SREBF2 gene expression upregulation in 2 transcriptomic datasets and its correlation to PCSK9 and HMGCR genes generated from R2: Genomics Analysis and Visualization Platform “http://r2.amc.nl” (accessed on 23 September 2022). Upper histogram, hepatocellular carcinoma (HCC): Wu—134—MAS 5.0—u133p2. Lower histogram, hepatoblastoma (HB): López-Terrada—55—fRMA—u133p2. Unpaired t-test, ** p < 0.01; **** p < 0.0001. Each histogram is followed by two-tailed pearson correlation which shows a positive correlation between SREBF2 and PCSK9 as well as SREBF2 and HMGCR gene expression in the same datasets. (C) Normalized gene expression of SREBF2, PCSK9 and HMGCR in three liver cancer cell lines (HepG2, Huh6 and Huh7) and one normal cell line (THLE2). (D) PCSK9 and HMGCR staining of HB tumoral (T) tissues were compared to non-tumoral (NT) tissues from the same patients. The staining in metastatic (M) tissues (diaphragm) was also checked. Samples were collected as described in materials and methods. The black bars represent 20 µm.
Figure 1 Lipid metabolic changes in liver cancer. (A) Control of the lipid metabolism by the transcription factor SREBP2. (1) SREBP2 is a transcription factor that regulates the expression of PCSK9 and HMGCR genes (2) The synthesis of PCSK9 is regulated transcriptionally by SREBP-2. Once translated, it will travel through the endoplasmic reticulum (ER) and Golgi apparatus for maturation before being secreted. (3) Lipid uptake: In response to high blood cholesterol, LDLR expressed on the cell surface will bind to LDL-cholesterol (LDL-C) and will be internalized in an autosomal recessive hypercholesterolemia (ARH)-dependent manner via clathrin-coated endosomes. Inside the endosomes, LDL-C will dissociate from the receptor and will be directed toward lysosomal degradation, whilst LDLR will be recycled back to the cell surface. (4) Cholesterol synthesis: HMGCR is the rate-limiting enzyme that catalyzes the de novo synthesis of cholesterol to increase its levels in response to a decrease in the intracellular levels of cholesterol. (5) Extracellular and (6) intracellular pathway regulation of LDLR by PCSK9: in both pathways, PCSK9 binds to the epidermal growth factor (EGF)-like domain of LDLR and targets it to lysosomal degradation instead of recycling. (B) SREBF2 gene expression upregulation in 2 transcriptomic datasets and its correlation to PCSK9 and HMGCR genes generated from R2: Genomics Analysis and Visualization Platform “http://r2.amc.nl” (accessed on 23 September 2022). Upper histogram, hepatocellular carcinoma (HCC): Wu—134—MAS 5.0—u133p2. Lower histogram, hepatoblastoma (HB): López-Terrada—55—fRMA—u133p2. Unpaired t-test, ** p < 0.01; **** p < 0.0001. Each histogram is followed by two-tailed pearson correlation which shows a positive correlation between SREBF2 and PCSK9 as well as SREBF2 and HMGCR gene expression in the same datasets. (C) Normalized gene expression of SREBF2, PCSK9 and HMGCR in three liver cancer cell lines (HepG2, Huh6 and Huh7) and one normal cell line (THLE2). (D) PCSK9 and HMGCR staining of HB tumoral (T) tissues were compared to non-tumoral (NT) tissues from the same patients. The staining in metastatic (M) tissues (diaphragm) was also checked. Samples were collected as described in materials and methods. The black bars represent 20 µm.CC BY · PubMed Central
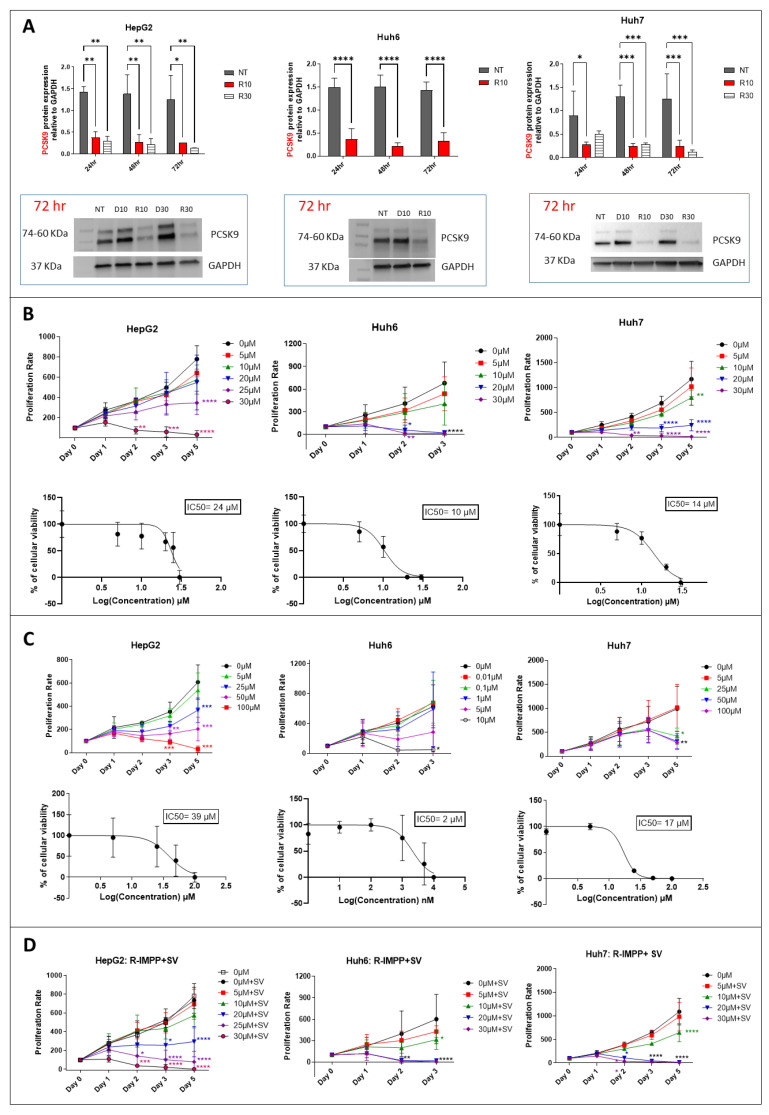
Figure 2 Effect of pharmacological inhibition of PCSK9 and HMGCR on cellular proliferation. (A) Inhibition of PCSK9 protein level by R-IMPP. Huh7 and HepG2 cells were treated with 10 and 30 μM of R-IMPP, whilst Huh6 cells were treated with 10 μM of R-IMPP. PCSK9 protein level was evaluated by Western blot in these 2 conditions 24, 48 and 72 h after treatment. Internal GAPDH was used for protein normalization (n = 3). NT: non-treated; D: DMSO; R: R-IMPP. (B) Dose-dependent inhibition of cell growth by R-IMPP as evaluated by MTS analyses. IC50 at day 3 is given for each cell line. (C) Proliferation was evaluated up to 5 days after SV treatment except for Huh6 where the experiment was stopped at day 3 because of the extensive cell death at this time point. IC50 at day 3 is given for each cell. (D) Effect of R-IMPP treatment in combination with SV. The concentrations of SV were selected close to the IC50 data from (C) (25 μM SV for Huh7 and HepG2 and 5 μM for Huh6). * Two-way ANOVA test. * p < 0.05; ** p < 0.01; *** p < 0.001; **** p < 0.0001. Supplementary Materials: original-images of western blot figures.
Figure 2 Effect of pharmacological inhibition of PCSK9 and HMGCR on cellular proliferation. (A) Inhibition of PCSK9 protein level by R-IMPP. Huh7 and HepG2 cells were treated with 10 and 30 μM of R-IMPP, whilst Huh6 cells were treated with 10 μM of R-IMPP. PCSK9 protein level was evaluated by Western blot in these 2 conditions 24, 48 and 72 h after treatment. Internal GAPDH was used for protein normalization (n = 3). NT: non-treated; D: DMSO; R: R-IMPP. (B) Dose-dependent inhibition of cell growth by R-IMPP as evaluated by MTS analyses. IC50 at day 3 is given for each cell line. (C) Proliferation was evaluated up to 5 days after SV treatment except for Huh6 where the experiment was stopped at day 3 because of the extensive cell death at this time point. IC50 at day 3 is given for each cell. (D) Effect of R-IMPP treatment in combination with SV. The concentrations of SV were selected close to the IC50 data from (C) (25 μM SV for Huh7 and HepG2 and 5 μM for Huh6). * Two-way ANOVA test. * p < 0.05; ** p < 0.01; *** p < 0.001; **** p < 0.0001. Supplementary Materials: original-images of western blot figures.CC BY · PubMed Central
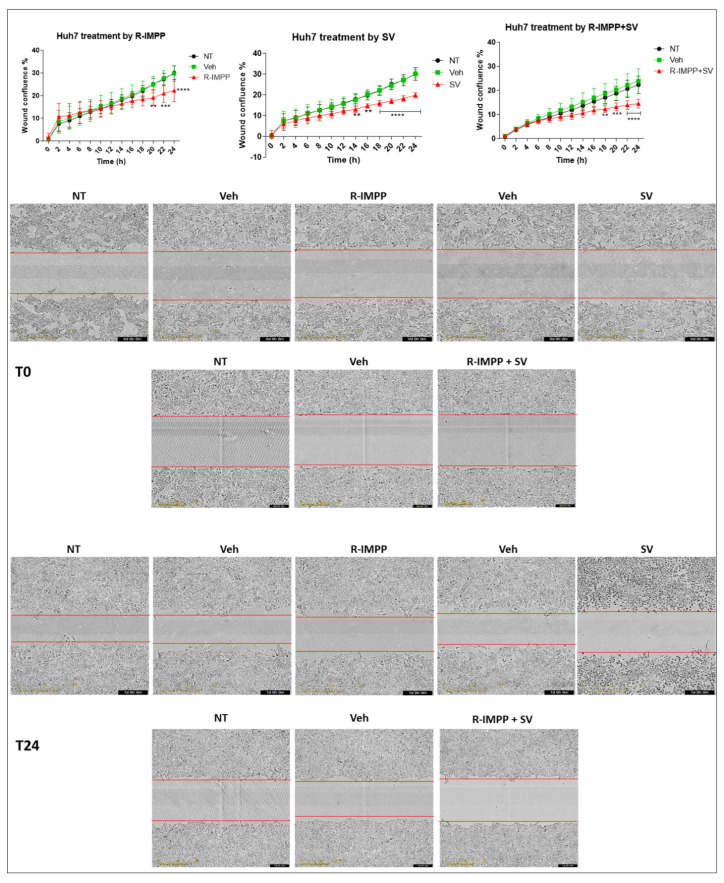
Figure 3 Effect of pharmacological inhibition of PCSK9 by R-IMPP on cellular migration. Effect of inhibition of PCSK9 by R-IMPP and/or HMGCR by SV on Huh7 cell migration in a wound healing assay using IncuCyte. Wound-healing confluence was followed for up to 24 h after treatment with 10 µM R-IMPP or 25 µM SV or a combination of both. NT refers to non-treated cells. Veh stands for R-IMPP (0.001% DMSO) and SV (0.001% ethanol) solvents. Two-way ANOVA test. ** p < 0.01; *** p < 0.001; **** p < 0.0001.
Figure 3 Effect of pharmacological inhibition of PCSK9 by R-IMPP on cellular migration. Effect of inhibition of PCSK9 by R-IMPP and/or HMGCR by SV on Huh7 cell migration in a wound healing assay using IncuCyte. Wound-healing confluence was followed for up to 24 h after treatment with 10 µM R-IMPP or 25 µM SV or a combination of both. NT refers to non-treated cells. Veh stands for R-IMPP (0.001% DMSO) and SV (0.001% ethanol) solvents. Two-way ANOVA test. ** p < 0.01; *** p < 0.001; **** p < 0.0001.CC BY · PubMed Central
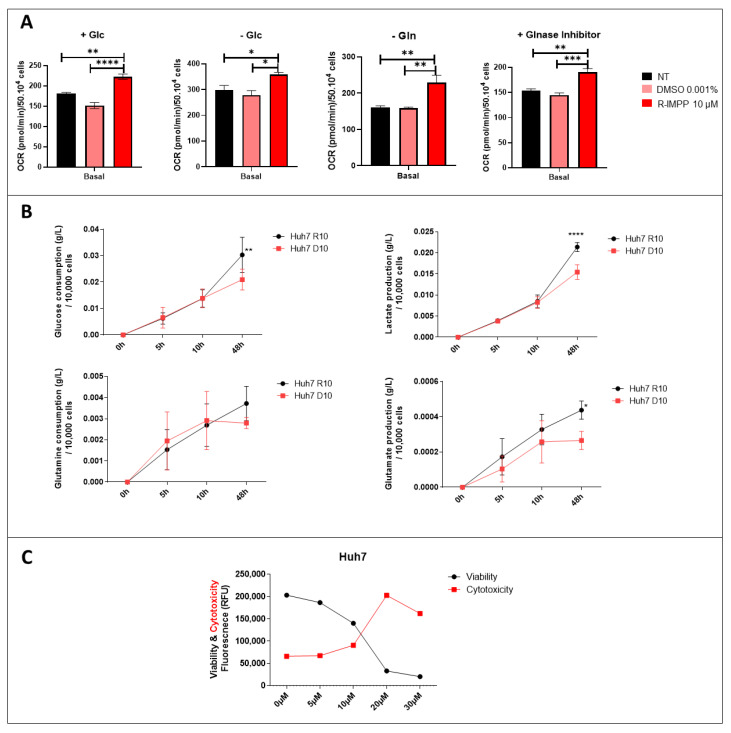
Figure 4 Effect of inhibition of PCSK9 on mitochondrial respiration and metabolic pathways. (A) OCR was evaluated by the Seahorse assay in Huh7 cells, which were incubated in different media settings, as indicated. NT: non-treated. * Ordinary one-way ANOVA test. (B) Glucose and glutamine consumption as well as lactate and glutamate production by Huh7 cells treated with R-IMMP (10 μM) vs. DMSO (D10) were measured at different time intervals. * Two-way ANOVA test. * p < 0.05; ** p < 0.01; *** p < 0.001; **** p < 0.0001. (C) Viability and cytotoxicity were measured by ApotoxGlo™ Assay in Huh7 cells treated with different doses of R-IMPP for 48 h (n = 1).
Figure 4 Effect of inhibition of PCSK9 on mitochondrial respiration and metabolic pathways. (A) OCR was evaluated by the Seahorse assay in Huh7 cells, which were incubated in different media settings, as indicated. NT: non-treated. * Ordinary one-way ANOVA test. (B) Glucose and glutamine consumption as well as lactate and glutamate production by Huh7 cells treated with R-IMMP (10 μM) vs. DMSO (D10) were measured at different time intervals. * Two-way ANOVA test. * p < 0.05; ** p < 0.01; *** p < 0.001; **** p < 0.0001. (C) Viability and cytotoxicity were measured by ApotoxGlo™ Assay in Huh7 cells treated with different doses of R-IMPP for 48 h (n = 1).CC BY · PubMed Central
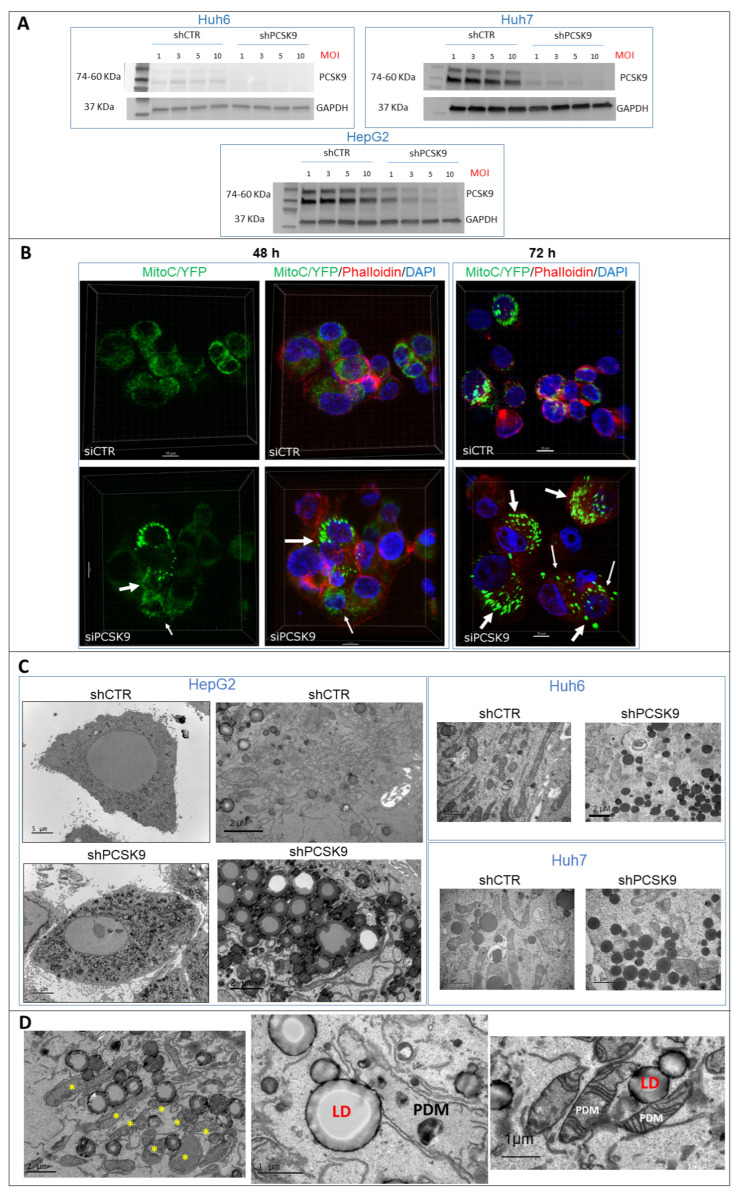
Figure 5 PCSK9 deficiency leads to intracellular accumulation of lipid droplets. (A) Validation of depletion of PCSK9 by shRNA silencing. Cell extracts were prepared after transduction with control shRNA (shCTR) or targeting PCSK9 (shPCSK9) of Huh6 or Huh7 or HepG2 cells. Different MOIs (multiplicity of infection) were tested: 1, 3, 5 and 10; the latter was picked for further experiments. A total of 40 µg of cell proteins was loaded per lane on an SDS-PAGE. After electrophoresis and transfer, the membrane was analyzed by Western blot using anti-PCSK9 antibodies and GAPDH antibodies for comparison of loading. The two bands observed for PCSK9 correspond to the pro-PCSK9 (74 kDa) and cleaved PCSK9 (60 kDa). (B) Confocal microscopy observation of HepG2 cells performed 48 and 72 h after transfection with PCSK9 siRNA (si1) and siCTR. Mitochondria were labeled with C/YFP using a specific lentivirus targeting system (MitoC/YFP). Phalloidin (red) and DAPI (blue) were used for microfilament and nuclear DNA staining, respectively. Arrows indicate bright mitochondria network observed more frequently when PCSK9 is silenced. (C,D) Transmission electron microscopy (TEM) photomicrographs of liver cancer cell lines transduced with specific PCSK9 shRNA (shPCSK9) or control shRNA (shCTR). Dark and dense particles seen at lower and higher magnification are lipid droplets. Stars (*) indicate PDM. Abbreviations: LD: lipid droplet; PDM: peridroplet mitochondrion. Supplementary Materials: original-images of western blot figures.
Figure 5 PCSK9 deficiency leads to intracellular accumulation of lipid droplets. (A) Validation of depletion of PCSK9 by shRNA silencing. Cell extracts were prepared after transduction with control shRNA (shCTR) or targeting PCSK9 (shPCSK9) of Huh6 or Huh7 or HepG2 cells. Different MOIs (multiplicity of infection) were tested: 1, 3, 5 and 10; the latter was picked for further experiments. A total of 40 µg of cell proteins was loaded per lane on an SDS-PAGE. After electrophoresis and transfer, the membrane was analyzed by Western blot using anti-PCSK9 antibodies and GAPDH antibodies for comparison of loading. The two bands observed for PCSK9 correspond to the pro-PCSK9 (74 kDa) and cleaved PCSK9 (60 kDa). (B) Confocal microscopy observation of HepG2 cells performed 48 and 72 h after transfection with PCSK9 siRNA (si1) and siCTR. Mitochondria were labeled with C/YFP using a specific lentivirus targeting system (MitoC/YFP). Phalloidin (red) and DAPI (blue) were used for microfilament and nuclear DNA staining, respectively. Arrows indicate bright mitochondria network observed more frequently when PCSK9 is silenced. (C,D) Transmission electron microscopy (TEM) photomicrographs of liver cancer cell lines transduced with specific PCSK9 shRNA (shPCSK9) or control shRNA (shCTR). Dark and dense particles seen at lower and higher magnification are lipid droplets. Stars (*) indicate PDM. Abbreviations: LD: lipid droplet; PDM: peridroplet mitochondrion. Supplementary Materials: original-images of western blot figures.CC BY · PubMed Central
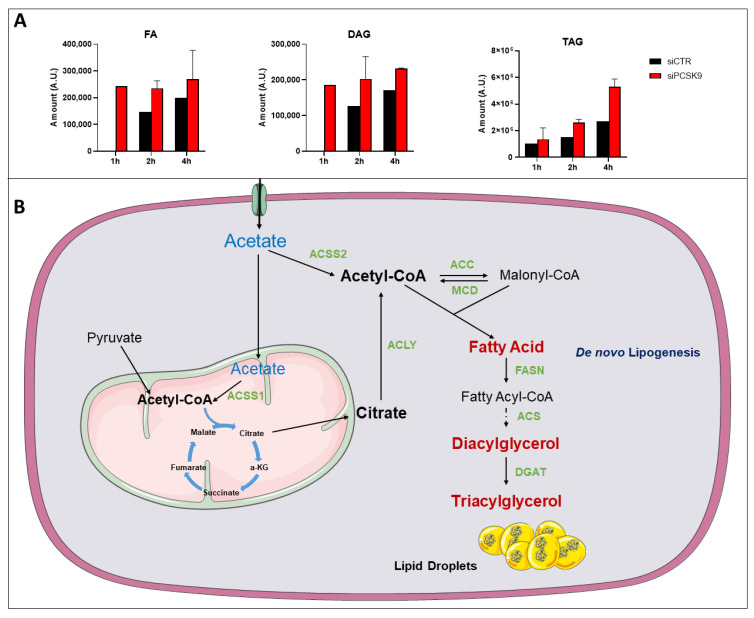
Figure 6 14C-tracing of different neutral lipids after cell feeding with [1-14C] acetate. (A) Cells were transfected with siRNA (si1 and si2) for 72 h then fed with [1-14C] acetate. Lipid extraction was performed 1, 2 and 4 h after [1-14C] acetate feeding and radiolabeled FA, DAG and TAG amounts were measured at each time point. Average values were obtained from both PCSK9 siRNA. Assays in each cell condition were performed in triplicate. (B) Pathway of acetate and its metabolic use to buildup lipids such as FAs up to TAG and lipid droplets. Enzymes catalyzing these reactions are presented in green. Abbreviation: ACSS1/2: Acyl-CoA synthetase short chain family member 1/2; ACC: Acetyl-CoA carboxylase; ACLY: ATP citrate lyase; MCD: Malonyl-CoA decarboxylase; FASN: fatty-acid synthase; ACS: Acetyl-CoA synthetase; DGAT: diacylglycerol acyltransferase; α-KG: α-ketoglutarate.
Figure 6 14C-tracing of different neutral lipids after cell feeding with [1-14C] acetate. (A) Cells were transfected with siRNA (si1 and si2) for 72 h then fed with [1-14C] acetate. Lipid extraction was performed 1, 2 and 4 h after [1-14C] acetate feeding and radiolabeled FA, DAG and TAG amounts were measured at each time point. Average values were obtained from both PCSK9 siRNA. Assays in each cell condition were performed in triplicate. (B) Pathway of acetate and its metabolic use to buildup lipids such as FAs up to TAG and lipid droplets. Enzymes catalyzing these reactions are presented in green. Abbreviation: ACSS1/2: Acyl-CoA synthetase short chain family member 1/2; ACC: Acetyl-CoA carboxylase; ACLY: ATP citrate lyase; MCD: Malonyl-CoA decarboxylase; FASN: fatty-acid synthase; ACS: Acetyl-CoA synthetase; DGAT: diacylglycerol acyltransferase; α-KG: α-ketoglutarate.CC BY · PubMed Central
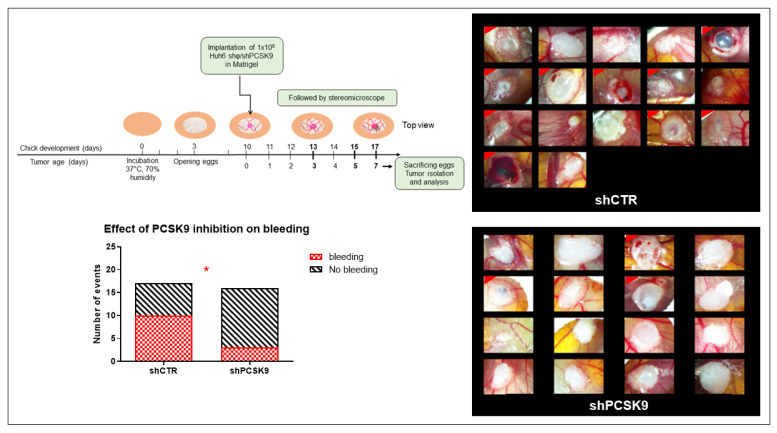
Figure 7 Depleting PCSK9 impairs liver tumor development in vivo. CAM model: Huh6 cells were grafted on the chicken CAM. Tumor growth was monitored on fixed tissues at day 7 after taking the photographs of tumors. The number of CAMs with tumor presenting (labeled with red corner) or not bleeding in CTR versus shPCSK9 is shown in histograms. Two-sided Fisher’s exact test, *: p < 0.05.
Figure 7 Depleting PCSK9 impairs liver tumor development in vivo. CAM model: Huh6 cells were grafted on the chicken CAM. Tumor growth was monitored on fixed tissues at day 7 after taking the photographs of tumors. The number of CAMs with tumor presenting (labeled with red corner) or not bleeding in CTR versus shPCSK9 is shown in histograms. Two-sided Fisher’s exact test, *: p < 0.05.CC BY · PubMed Central

Verification

Claims the paper makes

The claims and statistics of this paper haven’t been checked yet.

Run the check — free, no account needed. It reads the open-access text and checks the sources it cites.

A few free checks a day · papers already verified open instantly · results are public

Claims other papers make about this one

Each is checked against this paper’s own text: does it say what the citing paper says it does?

Self-check

Percentages, sums and reported differences re-computed from the paper’s own numbers.

The self-check needs the paper’s full text.

Citations

Cites

No references could be resolved yet.

Research works printed but not linked: 27

  1. Llovet, 2016, Hepatocellular Carcinoma, Nat. Rev. Dis. Primer, 2, 16018, 10.1038/nrdp.2016.18 · DOI · Paper page
  2. Sergi, C.M. (2021). Hepatoblastoma. Liver Cancer, Exon Publications. · DOI
  3. Mashima, 2009, De Novo Fatty-Acid Synthesis and Related Pathways as Molecular Targets for Cancer Therapy, Br. J. Cancer, 100, 1369, 10.1038/sj.bjc.6605007 · DOI
  4. Petersen, 2016, A Small-Molecule Anti-Secretagogue of PCSK9 Targets the 80S Ribosome to Inhibit PCSK9 Protein Translation, Cell Chem. Biol., 23, 1362, 10.1016/j.chembiol.2016.08.016 · DOI
  5. Mahboobnia, 2021, PCSK9 and Cancer: Rethinking the Link, Biomed. Pharmacother., 140, 111758, 10.1016/j.biopha.2021.111758 · DOI
  6. Bhat, M., Skill, N., Marcus, V., Deschenes, M., Tan, X., Bouteaud, J., Negi, S., Awan, Z., Aikin, R., and Kwan, J. (2015). Decreased PCSK9 Expression in Human Hepatocellular Carcinoma. BMC Gastroenterol., 15. · DOI
  7. Zhang, 2021, PCSK9 Promotes Tumor Growth by Inhibiting Tumor Cell Apoptosis in Hepatocellular Carcinoma, Exp. Hematol. Oncol., 10, 25, 10.1186/s40164-021-00218-1 · DOI
  8. Malinowski, 2017, PCSK9 Signaling Pathways and Their Potential Importance in Clinical Practice, EPMA J., 8, 391, 10.1007/s13167-017-0106-6 · DOI
  9. Schulz, 2015, Molecular and Cellular Function of the Proprotein Convertase Subtilisin/Kexin Type 9 (PCSK9), Basic Res. Cardiol., 110, 4, 10.1007/s00395-015-0463-z · DOI · Paper page
  10. Horton, 2002, SREBPs: Activators of the Complete Program of Cholesterol and Fatty Acid Synthesis in the Liver, J. Clin. Investig., 109, 1125, 10.1172/JCI0215593 · DOI · Paper page
  11. Sumazin, 2017, Genomic Analysis of Hepatoblastoma Identifies Distinct Molecular and Prognostic Subgroups, Hepatol. Baltim. Md, 65, 104, 10.1002/hep.28888 · DOI
  12. Wang, 2013, Forfeited Hepatogenesis Program and Increased Embryonic Stem Cell Traits in Young Hepatocellular Carcinoma (HCC) Comparing to Elderly HCC, BMC Genom., 14, 736, 10.1186/1471-2164-14-736 · DOI
  13. Hooks, 2018, New Insights into Diagnosis and Therapeutic Options for Proliferative Hepatoblastoma, Hepatology, 68, 89, 10.1002/hep.29672 · DOI
  14. Nakabayashi, 1982, Growth of Human Hepatoma Cell Lines with Differentiated Functions in Chemically Defined Medium, Cancer Res., 42, 3858
  15. Tokiwa, 1975, Preparation of Single Cell Suspensions from Hepatoma Cells in Culture, Acta Med. Okayama, 29, 147
  16. Cheung, 2009, Hep G2 Is a Hepatoblastoma-Derived Cell Line, Hum. Pathol., 40, 1512, 10.1016/j.humpath.2009.07.003 · DOI
  17. Imamura, 2009, Visualization of ATP Levels inside Single Living Cells with Fluorescence Resonance Energy Transfer-Based Genetically Encoded Indicators, Proc. Natl. Acad. Sci. USA, 106, 15651, 10.1073/pnas.0904764106 · DOI
  18. Hagedorn, 2005, Accessing Key Steps of Human Tumor Progression in Vivo by Using an Avian Embryo Model, Proc. Natl. Acad. Sci. USA, 102, 1643, 10.1073/pnas.0408622102 · DOI
  19. Indersie, 2018, Tracking Cellular and Molecular Changes in a Species-Specific Manner during Experimental Tumor Progression in Vivo, Oncotarget, 9, 16149, 10.18632/oncotarget.24598 · DOI
  20. Indersie, 2017, MicroRNA Therapy Inhibits Hepatoblastoma Growth in Vivo by Targeting β-Catenin and Wnt Signaling, Hepatol. Commun., 1, 168, 10.1002/hep4.1029 · DOI
  21. Benador, 2019, Mitochondria Bound to Lipid Droplets: Where Mitochondrial Dynamics Regulate Lipid Storage and Utilization, Cell Metab., 29, 827, 10.1016/j.cmet.2019.02.011 · DOI · Paper page
  22. Cartier, 2017, New Tumor Suppressor MicroRNAs Target Glypican-3 in Human Liver Cancer, Oncotarget, 8, 41211, 10.18632/oncotarget.17162 · DOI
  23. Merched, 2020, Hepatocellular Carcinoma and Statins, Biochemistry, 59, 3393, 10.1021/acs.biochem.0c00476 · DOI
  24. Alannan, 2020, Targeting Lipid Metabolism in Liver Cancer, Biochemistry, 59, 3951, 10.1021/acs.biochem.0c00477 · DOI
  25. Sun, 2017, Decreased Expression of Acetyl-CoA Synthase 2 Promotes Metastasis and Predicts Poor Prognosis in Hepatocellular Carcinoma, Cancer Sci., 108, 1338, 10.1111/cas.13252 · DOI
  26. Snaebjornsson, 2020, Greasing the Wheels of the Cancer Machine: The Role of Lipid Metabolism in Cancer, Cell Metab., 31, 62, 10.1016/j.cmet.2019.11.010 · DOI · Paper page
  27. Geng, 2021, How Does Hepatic Lipid Accumulation Lead to Lipotoxicity in Non-Alcoholic Fatty Liver Disease?, Hepatol. Int., 15, 21, 10.1007/s12072-020-10121-2 · DOI

Cited by

Sorted by citations

Metadata

Authors
Alannan, M., Trézéguet, V., Amoêdo, N. D., Rossignol, R., Mahfouf, W., Rezvani, H. R., Dittrich-Domergue, F., Moreau, P., Lacomme, S., Gontier, E., Grosset, C. F., Badran, B., Fayyad-Kazan, H., & Merched, A. J.
Affiliations
  • Bordeaux Institute of Oncology (BRIC), INSERM U1312, University of Bordeaux, F-33000 Bordeaux, France
  • CELLOMET, Functional Genomics Center (CGFB), INSERM U1211, University of Bordeaux, F-33000 Bordeaux, France
  • Laboratoire de Biogenèse Membranaire, Centre National de la Recherche Scientifique (CNRS), UMR 5200, University of Bordeaux, F-33140 Villenave d’Ornon, France
  • CNRS, INSERM, Bordeaux Imaging Center (BIC), University of Bordeaux, UAR 3420, US 4, F-33000 Bordeaux, France
  • Laboratory of Cancer Biology and Molecular Immunology, Faculty of Sciences I, Lebanese University, Hadath, Beirut, Lebanon
Venue
Cancers
Publisher
MDPI AG
Published
2022-12-20
Volume
15
Issue
1
Pages
3
ISSN
2072-6694
Cited by
25
References
0
Language
en
Funders
  • Cassandra contre les Leucémies et Cancers Pédiatriques (OPE-2018-0144, RE-2021-1AD-F, DBI20131228566, N°2020-012)
  • les Récoltes de l’Espoir (OPE-2018-0144, RE-2021-1AD-F, DBI20131228566, N°2020-012)
  • Fondation pour la Recherche Médicale (OPE-2018-0144, RE-2021-1AD-F, DBI20131228566, N°2020-012)
  • PELICAN.resist project and the Région Nouvelle-Aquitaine (OPE-2018-0144, RE-2021-1AD-F, DBI20131228566, N°2020-012)

About these checks

Registry, retraction, Cites and statistics results are computed, not judged, with one exception: a printed reference that no index lists is read once by a model before it counts as a citation error. Claims are extracted by a model and kept only when their quote appears verbatim in the text; each cited source is then checked, with a model’s help, for whether it says what the claim relies on. Those verdicts can be wrong — read the claim’s quote and the cited source before relying on one.

Statistics and arithmetic are recomputed, not judged.

Confidence bands are shown only for fields calibrated on our annotated test set. None is calibrated yet, so no band is shown.

What counts as a claim ›How we measure confidence ›How we check this ›

Are you an author, or do you see a problem with this page? Request a review