

The DOI matches its Crossref record; 58 of the 59 references it cites were found in a registry or an index; none of the 35 sources its claims cite is checked for support yet.
Investigating the Safety and Efficacy of Therapeutic Hypothermia in Pediatric Severe Traumatic Brain Injury: A Systematic Review and Meta-Analysis
Open accessAbstract
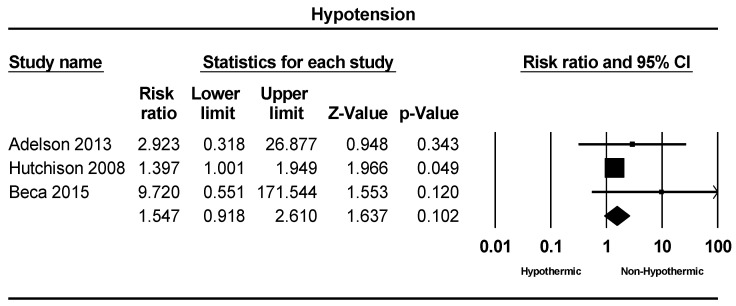
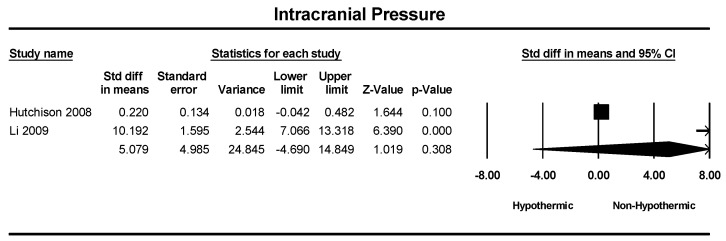
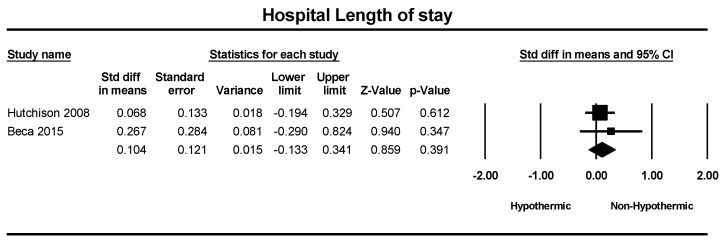
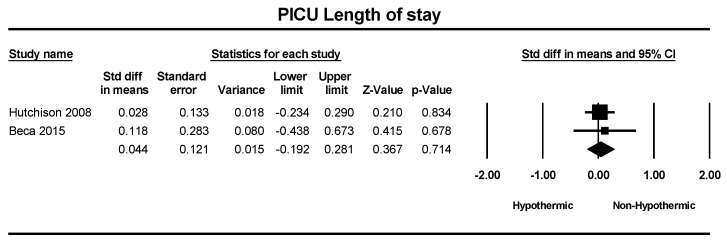
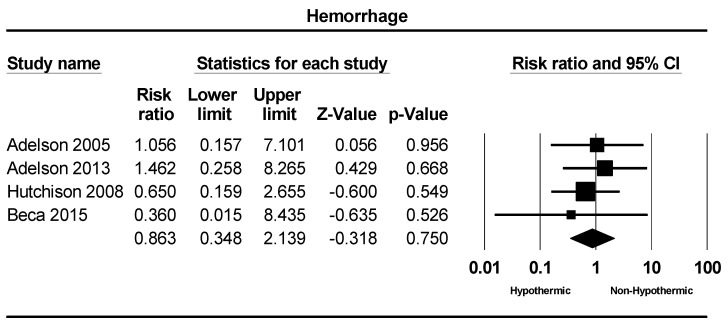
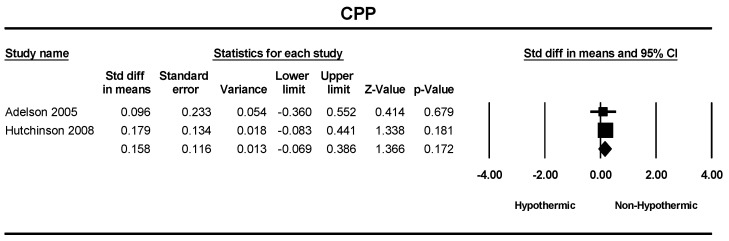
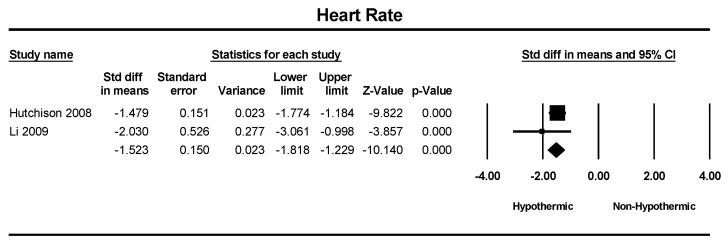
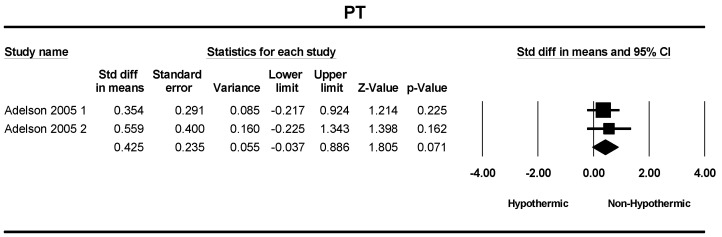
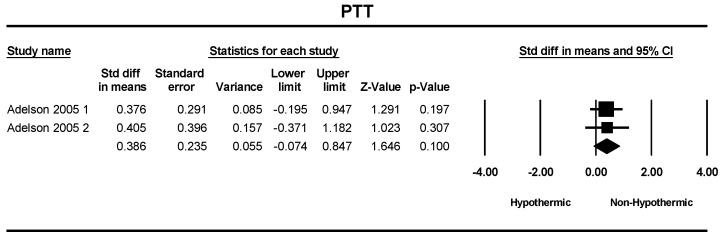
Background: Prior guidelines recommended maintaining normothermia following traumatic brain injury (TBI), but recent studies suggest therapeutic hypothermia as a viable option in pediatric cases. However, some others demonstrated a higher mortality rate. Hence, the impact of hypothermia on neurological symptoms and overall survival remains contentious. Methods: We conducted a systematic review and meta-analysis to evaluate the effects of hypothermia on neurological outcomes in pediatric TBI patients. The PubMed/Medline, Scopus, and Web of Science databases were searched until 1 January 2024 and data were analyzed using appropriate statistical methods. Results: A total of eight studies, comprising nine reports, were included in this analysis. Our meta-analysis did not reveal significant differences in mortality (RR = 1.58; 95% CI = 0.89–2.82, p = 0.055), infection (RR = 0.95: 95% CI = 0.79–1.1, p = 0.6), arrhythmia (RR = 2.85: 95% CI = 0.88–9.2, p = 0.08), hypotension (RR = 1.54: 95% CI = 0.91–2.6, p = 0.10), intracranial pressure (SMD = 5.07: 95% CI = −4.6–14.8, p = 0.30), hospital length of stay (SMD = 0.10; 95% CI = −0.13–0.3, p = 0.39), pediatric intensive care unit length of stay (SMD = 0.04; 95% CI = −0.19–0.28, p = 0.71), hemorrhage (RR = 0.86; 95% CI = 0.34–2.13, p = 0.75), cerebral perfusion pressure (SMD = 0.158: 95% CI = 0.11–0.13, p = 0.172), prothrombin time (SMD = 0.425; 95% CI = −0.037–0.886, p = 0.07), and partial thromboplastin time (SMD = 0.386; 95% CI = −0.074–0.847, p = 0.10) between the hypothermic and non-hypothermic groups. However, the heart rate was significantly lower in the hypothermic group (−1.523 SMD = −1.523: 95% CI = −1.81–−1.22 p < 0.001). Conclusions: Our findings challenge the effectiveness of therapeutic hypothermia in pediatric TBI cases. Despite expectations, it did not significantly improve key clinical outcomes. This prompts a critical re-evaluation of hypothermia’s role as a standard intervention in pediatric TBI treatment.
Overview
CoChat Summary
TL;DR
This systematic review and meta-analysis of 8 studies (516 pediatric severe TBI patients) found therapeutic hypothermia did not significantly improve mortality, infection, arrhythmia, hypotension, ICP, length of stay, hemorrhage, CPP, PT, or PTT versus non-hypothermia. Only heart rate was significantly lower in the hypothermic group, and the authors conclude that hypothermia’s role in pediatric severe TBI should be re-evaluated cautiously.
Key findings
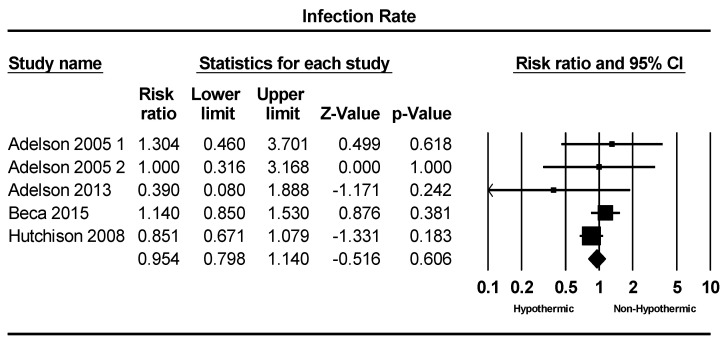
- No statistically significant differences were found for mortality (RR = 1.58; 95% CI = 0.89–2.82, p = 0.055), infection (RR = 0.95; 95% CI = 0.79–1.1, p = 0.6), arrhythmia (RR = 2.85; 95% CI = 0.88–9.2, p = 0.08), hypotension (RR = 1.54; 95% CI = 0.91–2.6, p = 0.10), or hemorrhage (RR = 0.86; 95% CI = 0.34–2.13, p = 0.75).
- No statistically significant differences were found for ICP (SMD = 5.07; 95% CI = −4.6–14.8, p = 0.30), hospital length of stay (SMD = 0.10; 95% CI = −0.13–0.3, p = 0.39), PICU length of stay (SMD = 0.04; 95% CI = −0.19–0.28, p = 0.71), CPP (SMD = 0.158; 95% CI = 0.11–0.13, p = 0.172), PT (SMD = 0.425; 95% CI = −0.037–0.886, p = 0.07), or PTT (SMD = 0.386; 95% CI = −0.074–0.847, p = 0.10).
- Heart rate was significantly lower in the hypothermic group (SMD = −1.523; 95% CI = −1.81 to −1.22, p < 0.001).
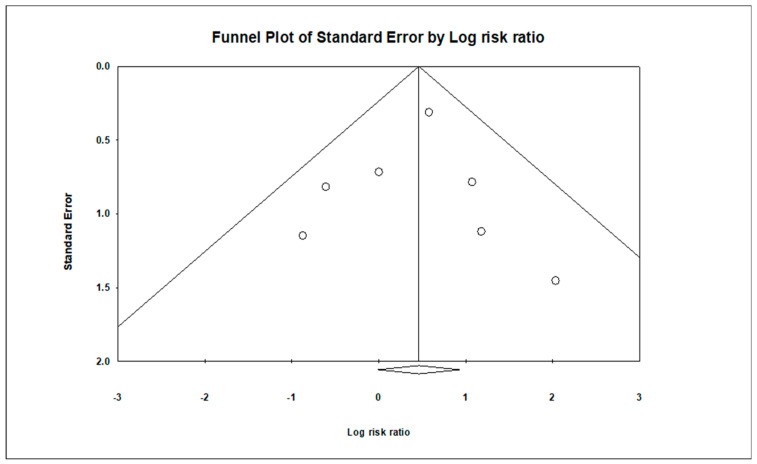
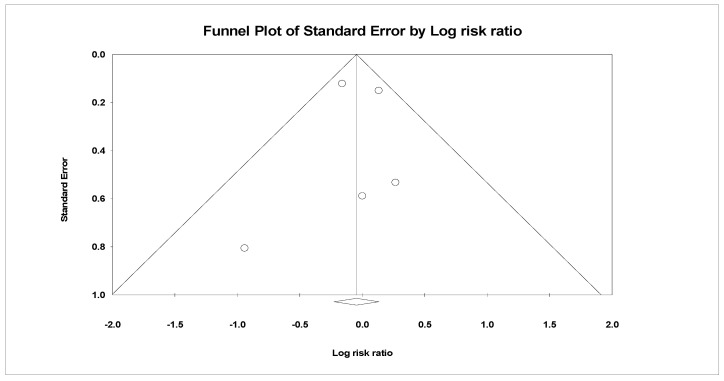
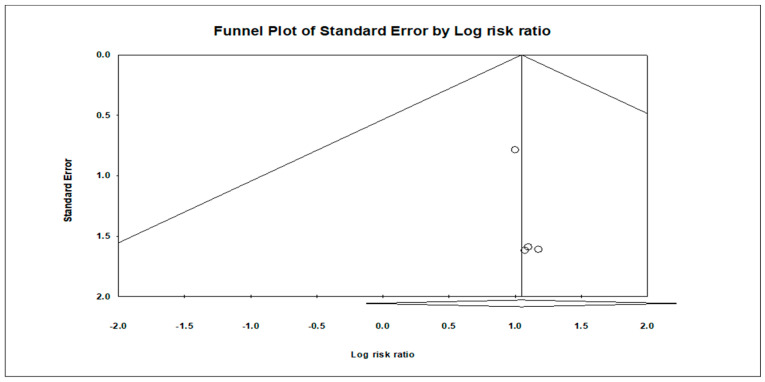
- Sensitivity analyses indicated mortality outcomes were not robust (p > 0.05 in five of seven analyses); infection, arrhythmia, hypotension, hospital/PICU length of stay, CPP, hemorrhage, PT, and PTT were also not robust, while ICP and heart rate were robust. Publication bias was insignificant for mortality, infection, arrhythmia, and hemorrhage.
Methods
- PRISMA-guided systematic review and meta-analysis; PubMed/Medline, Scopus, and Web of Science were searched until 1 January 2024, with inclusion of English randomized controlled trials, prospective and retrospective cohort studies, case–control studies, and cross-sectional studies examining hypothermia in pediatric TBI; animal studies, reviews, protocols, and letters were excluded.
- Eight studies involving 516 participants met inclusion criteria; all focused on severe TBI with Glasgow Coma Scale below eight; most were conducted in the United States (n = 4), five were multicenter, three were single-center, and all were prospectively conducted; rectal temperature was the primary assessment site in most studies (n = 5), followed by esophageal temperature (n = 3).
- Analyses used Comprehensive Meta-Analysis Software version 4; risk ratios were calculated for mortality, infection, arrhythmia, hypotension, and hemorrhage, and standard mean differences for ICP, hospital length of stay, PICU length of stay, CPP, heart rate, PT, and PTT; a random-effects model was used due to high heterogeneity, with leave-one-out sensitivity analysis and funnel plot/Egger’s test for publication bias.
Limitations
- Stated by the authors: included studies varied in methodological rigor and patient populations; hypothermia protocols differed in target temperature, duration of cooling, and rewarming strategies; patient characteristics differed in age, comorbidities, and pre-existing conditions; some studies had incomplete outcome reporting; sample sizes were relatively small; and the optimal duration and depth of hypothermia remain unclear.
- Evident from the text: several outcomes were pooled from only two to four studies, and sensitivity analyses showed most outcomes were not robust, with only ICP and heart rate deemed robust.
- Evident from the text: the authors note that further well-designed randomized controlled trials are needed and that clinicians should approach therapeutic hypothermia in pediatric severe TBI with caution.
Model-written summary. Check it against the paper before relying on it.
Integrity signals
Registry
Cites
Statistics
Figures
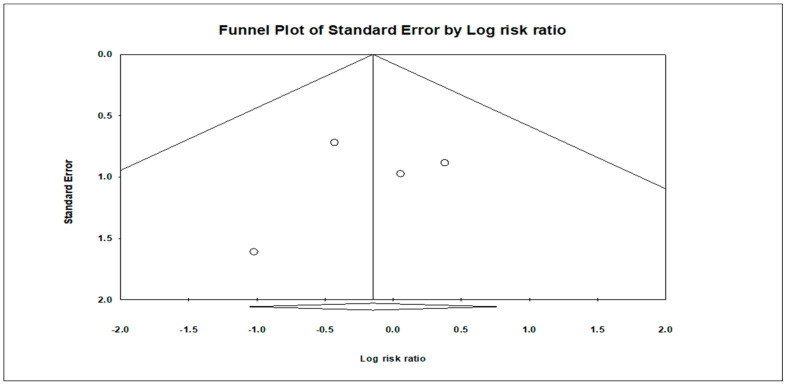
Verification
Claims the paper makes
0 Valid · 0 Not valid · 24 Not checked · 41 Own results and interpretations
A result the paper reports from its own data — it cites no other source for it, so there is none to check. The quote shows it is in the paper.
In the paper
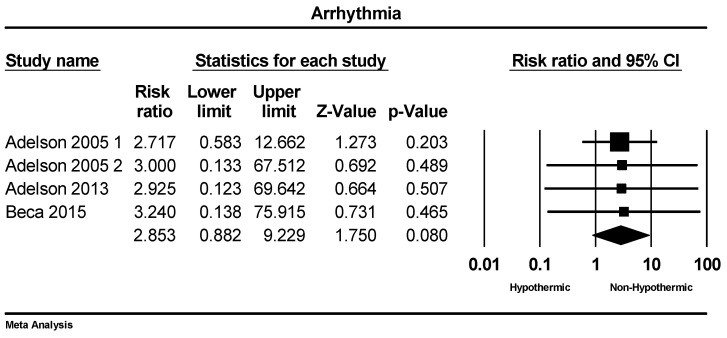
“arrhythmia (RR = 2.85: 95% CI = 0.88–9.2, p = 0.08)”
- Also stated in: § 3.3. Meta-Analysis of Data · hedged
“The meta-analysis indicated a trend toward a higher incidence of arrhythmias in the hypothermic group; however, this difference did not reach statistical significance (RR = 2.85: 95% CI = 0.88–9.2, p = 0.08)”
§ Investigating the Safety and Efficacy of Therapeutic Hypothermia in Pediatric Severe Traumatic Brain Injury: A Systematic Review and Meta-Analysis > Abstract
plain- Asserted: passes — The authors put it forward as true.
- Checkable: passes — It can be checked against evidence.
- Load-bearing: passes — The paper’s conclusions depend on it.
- Based: passes — The paper gives a reason why it holds.
- Also stated in: § 3.3. Meta-Analysis of Data · hedged
A result the paper reports from its own data — it cites no other source for it, so there is none to check. The quote shows it is in the paper.
In the paper
“hypotension (RR = 1.54: 95% CI = 0.91–2.6, p = 0.10)”
- Also stated in: § 3.3. Meta-Analysis of Data · hedged
“The meta-analysis indicated a slightly higher incidence of hypotension in the hypothermic group compared to the non-hypothermic group; however, this difference did not reach statistical significance (RR = 1.54: 95% CI = 0.91–2.6, p = 0.10)”
§ Investigating the Safety and Efficacy of Therapeutic Hypothermia in Pediatric Severe Traumatic Brain Injury: A Systematic Review and Meta-Analysis > Abstract
plain- Asserted: passes — The authors put it forward as true.
- Checkable: passes — It can be checked against evidence.
- Load-bearing: passes — The paper’s conclusions depend on it.
- Based: passes — The paper gives a reason why it holds.
- Also stated in: § 3.3. Meta-Analysis of Data · hedged
A result the paper reports from its own data — it cites no other source for it, so there is none to check. The quote shows it is in the paper.
In the paper
“partial thromboplastin time (SMD = 0.386; 95% CI = −0.074–0.847, p = 0.10)”
- Also stated in: § 3.3. Meta-Analysis of Data · plain
“The standard differences in means of PT and PTT between the hypothermic and non-hypothermic groups were 0.425 (SMD = 0.425; 95% CI = −0.037–0.886, p = 0.07) and 0.386 (SMD = 0.386; 95% CI = −0.074–0.847, p = 0.10), respectively. The difference between groups was not statistically different”
§ Investigating the Safety and Efficacy of Therapeutic Hypothermia in Pediatric Severe Traumatic Brain Injury: A Systematic Review and Meta-Analysis > Abstract
plain- Asserted: passes — The authors put it forward as true.
- Checkable: passes — It can be checked against evidence.
- Load-bearing: unclear — It is unclear whether the paper’s conclusions depend on it.
- Based: passes — The paper gives a reason why it holds.
- Also stated in: § 3.3. Meta-Analysis of Data · plain
A result the paper reports from its own data — it cites no other source for it, so there is none to check. The quote shows it is in the paper.
In the paper
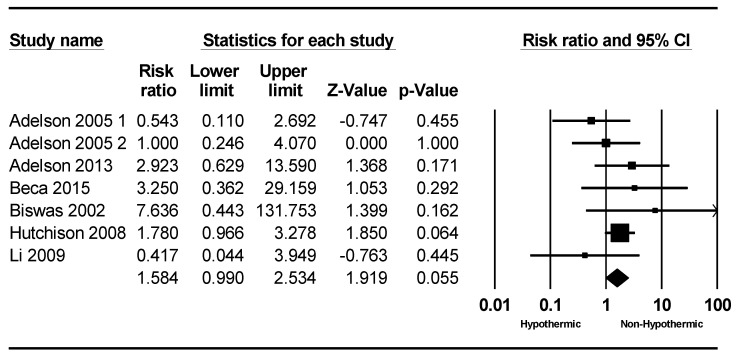
“Our meta-analysis did not reveal significant differences in mortality (RR = 1.58; 95% CI = 0.89–2.82, p = 0.055)”
- Also stated in: § 3.3. Meta-Analysis of Data · hedged
“The meta-analysis indicated a slightly lower mortality rate in the non-hypothermic group compared to the hypothermic group, although this difference was not statistically significant (RR = 1.58; 95% CI = 0.89–2.82, p = 0.055)”
§ Investigating the Safety and Efficacy of Therapeutic Hypothermia in Pediatric Severe Traumatic Brain Injury: A Systematic Review and Meta-Analysis > Abstract
plain- Asserted: passes — The authors put it forward as true.
- Checkable: passes — It can be checked against evidence.
- Load-bearing: passes — The paper’s conclusions depend on it.
- Based: passes — The paper gives a reason why it holds.
- Also stated in: § 3.3. Meta-Analysis of Data · hedged
A result the paper reports from its own data — it cites no other source for it, so there is none to check. The quote shows it is in the paper.
In the paper
“pediatric intensive care unit length of stay (SMD = 0.04; 95% CI = −0.19–0.28, p = 0.71)”
- Also stated in: § 3.3. Meta-Analysis of Data · plain
“Similarly, the standard difference in means for PICU length of stay was 0.04 days, and no statistically significant difference was observed (SMD = 0.04; 95% CI = −0.19–0.28, p = 0.71)”
§ Investigating the Safety and Efficacy of Therapeutic Hypothermia in Pediatric Severe Traumatic Brain Injury: A Systematic Review and Meta-Analysis > Abstract
plain- Asserted: passes — The authors put it forward as true.
- Checkable: passes — It can be checked against evidence.
- Load-bearing: unclear — It is unclear whether the paper’s conclusions depend on it.
- Based: passes — The paper gives a reason why it holds.
- Also stated in: § 3.3. Meta-Analysis of Data · plain
23 more claims
Create a free account to see all 65 claims and to verify the 32 references still open.
- It may state two separate claims as one. 25
- Probably not a substantial claim. 21
Self-check
Percentages, sums and reported differences re-computed from the paper’s own numbers.
Each contradiction between two passages listed here was confirmed by an independent check.
Rated major: it would touch a result — a value a result rests on, reported and recomputed p-values on opposite sides of the significance level, two passages that conflict with no sign which is right, or a cited work retracted before this paper was published.
In the paper
§ Investigating the Safety and Efficacy of Therapeutic Hypothermia in Pediatric Severe Traumatic Brain Injury: A Systematic Review and Meta-Analysis > 3. Results > 3.1. Study Selection
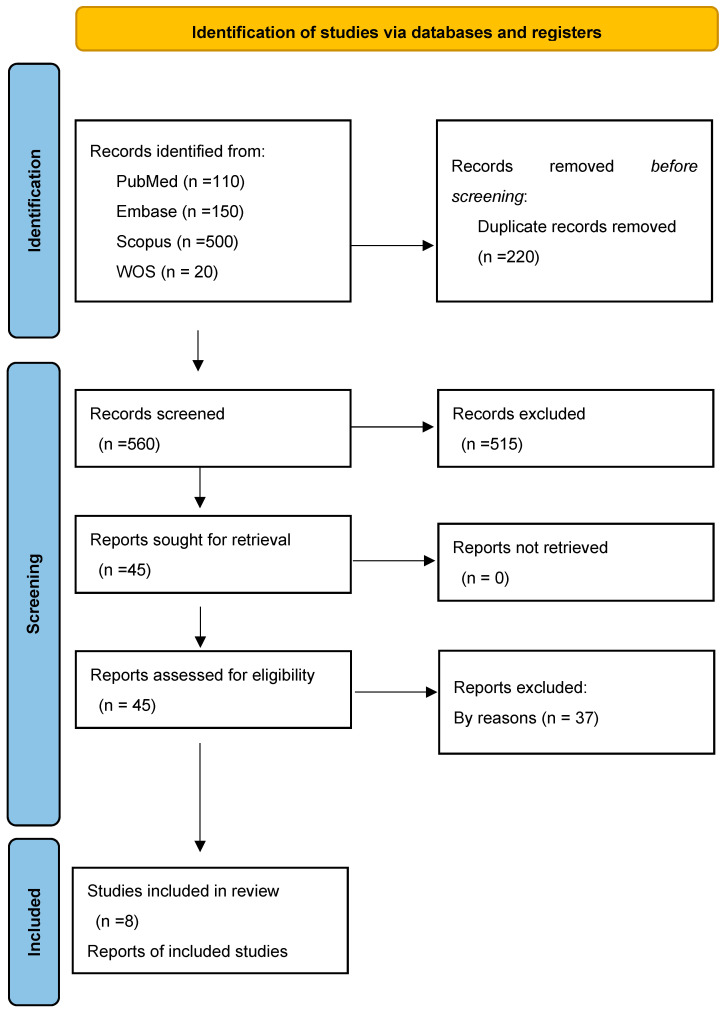
“A total of 780 records were retrieved from PubMed, Embase, Scopus, and Web of Science.”
§ Investigating the Safety and Efficacy of Therapeutic Hypothermia in Pediatric Severe Traumatic Brain Injury: A Systematic Review and Meta-Analysis > 2. Methods > 2.1. Databases and Search Strategy
“The electronic databases PubMed/Medline, Scopus, and Web of Science were comprehensively searched until 1 January 2024”
Rated major: it would touch a result — a value a result rests on, reported and recomputed p-values on opposite sides of the significance level, two passages that conflict with no sign which is right, or a cited work retracted before this paper was published.
In the paper
§ Investigating the Safety and Efficacy of Therapeutic Hypothermia in Pediatric Severe Traumatic Brain Injury: A Systematic Review and Meta-Analysis > Abstract
“95% CI = 0.11–0.13”
§ Investigating the Safety and Efficacy of Therapeutic Hypothermia in Pediatric Severe Traumatic Brain Injury: A Systematic Review and Meta-Analysis > 3. Results > 3.3. Meta-Analysis of Data
“however, the difference was insignificant (SMD = 0.158: 95% CI = 0.11–0.13, p = 0.172)”
Rated major: it would touch a result — a value a result rests on, reported and recomputed p-values on opposite sides of the significance level, two passages that conflict with no sign which is right, or a cited work retracted before this paper was published.
In the paper
§ Investigating the Safety and Efficacy of Therapeutic Hypothermia in Pediatric Severe Traumatic Brain Injury: A Systematic Review and Meta-Analysis > Abstract
“SMD = 0.158”
§ Investigating the Safety and Efficacy of Therapeutic Hypothermia in Pediatric Severe Traumatic Brain Injury: A Systematic Review and Meta-Analysis > Abstract
“95% CI = 0.11–0.13”
Rated minor: it would not touch a result — a value no result rests on, a p-value that stays on the same side of the significance level, or a conflict that is clerical, resolved elsewhere in the paper, or outside its own findings.
In the paper
§ Investigating the Safety and Efficacy of Therapeutic Hypothermia in Pediatric Severe Traumatic Brain Injury: A Systematic Review and Meta-Analysis > 3. Results > 3.3. Meta-Analysis of Data
“the standard difference in means for PICU length of stay was 0.04 days”
§ Investigating the Safety and Efficacy of Therapeutic Hypothermia in Pediatric Severe Traumatic Brain Injury: A Systematic Review and Meta-Analysis > 4. Discussion
“0.4 days for PICU stay”
Citations
Cites
The PRISMA 2020 statement: An updated guideline for reporting systematic reviews
Page, M. J., McKenzie, J. E., Bossuyt, P. M., Boutron, I., Hoffmann, T. C., Mulrow, C. D., Shamseer, L., Tetzlaff, J. M., Akl, E. A., Brennan, S. E., et al. (2021) · BMJ · doi:10.1136/bmj.n71 · Cited by 108,283
Guidelines for the Management of Severe Traumatic Brain Injury, Fourth Edition
Carney, N., Totten, A. M., O'Reilly, C., Ullman, J. S., Hawryluk, G. W. J., Bell, M. J., Bratton, S. L., Chesnut, R., Harris, O. A., Kissoon, N., et al. (2017) · Neurosurgery · doi:10.1227/neu.0000000000001432 · Cited by 4,357
Taylor, C. A., Bell, J. M., Breiding, M. J., & Xu, L. (2017) · MMWR. Surveillance Summaries · doi:10.15585/mmwr.ss6609a1 · Cited by 2,328
Incidence of Traumatic Brain Injury in the United States, 2003
Rutland-Brown, W., Langlois, J. A., Thomas, K. E., & Xi, Y. L. (2006) · Journal of Head Trauma Rehabilitation · doi:10.1097/00001199-200611000-00009 · Cited by 837
Hypothermia Therapy after Traumatic Brain Injury in Children
Hutchison, J. S., Ward, R. E., Lacroix, J., Hébert, P. C., Barnes, M. A., Bohn, D. J., Dirks, P. B., Doucette, S., Fergusson, D., Gottesman, R., et al. (2008) · New England Journal of Medicine · doi:10.1056/nejmoa0706930 · Cited by 692
Globus, M. Y. ‐., Alonso, O., Dietrich, W. D., Busto, R., & Ginsberg, M. D. (1995) · Journal of Neurochemistry · doi:10.1046/j.1471-4159.1995.65041704.x · Cited by 608
Traumatic Brain Injury: Current Treatment Strategies and Future Endeavors
Galgano, M., Toshkezi, G., Qiu, X., Russell, T., Chin, L., & Zhao, L.-R. (2017) · Cell Transplantation · doi:10.1177/0963689717714102 · Cited by 582
Cerebral Blood Flow and Cerebral Oxygen Consumption During Hypothermia
Rosomoff, H. L., & Holaday, D. A. (1954) · American Journal of Physiology-Legacy Content · doi:10.1152/ajplegacy.1954.179.1.85 · Cited by 556
Effects of Hypothermia on Energy Metabolism in Mammalian Central Nervous System
Erecinska, M., Thoresen, M., & Silver, I. A. (2003) · Journal of Cerebral Blood Flow & Metabolism · doi:10.1097/01.wcb.0000066287.21705.21 · Cited by 442
Pediatric Traumatic Brain Injury: Characteristic Features, Diagnosis, and Management
ARAKI, T., YOKOTA, H., & MORITA, A. (2017) · Neurologia medico-chirurgica · doi:10.2176/nmc.ra.2016-0191 · Cited by 396
Phase II Clinical Trial of Moderate Hypothermia after Severe Traumatic Brain Injury in Children
Adelson, P. D., Ragheb, J., Muizelaar, J. P., Kanev, P., Brockmeyer, D., Beers, S. R., Brown, S. D., Cassidy, L. D., Chang, Y., & Levin, H. (2005) · Neurosurgery · doi:10.1227/01.neu.0000156471.50726.26 · Cited by 328
Adelson, P. D., Wisniewski, S. R., Beca, J., Brown, S. D., Bell, M. J., Muizelaar, J. P., Okada, P. J., Beers, S. R., Balasubramani, G. K., & Hirtz, D. (2013) · The Lancet Neurology · doi:10.1016/s1474-4422(13)70077-2 · Cited by 247
Shafi, S., Elliott, A. C., & Gentilello, L. M. (2005) · The Journal of Trauma: Injury, Infection, and Critical Care · doi:10.1097/01.ta.0000188647.03665.fd · Cited by 213
INJURY-ASSOCIATED HYPOTHERMIA: AN ANALYSIS OF THE 2004 NATIONAL TRAUMA DATA BANK
Martin, R. S., Kilgo, P. D., Miller, P. R., Hoth, J. J., Meredith, J. W., & Chang, M. (2005) · Shock · doi:10.1097/01.shk.0000169726.25189.b1 · Cited by 206
PROTECTION IN ANIMAL MODELS OF BRAIN AND SPINAL CORD INJURY WITH MILD TO MODERATE HYPOTHERMIA
Dietrich, W. D., Atkins, C. M., & Bramlett, H. M. (2009) · Journal of Neurotrauma · doi:10.1089/neu.2008.0806 · Cited by 163
Hyperthermia following traumatic brain injury: a critical evaluation
Thompson, H. J., Tkacs, N. C., Saatman, K. E., Raghupathi, R., & McIntosh, T. K. (2003) · Neurobiology of Disease · doi:10.1016/s0969-9961(02)00030-x · Cited by 162
Sadigh‐Eteghad, S., Majdi, A., McCann, S., Mahmoudi, J., Vafaee, M. S., & Macleod, M. R. (2017) · PLoS ONE · doi:10.1371/journal.pone.0184122 · Cited by 158
Self-citationKochanek, P. M., Tasker, R. C., Carney, N., Totten, A. M., Adelson, P. D., Selden, N. R., Davis-O’Reilly, C., Hart, E. L., Bell, M. J., Bratton, S. L., et al. (2019) · Neurosurgery · doi:10.1093/neuros/nyz051 · Cited by 158
Kinoshita, K., Chatzipanteli, K., Vitarbo, E. A., Truettner, J. S., Alonso, O. F., & Dietrich, W. D. (2002) · Neurosurgery · doi:10.1097/00006123-200207000-00027 · Cited by 153
Biswas, A. K., Bruce, D. A., Sklar, F. H., Bokovoy, J. L., & Sommerauer, J. F. (2002) · Critical Care Medicine · doi:10.1097/00003246-200212000-00020 · Cited by 135
Prognostic Value of Spreading Depolarizations in Patients With Severe Traumatic Brain Injury
Hartings, J. A., Andaluz, N. O., Bullock, M. R., Hinzman, J. M., Mathern, B. E., Pahl, C., Puccio, A. M., Shutter, L., Strong, A. J., Vagal, A. S., et al. (2019) · JAMA Neurology · doi:10.1001/jamaneurol.2019.4476 · Cited by 130
Vitarbo, E. A., Chatzipanteli, K., Kinoshita, K., Truettner, J. S., Alonso, O. F., & Dietrich, W. D. (2004) · Neurosurgery · doi:10.1227/01.neu.0000130036.52521.2c · Cited by 114
Takagi, K., Ginsberg, M. D., Globus, M. Y. T., Martinez, E., & Busto, R. (1994) · American Journal of Physiology-Heart and Circulatory Physiology · doi:10.1152/ajpheart.1994.267.5.h1770 · Cited by 105
Management of traumatic brain injury: A narrative review of current evidence
Wiles, M. D. (2022) · Anaesthesia · doi:10.1111/anae.15608 · Cited by 101
Bayr, H., Adelson, P. D., Wisniewski, S. R., Shore, P., Lai, Y., Brown, D., Janesko-Feldman, K. L., Kagan, V. E., & Kochanek, P. M. (2009) · Critical Care Medicine · doi:10.1097/ccm.0b013e318194abf2 · Cited by 98
Oxygen Utilization and Cardiovascular Function in Head-injured Patients
Robertson, C. S., Clifton, G. L., & Grossman, R. G. (1984) · Neurosurgery · doi:10.1227/00006123-198409000-00003 · Cited by 96
Meta-Analysis of Therapeutic Hypothermia for Traumatic Brain Injury in Adult and Pediatric Patients
Crompton, E. M., Lubomirova, I., Cotlarciuc, I., Han, T. S., Sharma, S. D., & Sharma, P. (2017) · Critical Care Medicine · doi:10.1097/ccm.0000000000002205 · Cited by 89
Hypothermia for Traumatic Brain Injury in Children—A Phase II Randomized Controlled Trial*
Beca, J., McSharry, B., Erickson, S. J., Yung, M., Schibler, A., Slater, A., Wilkins, B. H., Singhal, A., Williams, G. D., Sherring, C. L., et al. (2015) · Critical Care Medicine · doi:10.1097/ccm.0000000000000947 · Cited by 80
Lotocki, G., Vaccari, J. P. D. R., Perez, E. R., Alonso, O. F., Curbelo, K., Keane, R. W., & Dietrich, W. D. (2006) · European Journal of Neuroscience · doi:10.1111/j.1460-9568.2006.05123.x · Cited by 69
Hypothermia blunts acetylcholine increase in CSF of traumatically brain injured rats
Lyeth, B. G., Jiang, J. Y., Robinson, S. E., Guo, H., & Jenkins, L. W. (1993) · Molecular and Chemical Neuropathology · doi:10.1007/bf03160117 · Cited by 64
Pharmacologically induced hypothermia attenuates traumatic brain injury in neonatal rats
Gu, X., Wei, Z. Z., Espinera, A., Lee, J. H., Ji, X., Wei, L., Dix, T. A., & Yu, S. P. (2015) · Experimental Neurology · doi:10.1016/j.expneurol.2015.02.029 · Cited by 62
Therapeutic effects of pharmacologically induced hypothermia against traumatic brain injury in mice
Lee, J. H., Wei, L., Gu, X., Wei, Z., Dix, T. A., & Yu, S. P. (2014) · Journal of Neurotrauma · doi:10.1089/neu.2013.3251 · Cited by 61
Chen, H., Wu, F., Yang, P., Shao, J., Chen, Q., & Zheng, R. (2019) · Critical Care · doi:10.1186/s13054-019-2667-3 · Cited by 58
Disseminated Intravascular Coagulation During Rewarming Following Hypothermia
Mahajan, S. L., Myers, T. C., & Baldini, M. G. (1981) · JAMA · doi:10.1001/jama.1981.03310490035022 · Cited by 57
Kox, M., Pompe, J. C., Pickkers, P., Hoedemaekers, C. W., van Vugt, A. B., & van der Hoeven, J. G. (2008) · Neurology · doi:10.1212/01.wnl.0000279479.69502.3e · Cited by 51
Therapeutic Hypothermia in Children and Adults with Severe Traumatic Brain Injury
Sandestig, A., Romner, B., & Grände, P.-O. (2014) · Therapeutic Hypothermia and Temperature Management · doi:10.1089/ther.2013.0024 · Cited by 47
Ishikawa, K., Tanaka, H., Shiozaki, T., Takaoka, M., Ogura, H., Kishi, M., Shimazu, T., & Sugimoto, A. H. (2000) · The Journal of Trauma: Injury, Infection, and Critical Care · doi:10.1097/00005373-200011000-00020 · Cited by 44
PROTECTIVE EFFECT OF MODERATE HYPOTHERMIA ON SEVERE TRAUMATIC BRAIN INJURY IN CHILDREN
Li, H., Lü, G., Shi, W., & Zheng, S. (2009) · Journal of Neurotrauma · doi:10.1089/neu.2008.0828 · Cited by 43
Cardiac arrhythmias associated with severe traumatic brain injury and hypothermia therapy*
Bourdages, M., Bigras, J., FARRELL, C. A., Hutchison, J. S., & Lacroix, J. (2009) · Pediatric Critical Care Medicine · doi:10.1097/pcc.0b013e3181c51dea · Cited by 42
Energy expenditure in children after severe traumatic brain injury
Mtaweh, H., Smith, R., Kochanek, P. M., Wisniewski, S. R., Fabio, A., Vavilala, M. S., Adelson, P. D., Toney, N. A., & Bell, M. J. (2014) · Pediatric Critical Care Medicine · doi:10.1097/pcc.0000000000000041 · Cited by 42
Birg, T., Ortolano, F., Wiegers, E., Smielewski, P., Savchenko, Y., Ianosi, B., Helbok, R., Rossi, S., Carbonara, M., Zoerle, T., et al. (2021) · Neurocritical Care · doi:10.1007/s12028-021-01294-1 · Cited by 42
Sadigh‐Eteghad, S., Majdi, A., McCann, S., Mahmoudi, J., Vafaee, M. S., & Macleod, M. R. (2017) · PLoS ONE · doi:10.1371/journal.pone.0190328 · Cited by 41
Self-citationHypothermia Pediatric Head Injury Trial: The Value of a Pretrial Clinical Evaluation Phase
Hutchison, J. S., Ward, R., Lacroix, J., Hébert, P. C., Skippen, P. W., Barnes, M., Meyer, P. G., Morris, K., Kirpalani, H. M., Singh, R., et al. (2006) · Developmental Neuroscience · doi:10.1159/000094155 · Cited by 38
Effect of Mild Hypothermia on Brain Dialysate Lactate after Fluid Percussion Brain Injury in Rodents
Jiang, J., Liang, Y.-M., Qi-zhong, L., & Zhu, C. (2004) · Neurosurgery · doi:10.1227/01.neu.0000109535.58429.49 · Cited by 38
Management and Treatment of Traumatic Brain Injuries
Jha, S., & Ghewade, P. (2022) · Cureus · doi:10.7759/cureus.30617 · Cited by 37
Zhang, B.-F., Wang, J., Liu, Z.-W., Zhao, Y.-L., Li, D.-D., Huang, T.-Q., Gu, H., & Song, J.-N. (2015) · World Neurosurgery · doi:10.1016/j.wneu.2014.12.010 · Cited by 35
The effects of hypothermia on the physiology of the nervous system.
Rosomoff, H. L. (1956) · PubMed · Cited by 32
Hypothermia therapy after traumatic brain injury in children.
Kornecki, A., & Morrison, G. G. (2008) · PubMed · Cited by 24
Tokutomi, T., Morimoto, K., Miyagi, T., Yamaguchi, S., Ishikawa, K., & Shigemori, M. (2007) · Neurosurgery · doi:10.1227/01.neu.0000279221.38257.1a · Cited by 23
Fujita, M., Wei, E. P., & Povlishock, J. T. (2012) · Journal of Neurotrauma · doi:10.1089/neu.2011.2278 · Cited by 22
Habibi, M. A., Kobets, A. J., Boskabadi, A. R., Nasab, M., Sobhanian, P., Hamishegi, F. S., & Alavi, S. A. N. (2024) · Neurosurgical Review · doi:10.1007/s10143-024-02292-5 · Cited by 19
Self-citationAcute Mild Traumatic Brain Injury Assessment and Management in the Austere Setting—A Review
Ownbey, M., & Pekari, T. B. (2021) · Military Medicine · doi:10.1093/milmed/usab104 · Cited by 15
THE EFFECTS OF HYPOTHERMIA ON THE PHYSIOLOGY OF THE NERVOUS SYSTEM
Rosomoff, H. L. (1957) · Survey of Anesthesiology · doi:10.1097/00132586-195702000-00004 · Cited by 12
Induced Mild Hypothermia in Children after Brain Injury
Grinkeviciūte, D. E., & Kėvalas, R. (2009) · Reviews in the Neurosciences · doi:10.1515/revneuro.2009.20.3-4.261 · Cited by 11
Rezakhah, A., Kobets, A. J., Sigaroudi, F. E., Mahdkhah, A., Barshan, J., Gharajedaghi, A., & Alavi, S. A. N. (2023) · World Neurosurgery · doi:10.1016/j.wneu.2023.04.121 · Cited by 11
Self-citationDu, Q., Liu, Y., Chen, X., & Li, K. (2022) · Brain Sciences · doi:10.3390/brainsci12081009 · Cited by 8
Geng, M., Cui, W., Cheng, J., Li, L., Cheng, R., & Wang, X. (2022) · Translational Pediatrics · doi:10.21037/tp-22-180 · Cited by 5
(1996) · PubMed
Cited by
Therapeutic hypothermia in patients with traumatic brain injury: an umbrella review
Ashayeri, H., Balafar, M., Ebrahimi, A., Soleimanpour, H., Kashgsaray, N. H., Shahsavarinia, K., & Salehi‐Pourmehr, H. (2025) · BMC Neurology · doi:10.1186/s12883-025-04463-3 · Cited by 6
Zhang, P., Zhang, W., Weng, J., & Shen, Z. (2025) · BMC Neurology · doi:10.1186/s12883-025-04502-z · Cited by 3
Research status and hotspots of hypothermia and human diseases: a bibliometric analysis
Li, W., Han, N.-N., Ji, Q.-Y., Dong, X.-T., Lu, C., & Wang, S.-J. (2025) · Frontiers in Medicine · doi:10.3389/fmed.2025.1518173 · Cited by 1
Racciatti, M. M., Velonjara, J., Mock, C., Guadagnoli, N., Lujan, S., Petroni, G. J., Bell, M. J., Vavilala, M. S., & for the PEGASUS Argentina Study Group (2026) · Neurotrauma Reports · doi:10.1177/2689288x261456782
Suliman, O., Mohammed, E., Alrehili, A., Danawar, R. A., Alamri, W., Alwusaidi, J., Alahmadi, A., Aloufi, S., & Ibrahim, A. (2026) · International Journal of Community Medicine and Public Health · doi:10.18203/2394-6040.ijcmph20262296
Metadata
- Authors
- Naseri Alavi, S. A., Habibi, M. A., Majdi, A., Hajikarimloo, B., Rashidi, F., Fathi Tavani, S., Minaee, P., Eazi, S. M., & Kobets, A. J.
- Affiliations
- Department of Neurosurgery, School of Medicine, Emory University, Atlanta, GA 30033, USA
- Shariati Hospital (IR)
- KU Leuven (BE)
- Shahid Beheshti University (IR)
- Tehran University of Medical Sciences (IR)
- School of Medicine, Tehran University of Medical Sciences, Tehran 14399, Iran
- Qom University of Medical Science and Health Services (IR)
- Albert Einstein College of Medicine (US)
- ORCID
- Venue
- Children
- Publisher
- MDPI AG
- Published
- 2024-06-07
- Volume
- 11
- Issue
- 6
- Pages
- 701
- ISSN
- 2227-9067 (ISSN-L)
- PMC
- PMC11201645
- OpenAlex
- W4399431005
- Semantic Scholar
- 5559c54e078761c02cd1ff08590927547d3eac16
- Cited by
- 5
- References
- 59
- Citations by year
- 2026: 2 · 2025: 3
- FWCI
- 0.32
- Type
- journal article
- Language
- en
- Open access
- gold
- doi.org
- Licence
- Locations
- Children (publishedVersion, cc-by)
- PubMed Central (publishedVersion, cc-by)
- PubMed (publishedVersion)
- Lirias (KU Leuven) (submittedVersion, cc-by)
- DOAJ (DOAJ: Directory of Open Access Journals) (submittedVersion)
- Topics
- Health Sciences › Medicine › Clinical Neurology › Traumatic Brain Injury and Neurovascular Disturbances
- Health Sciences › Medicine › Critical Care and Intensive Care Medicine › Thermal Regulation in Medicine
- Health Sciences › Medicine › Clinical Neurology › Traumatic Brain Injury Research
- Keywords
- therapeutic hypothermia, pediatric traumatic brain injury, normothermia, mortality, neurological outcome, intracranial pressure, cerebral perfusion pressure, cardiac arrhythmias, hypotension, hemorrhage, infection, length of hospital stay, prothrombin time, treatment efficacy and safety, pediatric intensive care unit, hemorrhagic transformation, cerebral edema
About these checks
Registry, retraction, Cites and statistics results are computed, not judged, with one exception: a printed reference that no index lists is read once by a model before it counts as a citation error. Claims are extracted by a model and kept only when their quote appears verbatim in the text; each cited source is then checked, with a model’s help, for whether it says what the claim relies on. Those verdicts can be wrong — read the claim’s quote and the cited source before relying on one.
A language model drew the claims from the paper on 2026-11-14, under version 3 of the claim definition (model deepseek-v4.1-flash, prompt extract-v3).
A second model labelled each claim on 2026-11-14 (model jev-1.13-20260917, definition revision gold-guideline-v0.2).
Statistics and arithmetic are recomputed, not judged.
Confidence bands are shown only for fields calibrated on our annotated test set. None is calibrated yet, so no band is shown.
What counts as a claim ›How we measure confidence ›How we check this ›
Are you an author, or do you see a problem with this page? Request a review
Data sources
Bibliographic data: Semantic Scholar, OpenAlex, Crossref.
Contains information from the Semantic Scholar Academic Graph Datasets, made available under the ODC Attribution License (ODC-BY 1.0).
Semantic Scholar’s data is described in: Kinney, R., et al. (2023). The Semantic Scholar Open Data Platform. arXiv:2301.10140.
