Cited by 30Curcumin's Biomedical ApplicationsAnalytical Methods in PharmaceuticalsSaffron Plant Research Studies

The DOI matches its Crossref record; 63 of the 65 references it cites were found in a registry or an index.

Validation of a Quantification Method for Curcumin Derivatives and Their Hepatoprotective Effects on Nonalcoholic Fatty Liver Disease

Open access
Lee, Young-Seob, Oh, Seon Min, Li, Qian-Qian, Kim, Kwan-Woo, Yoon, Dahye, Lee, Min-Ho, Kwon, Dong-Yeul, Kang, Ok-Hwa, Lee, Dae Young·2022·Current Issues in Molecular Biology

Abstract

Curcumin (CM), demethoxycurcumin (DMC), and bisdemethoxycurcumin (BDMC) are major curcumin derivatives found in the rhizome of turmeric (Curcuma longa L.), and have yielded impressive properties to halt various diseases. In the present study, we carried out a method validation for curcumin derivatives and analyzed the contents simultaneously using HPLC with UV detection. For validation, HPLC was used to estimate linearity, range, specificity, accuracy, precision, limit of detection (LOD), and limit of quantification (LOQ). Results showed a high linearity of the calibration curve, with a coefficient of correlation (R2) for CM, DMC, and BDMC of 0.9999, 0.9999, and 0.9997, respectively. The LOD values for CM, DMC, and BDMC were 1.16, 1.03, and 2.53 ng/μL and LOQ values were 3.50, 3.11, and 7.67 ng/μL, respectively. Moreover, to evaluate the ability of curcumin derivatives to reduce liver lipogenesis and compare curcumin derivatives’ therapeutic effects, a HepG2 cell model was established to analyze their hepatoprotective properties. Regarding the in vivo study, we investigated the effect of DMC, CM, and BDMC on nonalcoholic fatty liver disease (NAFLD) caused by a methionine choline deficient (MCD)-diet in the C57BL/6J mice model. From the in vitro and in vivo results, curcumin derivatives alleviated MCD-diet-induced lipid accumulation as well as high triglyceride (TG) and total cholesterol (TC) levels, and the protein and gene expression of the transcription factors related to liver adipogenesis were suppressed. Furthermore, in MCD-diet mice, curcumin derivatives suppressed the upregulation of toll-like receptors (TLRs) and the production of pro-inflammatory cytokines. In conclusion, our findings indicated that all of the three curcuminoids exerted a hepatoprotective effect in the HepG2 cell model and the MCD-diet-induced NAFLD model, suggesting a potential for curcuminoids derived from turmeric as novel therapeutic agents for NAFLD.

Overview

The claims and statistics of this paper haven’t been checked yet.

Run the check — free, no account needed. It reads the open-access text and checks the sources it cites.

A few free checks a day · papers already verified open instantly · results are public

Integrity signals

Registry

Crossref · 10.3390/cimb44010029

Cites

63 of 63 references verified0 citation errors · 0 not checkable

Statistics

Figures

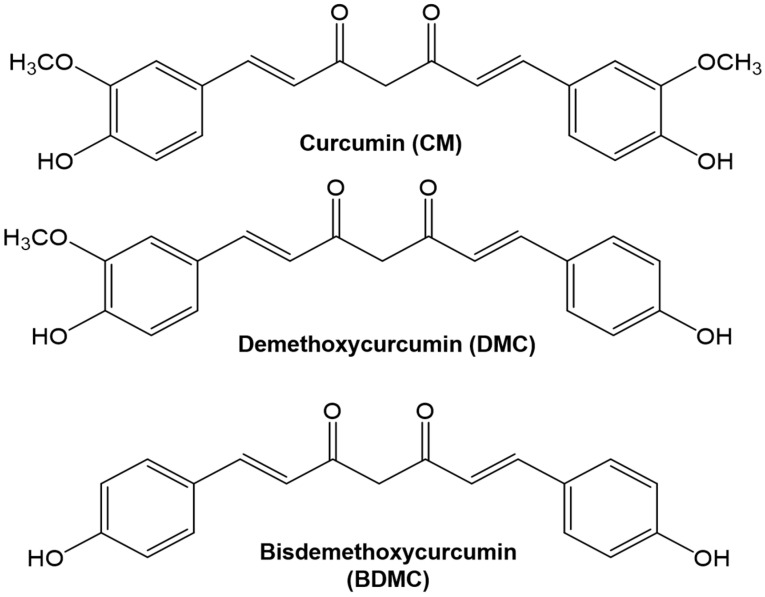
Figure 1 Chemical structure of curcumin, demethoxycurcumin, and bisdemethoxycurcumin.
Figure 1 Chemical structure of curcumin, demethoxycurcumin, and bisdemethoxycurcumin.CC BY · PubMed Central
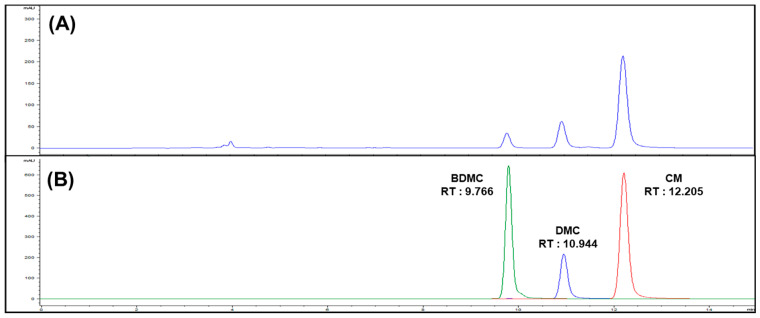
Figure 2 (A) HPLC chromatogram of turmeric extracts (Lot No. NIHHS-18-42458), (B) overlay chromatogram of curcuminoids.
Figure 2 (A) HPLC chromatogram of turmeric extracts (Lot No. NIHHS-18-42458), (B) overlay chromatogram of curcuminoids.CC BY · PubMed Central
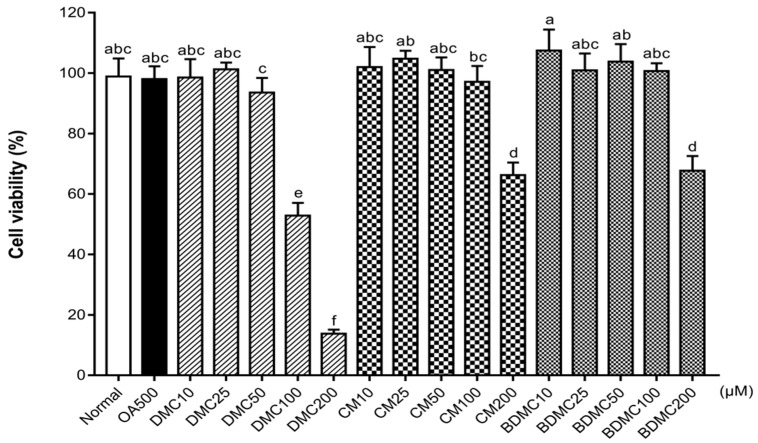
Figure 3 Effects of curcuminoids on cell viability in HepG2 cells. Cell viability was measured in HepG2 cells after treatment with oleic acid (OA) (500 μM), demethoxycurcumin (DMC), curcumin (CM), and bisdemethoxycurcumin (BDMC) (10, 25, 50, 100, and 200 μM) using a (3-(4,5-dimethylthiazol-2-yl)-5-(3-carboxymethoxyphenyl)-2-(4-sulfophenyl)-2H-tetrazolium) (MTS) assay. The data are means ± SD of triplicate determinations. Different letters indicate significant differences (a, c, d, e, f, ab, bc, abc) (p < 0.05) following Duncan’s multiple range test. OA: oleic acid; DMC: demethoxycurcumin; CM: curcumin; BDMC: demethoxycurcumin.
Figure 3 Effects of curcuminoids on cell viability in HepG2 cells. Cell viability was measured in HepG2 cells after treatment with oleic acid (OA) (500 μM), demethoxycurcumin (DMC), curcumin (CM), and bisdemethoxycurcumin (BDMC) (10, 25, 50, 100, and 200 μM) using a (3-(4,5-dimethylthiazol-2-yl)-5-(3-carboxymethoxyphenyl)-2-(4-sulfophenyl)-2H-tetrazolium) (MTS) assay. The data are means ± SD of triplicate determinations. Different letters indicate significant differences (a, c, d, e, f, ab, bc, abc) (p < 0.05) following Duncan’s multiple range test. OA: oleic acid; DMC: demethoxycurcumin; CM: curcumin; BDMC: demethoxycurcumin.CC BY · PubMed Central
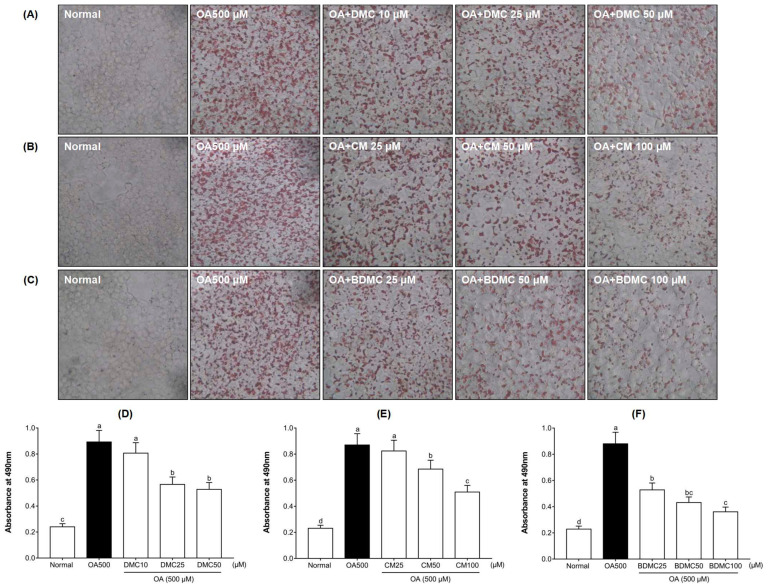
Figure 4 Effects of curcuminoids on intracellular lipid accumulation in HepG2 cells. Oil Red O staining of OA (500 μM)-induced HepG2 cells treated with (A) DMC (10, 25, and 50 μM), (B) CM (25, 50, and 100 μM), and (C) BDMC (25, 50, and 100 μM). (D–F) represent the corresponding quantitative analysis by measuring its absorbance at 490 nm. The cells were stained with Oil Red O and observed by microscope (×200). The data are means ± SD of triplicate determinations. Different letters indicate significant differences (a, b, c, d, bc) (p < 0.05) following Duncan’s multiple range test. OA: oleic acid; DMC: demethoxycurcumin; CM: curcumin; BDMC: demethoxycurcumin.
Figure 4 Effects of curcuminoids on intracellular lipid accumulation in HepG2 cells. Oil Red O staining of OA (500 μM)-induced HepG2 cells treated with (A) DMC (10, 25, and 50 μM), (B) CM (25, 50, and 100 μM), and (C) BDMC (25, 50, and 100 μM). (D–F) represent the corresponding quantitative analysis by measuring its absorbance at 490 nm. The cells were stained with Oil Red O and observed by microscope (×200). The data are means ± SD of triplicate determinations. Different letters indicate significant differences (a, b, c, d, bc) (p < 0.05) following Duncan’s multiple range test. OA: oleic acid; DMC: demethoxycurcumin; CM: curcumin; BDMC: demethoxycurcumin.CC BY · PubMed Central
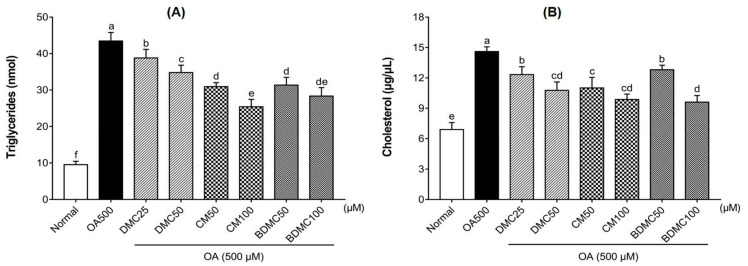
Figure 5 Effects of curcuminoids on triglyceride (TG) and total cholesterol (TC) levels in HepG2 cells. The enzymatic colorimetric method was used to analyze the total intracellular triglyceride (A) and total cholesterol (B) produced by OA (500 μM)-induced HepG2 cells treated with DMC (25 and 50 μM), CM (50 and 100 μM), and BDMC (50 and 100 μM). The data are means ± SD of triplicate determinations. Different letters indicate significant differences (a, b, c, d, e, f, cd, de) (p < 0.05) following Duncan’s multiple range test. OA: oleic acid; DMC: demethoxycurcumin; CM: curcumin; BDMC: demethoxycurcumin.
Figure 5 Effects of curcuminoids on triglyceride (TG) and total cholesterol (TC) levels in HepG2 cells. The enzymatic colorimetric method was used to analyze the total intracellular triglyceride (A) and total cholesterol (B) produced by OA (500 μM)-induced HepG2 cells treated with DMC (25 and 50 μM), CM (50 and 100 μM), and BDMC (50 and 100 μM). The data are means ± SD of triplicate determinations. Different letters indicate significant differences (a, b, c, d, e, f, cd, de) (p < 0.05) following Duncan’s multiple range test. OA: oleic acid; DMC: demethoxycurcumin; CM: curcumin; BDMC: demethoxycurcumin.CC BY · PubMed Central
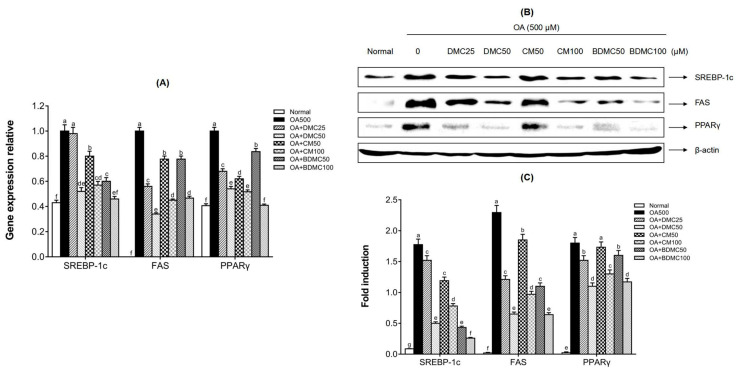
Figure 6 Effects of curcuminoids on hepatocyte lipid accumulation at both the protein and mRNA expression levels. (A) The gene expression of SREBP-1c, FAS, and PPARγ in HepG2 cells was detected by real time RT-PCR, in which glyceraldehyde-3-phosphate dehydrogenase (GAPDH) served as an internal control. (B) The protein expressions of SREBP-1c, FAS, and PPARγ in HepG2 cells were detected by Western blot analysis, in which β-actin served as an internal control. (C) The quantification of the immunoblot by densitometry. The data are means ± SD of triplicate determinations. Different letters in the same group indicate significant differences (a, b, c, d, e, f, g, cd, de, ef) (p < 0.05) following Duncan’s multiple range test. OA: oleic acid; DMC: demethoxycurcumin; CM: curcumin; BDMC: demethoxycurcumin.
Figure 6 Effects of curcuminoids on hepatocyte lipid accumulation at both the protein and mRNA expression levels. (A) The gene expression of SREBP-1c, FAS, and PPARγ in HepG2 cells was detected by real time RT-PCR, in which glyceraldehyde-3-phosphate dehydrogenase (GAPDH) served as an internal control. (B) The protein expressions of SREBP-1c, FAS, and PPARγ in HepG2 cells were detected by Western blot analysis, in which β-actin served as an internal control. (C) The quantification of the immunoblot by densitometry. The data are means ± SD of triplicate determinations. Different letters in the same group indicate significant differences (a, b, c, d, e, f, g, cd, de, ef) (p < 0.05) following Duncan’s multiple range test. OA: oleic acid; DMC: demethoxycurcumin; CM: curcumin; BDMC: demethoxycurcumin.CC BY · PubMed Central
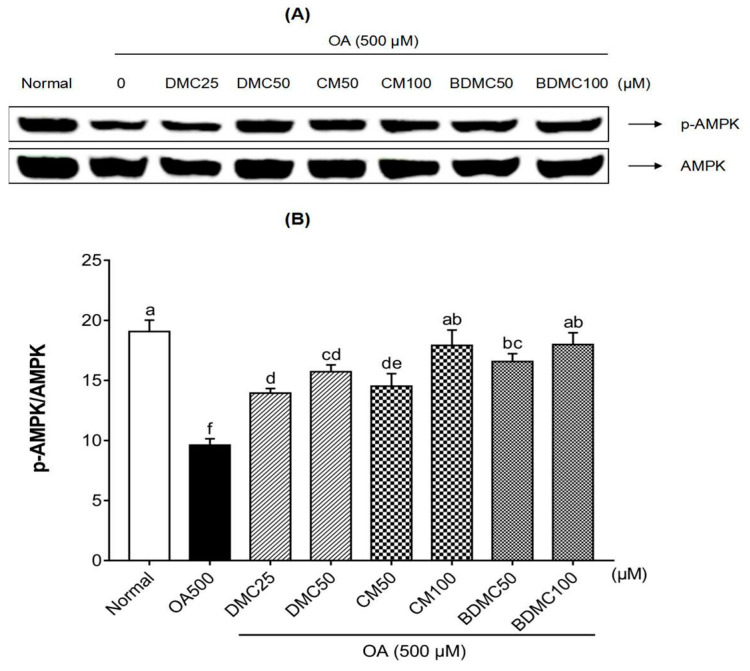
Figure 7 Effects of curcuminoids on adenosine monophosphate-activated protein kinase (AMPK) phosphorylation in HepG2 cells. (A) Phosphorylated AMPK in HepG2 cells was detected by Western blot analysis. Expression levels were normalized to that of the total AMPK protein. (B) The quantification of the immunoblot by densitometry. The data are means ± SD of triplicate determinations. Different letters indicate significant differences (a, d, f, ab, bc, cd, de) (p < 0.05) following Duncan’s multiple range test. OA: oleic acid; DMC: demethoxycurcumin; CM: curcumin; BDMC: demethoxycurcumin.
Figure 7 Effects of curcuminoids on adenosine monophosphate-activated protein kinase (AMPK) phosphorylation in HepG2 cells. (A) Phosphorylated AMPK in HepG2 cells was detected by Western blot analysis. Expression levels were normalized to that of the total AMPK protein. (B) The quantification of the immunoblot by densitometry. The data are means ± SD of triplicate determinations. Different letters indicate significant differences (a, d, f, ab, bc, cd, de) (p < 0.05) following Duncan’s multiple range test. OA: oleic acid; DMC: demethoxycurcumin; CM: curcumin; BDMC: demethoxycurcumin.CC BY · PubMed Central
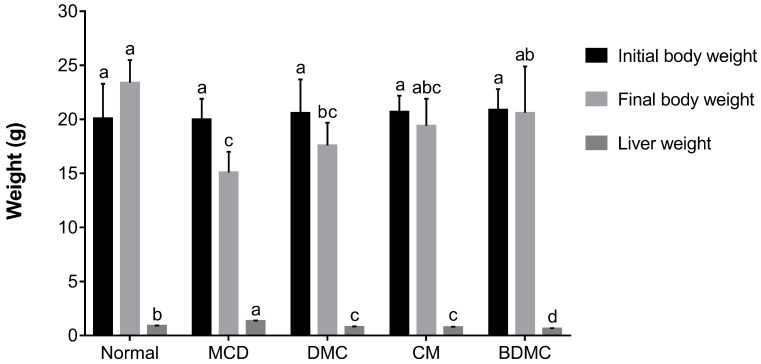
Figure 8 Effect of curcuminoids on methionine choline deficient (MCD)-diet body weight and liver weight. Data are expressed as mean ± SD of 7 animals. Different letters in the same line represent significant differences (a, b, c, d, ab, bc, abc) (p < 0.05) following Duncan’s multiple range test. DMC: demethoxycurcumin; CM: curcumin; BDMC: demethoxycurcumin.
Figure 8 Effect of curcuminoids on methionine choline deficient (MCD)-diet body weight and liver weight. Data are expressed as mean ± SD of 7 animals. Different letters in the same line represent significant differences (a, b, c, d, ab, bc, abc) (p < 0.05) following Duncan’s multiple range test. DMC: demethoxycurcumin; CM: curcumin; BDMC: demethoxycurcumin.CC BY · PubMed Central
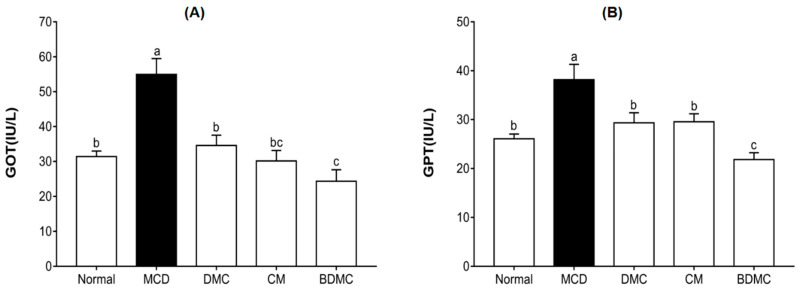
Figure 9 Effects of curcuminoids on glutamic oxaloacetic transaminase (GOT) and glutamic-pyruvic transaminase (GPT) levels in mice. Blood samples were collected from C57BL/6J mice fed a normal diet, the methionine choline deficient (MCD) diet, or the same MCD diet supplemented with curcuminoid treatment for four weeks, and plasma GOT (A) and GPT (B) levels were determined. The data are means ± SD of triplicate determinations. Different letters indicate significant differences (a, b, c, bc) (p < 0.05) following Duncan’s multiple range test. DMC: demethoxycurcumin; CM: curcumin; BDMC: demethoxycurcumin.
Figure 9 Effects of curcuminoids on glutamic oxaloacetic transaminase (GOT) and glutamic-pyruvic transaminase (GPT) levels in mice. Blood samples were collected from C57BL/6J mice fed a normal diet, the methionine choline deficient (MCD) diet, or the same MCD diet supplemented with curcuminoid treatment for four weeks, and plasma GOT (A) and GPT (B) levels were determined. The data are means ± SD of triplicate determinations. Different letters indicate significant differences (a, b, c, bc) (p < 0.05) following Duncan’s multiple range test. DMC: demethoxycurcumin; CM: curcumin; BDMC: demethoxycurcumin.CC BY · PubMed Central
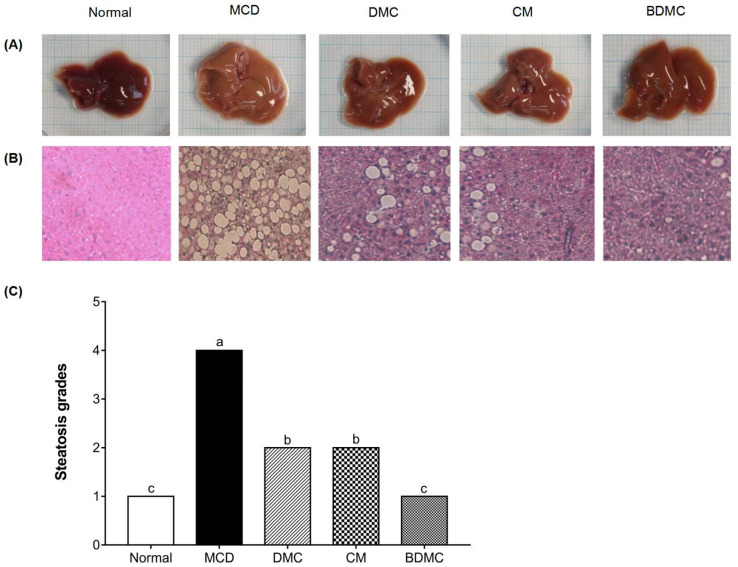
Figure 10 Histological analysis of liver steatosis and liver morphology. (A) Photographs of mouse livers. (B) Hematoxylin and eosin staining of liver sections obtained from C57BL/6J mice fed a normal diet, the methionine choline deficient (MCD) diet, or the same MCD diet supplemented with curcuminoid treatment for four weeks, original magnification, ×400. (C) The grades of steatosis, Grade 1 (<5%), Grade 2 (5–33%), Grade 3 (>33–66%), and Grade 4 (>66%). The data are means ± SD of triplicate determinations. Different letters indicate significant differences (a, b, c) (p < 0.05) following Duncan’s multiple range test. DMC: demethoxycurcumin; CM: curcumin; BDMC: demethoxycurcumin.
Figure 10 Histological analysis of liver steatosis and liver morphology. (A) Photographs of mouse livers. (B) Hematoxylin and eosin staining of liver sections obtained from C57BL/6J mice fed a normal diet, the methionine choline deficient (MCD) diet, or the same MCD diet supplemented with curcuminoid treatment for four weeks, original magnification, ×400. (C) The grades of steatosis, Grade 1 (<5%), Grade 2 (5–33%), Grade 3 (>33–66%), and Grade 4 (>66%). The data are means ± SD of triplicate determinations. Different letters indicate significant differences (a, b, c) (p < 0.05) following Duncan’s multiple range test. DMC: demethoxycurcumin; CM: curcumin; BDMC: demethoxycurcumin.CC BY · PubMed Central
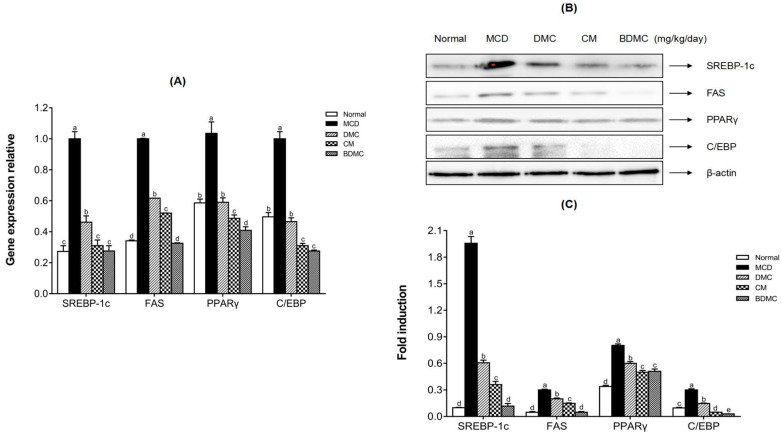
Figure 11 Effects of curcuminoids on the protein and mRNA expression levels of hepatic lipid accumulation markers. (A) The mRNA expression levels of SREBP-1c, FAS, PPARγ, and C/EBP in liver tissues were evaluated by real-time RT-PCR and normalized to GAPDH levels. (B) The proteins related to lipogenesis in liver tissues were detected by Western blot analysis. Expression levels were normalized to those of the β-actin protein. (C) The quantification of the immunoblot by densitometry. The data are means ± SD of triplicate determinations. Different letters in the same group indicate significant differences (a, b, c, d, e) (p < 0.05) following Duncan’s multiple range test. MCD: methionine choline deficient; DMC: demethoxycurcumin; CM: curcumin; BDMC: demethoxycurcumin.
Figure 11 Effects of curcuminoids on the protein and mRNA expression levels of hepatic lipid accumulation markers. (A) The mRNA expression levels of SREBP-1c, FAS, PPARγ, and C/EBP in liver tissues were evaluated by real-time RT-PCR and normalized to GAPDH levels. (B) The proteins related to lipogenesis in liver tissues were detected by Western blot analysis. Expression levels were normalized to those of the β-actin protein. (C) The quantification of the immunoblot by densitometry. The data are means ± SD of triplicate determinations. Different letters in the same group indicate significant differences (a, b, c, d, e) (p < 0.05) following Duncan’s multiple range test. MCD: methionine choline deficient; DMC: demethoxycurcumin; CM: curcumin; BDMC: demethoxycurcumin.CC BY · PubMed Central
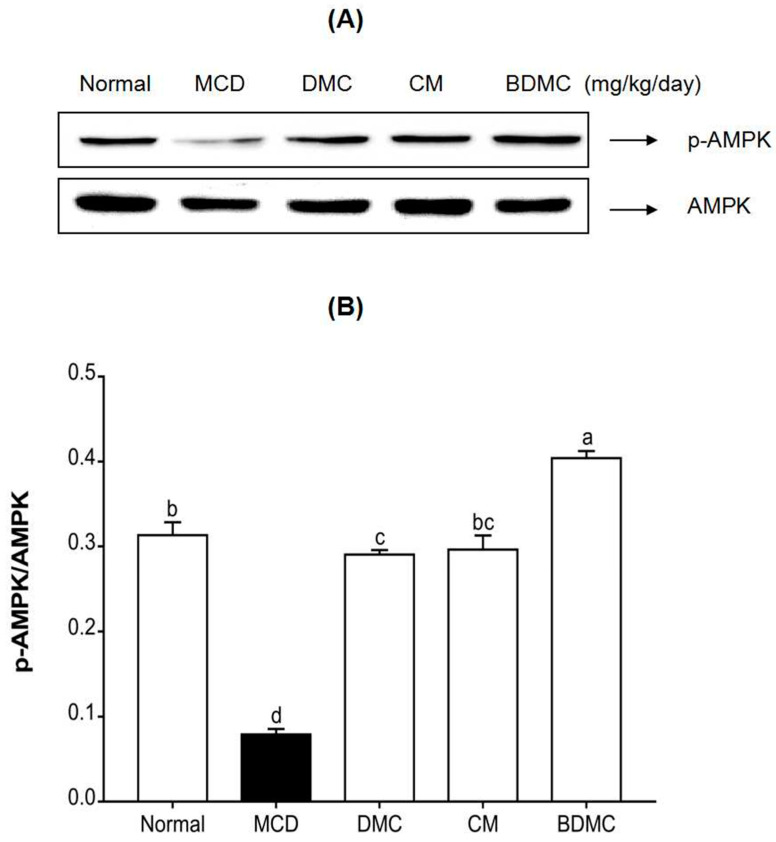
Figure 12 Effects of curcuminoids on 5’ AMP-activated protein kinase (AMPK) phosphorylation in mice. (A) AMPK phosphorylation in liver tissues was detected by Western blot analysis. Expression levels were normalized to that of the AMPK protein. (B) The quantification of the immunoblot by densitometry. The data are means ± SD of triplicate determinations. Different letters indicate significant differences (a, b, c, d, bc) (p < 0.05) following Duncan’s multiple range test. MCD: methionine choline deficient; DMC: demethoxycurcumin; CM: curcumin; BDMC: demethoxycurcumin.
Figure 12 Effects of curcuminoids on 5’ AMP-activated protein kinase (AMPK) phosphorylation in mice. (A) AMPK phosphorylation in liver tissues was detected by Western blot analysis. Expression levels were normalized to that of the AMPK protein. (B) The quantification of the immunoblot by densitometry. The data are means ± SD of triplicate determinations. Different letters indicate significant differences (a, b, c, d, bc) (p < 0.05) following Duncan’s multiple range test. MCD: methionine choline deficient; DMC: demethoxycurcumin; CM: curcumin; BDMC: demethoxycurcumin.CC BY · PubMed Central
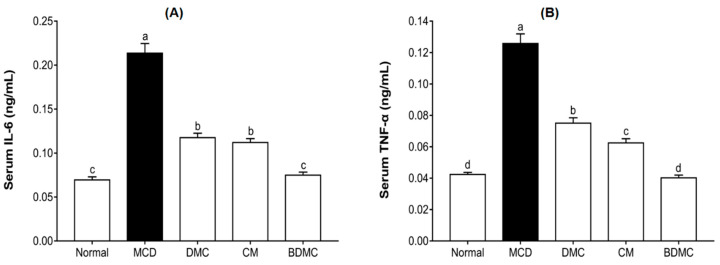
Figure 13 Effects of curcuminoids on interleukin (IL)-6 and tumor necrosis factor (TNF)-α concentrations in mice. Blood samples were collected, and plasma IL-6 (A) and TNF-α (B) concentrations were determined. The data are means ± SD of triplicate determinations. Different letters indicate significant differences (a, b, c, d) (p < 0.05) following Duncan’s multiple range test. MCD: methionine choline deficient; DMC: demethoxycurcumin; CM: curcumin; BDMC: demethoxycurcumin.
Figure 13 Effects of curcuminoids on interleukin (IL)-6 and tumor necrosis factor (TNF)-α concentrations in mice. Blood samples were collected, and plasma IL-6 (A) and TNF-α (B) concentrations were determined. The data are means ± SD of triplicate determinations. Different letters indicate significant differences (a, b, c, d) (p < 0.05) following Duncan’s multiple range test. MCD: methionine choline deficient; DMC: demethoxycurcumin; CM: curcumin; BDMC: demethoxycurcumin.CC BY · PubMed Central
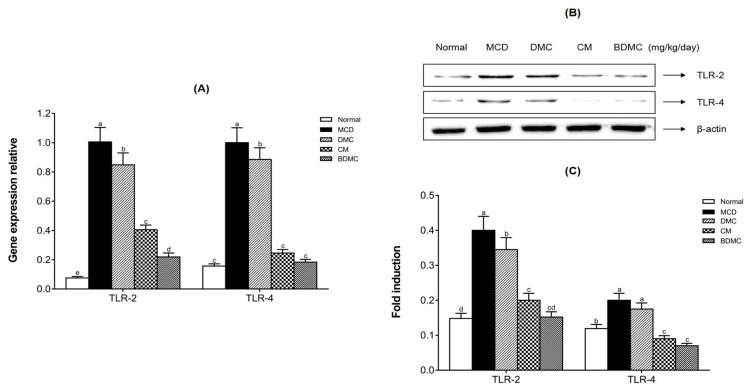
Figure 14 Effects of curcuminoids on toll-like receptor protein and mRNA expression in mice. (A) The mRNA expression levels of TLR-2 and TLR-4 in liver tissues were detected by real-time RT-PCR, and GAPDH served as an internal control. (B) Toll-like receptor-2 (TLR-2) and toll-like receptor-4 (TLR-4) protein expression levels in liver tissues were detected by Western blot analysis. Expression levels were normalized to those of the β-actin protein. (C) The quantification of the immunoblot by densitometry. The data are means ± SD of triplicate determinations. Different letters in the same group indicate significant differences (a, b, c, d, e, cd) (p < 0.05) following Duncan’s multiple range test. MCD: methionine choline deficient; DMC: demethoxycurcumin; CM: curcumin; BDMC: demethoxycurcumin.
Figure 14 Effects of curcuminoids on toll-like receptor protein and mRNA expression in mice. (A) The mRNA expression levels of TLR-2 and TLR-4 in liver tissues were detected by real-time RT-PCR, and GAPDH served as an internal control. (B) Toll-like receptor-2 (TLR-2) and toll-like receptor-4 (TLR-4) protein expression levels in liver tissues were detected by Western blot analysis. Expression levels were normalized to those of the β-actin protein. (C) The quantification of the immunoblot by densitometry. The data are means ± SD of triplicate determinations. Different letters in the same group indicate significant differences (a, b, c, d, e, cd) (p < 0.05) following Duncan’s multiple range test. MCD: methionine choline deficient; DMC: demethoxycurcumin; CM: curcumin; BDMC: demethoxycurcumin.CC BY · PubMed Central

Verification

Claims the paper makes

The claims and statistics of this paper haven’t been checked yet.

Run the check — free, no account needed. It reads the open-access text and checks the sources it cites.

A few free checks a day · papers already verified open instantly · results are public

Claims other papers make about this one

Each is checked against this paper’s own text: does it say what the citing paper says it does?

Self-check

Percentages, sums and reported differences re-computed from the paper’s own numbers.

The self-check needs the paper’s full text.

Citations

Cites

Show all 65 references

Research works printed but not linked: 3

  1. Song, 2010, A Study on the Trend of World Traditional Medicine and Key Area of Traditional Korean Medicine(TKM) R&D, Korean J. Orient. Med., 16, 101
  2. Zhao, 2019, Salidroside attenuates oxidized lowdensity lipoproteininduced endothelial cell injury via promotion of the AMPK/SIRT1 pathway, Int. J. Mol. Med., 43, 2279
  3. Kang, 1998, Antioxidative property of turmeric (Curcuma Rhizoma) ethanol extract, Korean J. Food Sci. Technol., 30, 226

Cited by

See all 30

Metadata

Authors
Lee, Y.-S., Oh, S. M., Li, Q.-Q., Kim, K.-W., Yoon, D., Lee, M.-H., Kwon, D.-Y., Kang, O.-H., & Lee, D. Y.
Affiliations
  • Rural Development Administration (KR)
  • College of Pharmacy and Wonkwang-Oriental Medicines Research Institute, Institute of Biotechnology, Wonkwang University, Iksan 54538, Korea
  • Eulji University (KR)
  • Wonkwang University (KR)
Corresponding author
  • Kang, Ok-Hwa
  • Lee, Dae Young
Venue
Current Issues in Molecular Biology
Publisher
MDPI AG
Published
2022-01-15
Volume
44
Issue
1
Pages
409-432
ISSN
  • 1467-3037 (ISSN-L)
  • 1467-3045
OpenAlex
W4206066599
Cited by
30
References
65
Citations by year
2026: 6 · 2025: 9 · 2024: 6 · 2023: 6 · 2022: 3
FWCI
1.97
Type
journal article
Language
en
Open access
Locations
  • Current Issues in Molecular Biology (publishedVersion, cc-by)
  • PubMed Central (publishedVersion, cc-by)
  • PubMed (publishedVersion)
  • DOAJ (DOAJ: Directory of Open Access Journals) (submittedVersion, cc-by-sa)
Funders
Rural Development Administration (PJ01327501)
Topics
  • Life Sciences › Biochemistry, Genetics and Molecular Biology › Molecular Medicine › Curcumin's Biomedical Applications
  • Physical Sciences › Chemistry › Analytical Chemistry › Analytical Methods in Pharmaceuticals
  • Life Sciences › Pharmacology, Toxicology and Pharmaceutics › Pharmacology › Saffron Plant Research Studies
Keywords
curcumin derivatives, demethoxycurcumin, bisdemethoxycurcumin, curcuminoids, non-alcoholic fatty liver disease, hepatoprotection, methionine-choline-deficient diet, liver lipogenesis, Toll-like receptors, inflammatory cytokines, lipid accumulation, HPLC method validation, turmeric

About these checks

Registry, retraction, Cites and statistics results are computed, not judged, with one exception: a printed reference that no index lists is read once by a model before it counts as a citation error. Claims are extracted by a model and kept only when their quote appears verbatim in the text; each cited source is then checked, with a model’s help, for whether it says what the claim relies on. Those verdicts can be wrong — read the claim’s quote and the cited source before relying on one.

Statistics and arithmetic are recomputed, not judged.

Confidence bands are shown only for fields calibrated on our annotated test set. None is calibrated yet, so no band is shown.

What counts as a claim ›How we measure confidence ›How we check this ›

Are you an author, or do you see a problem with this page? Request a review