

The DOI matches its Crossref record; 17 of the 18 references it cites were found in a registry or an index, and 1 are not checked yet; none of the 19 sources its claims cite is checked for support yet.
Climate Change and Extreme Events in Northeast Atlantic and Azores Islands Region
Open accessAbstract
In small island regions, the influence of climate change assumes particular relevance. In the Azores archipelago, made up of nine islands, the geographical circumstances, oceanic condition, territorial dispersion, land use model and other physiographic constraints reinforce and enhance the vulnerability of the islands to changes in current weather patterns. Coupled Model Intercomparison Phase 6 (CMIP6) projections are used for the northeast Atlantic region to evaluate daily extreme climate events in large scale for the Azores region. Results shows changes in the annual maximum number of consecutive dry days, the annual number of wet days, and especially in the annual number of tropical nights. Despite limitations due to the lack of spatial detail, the large-scale framework suggests changes that may be enhanced by topography, particularly with respect to precipitation. The conclusions point to the need to establish standard rules in the processes of design, reviewing and/or amending territorial management instruments at the municipal scale in the Autonomous Region of the Azores, with the goal of adapting to a different climate from the recent past.
Checked 2026-11-12 · 1 reference not checked yet
Overview
CoChat Summary
Written by AI from the paper’s full text.
TL;DR
This study uses CMIP6 projections to assess daily extreme climate indices in the Azores and northeast Atlantic, finding significant warming and increases in tropical nights, while precipitation changes remain small and scenario-dependent. It concludes that territorial management in the Azores should adapt to a climate different from the recent past, but coarse model resolution limits island-scale inference.
Key findings
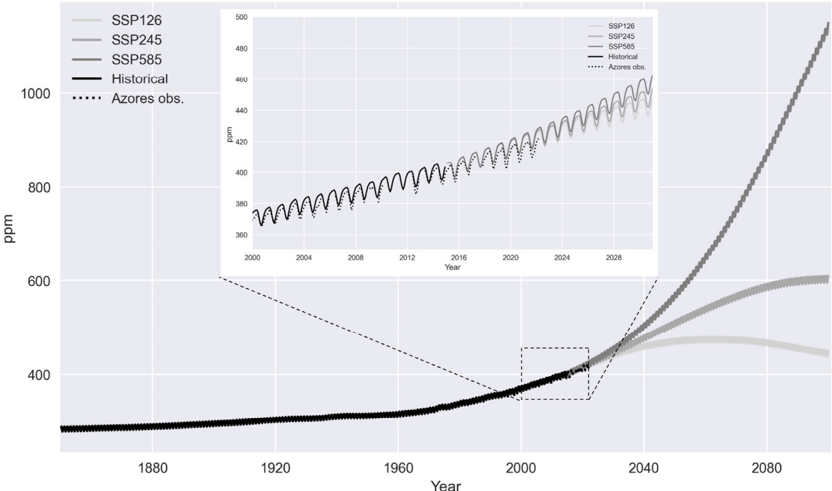
- Atmospheric CO₂ at Serreta increased significantly over 1980–2022 (measurements 1.73 ± 0.03 ppm/year; historical simulation 1.85 ± 0.03 ppm/year). Scenarios diverge after about 2024; SSP2-4.5 tends toward ~600 ppm(v), SSP1-2.6 reaches a maximum by 2060, and SSP5-8.5 increases exponentially.
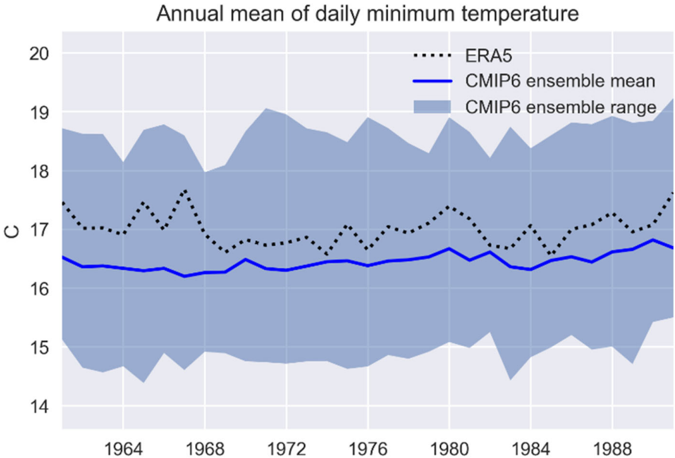
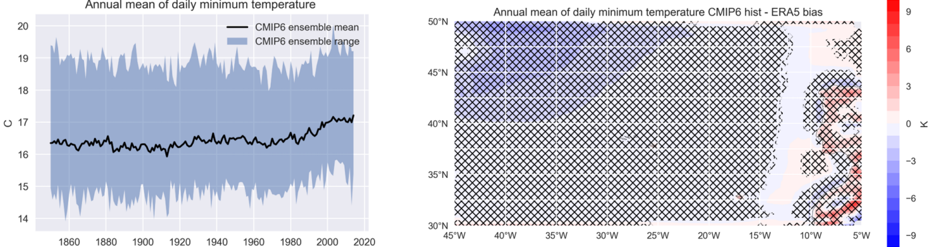
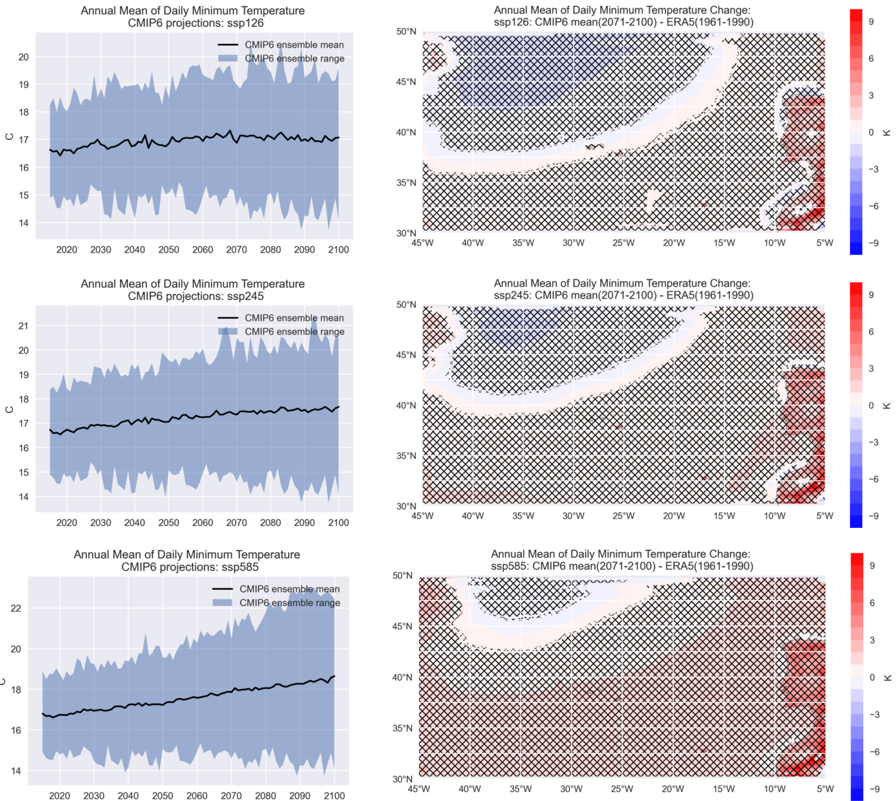
- CMIP6 historical daily minimum temperature underestimates ERA5 by -0.56 ± 0.27 K (p < 0.05) and shows a positive trend of 0.038 ± 0.003 K/decade from 1850–2014. Projected trends are 0.055 ± 0.006, 0.118 ± 0.004, and 0.225 ± 0.003 K/decade for SSP1-2.6, SSP2-4.5, and SSP5-8.5; end-century changes are 0.073 ± 0.289 K (not significant), 0.539 ± 0.293 K, and 1.221 ± 0.347 K.
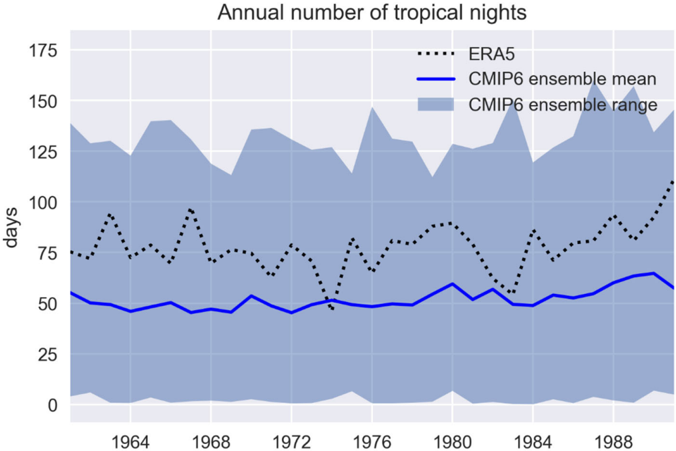
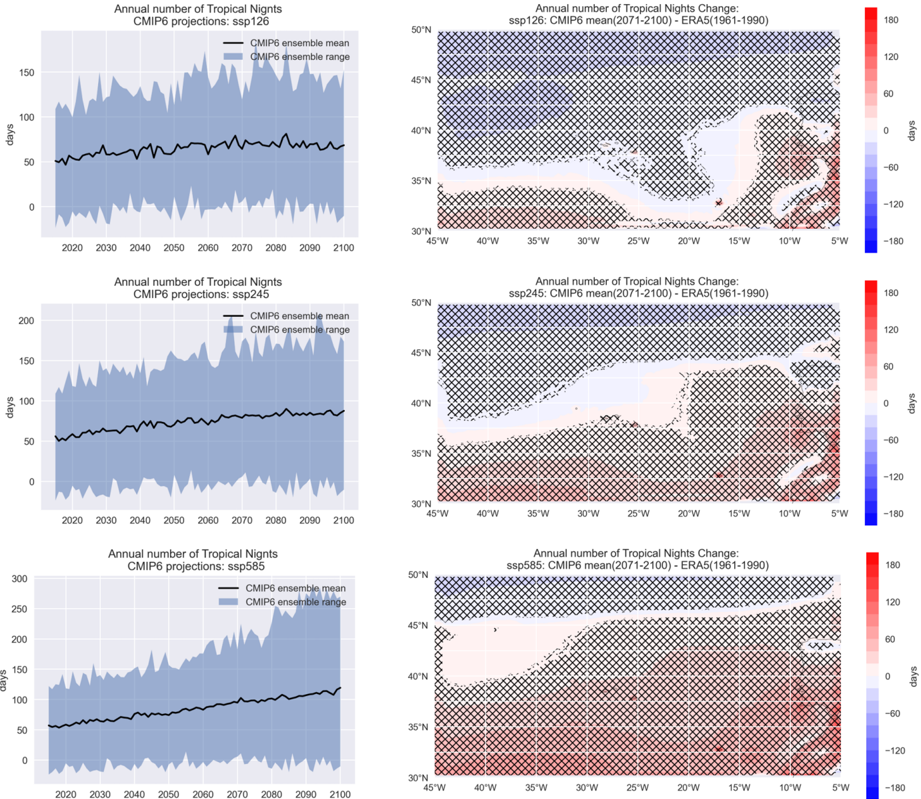
- Tropical nights show a historical bias of -26.0 ± 12.2 nights. Projected trends are 0.20 ± 0.02, 0.38 ± 0.01, and 0.72 ± 0.01 days/decade; end-century changes are -7.57 ± 12.57 days (SSP1-2.6), 6.71 ± 12.03 days (SSP2-4.5), and 28.15 ± 12.56 days (SSP5-8.5). The ensemble range can vary from zero to almost 300 days by the end of the century.
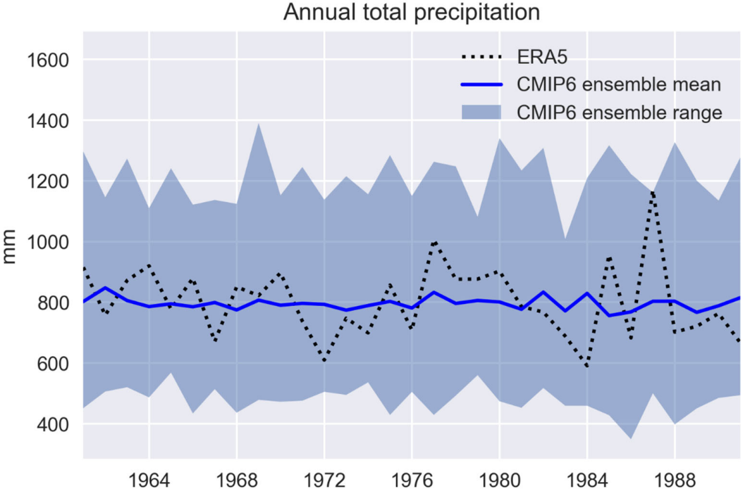
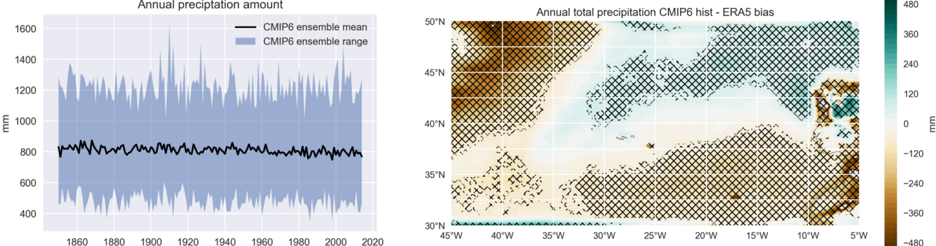
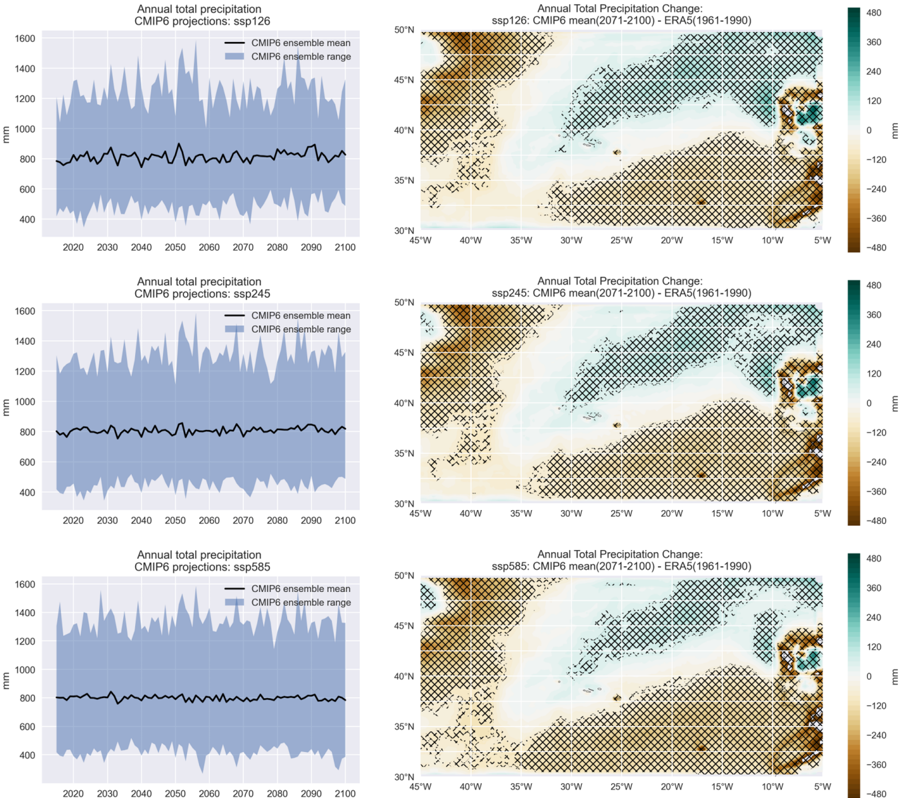
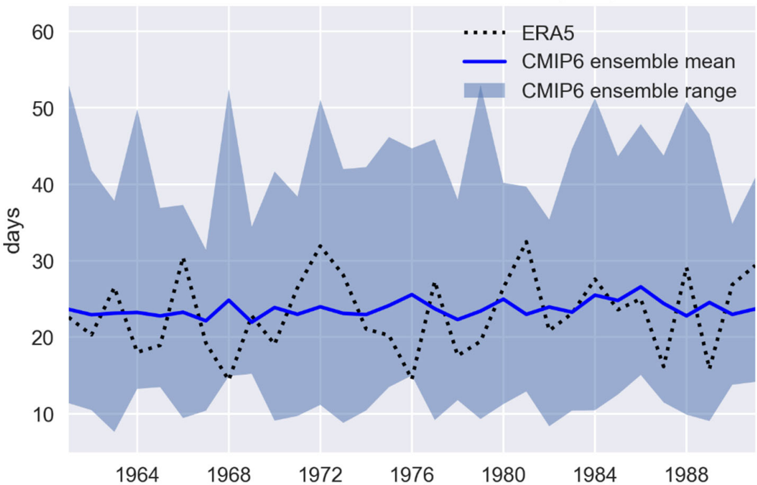
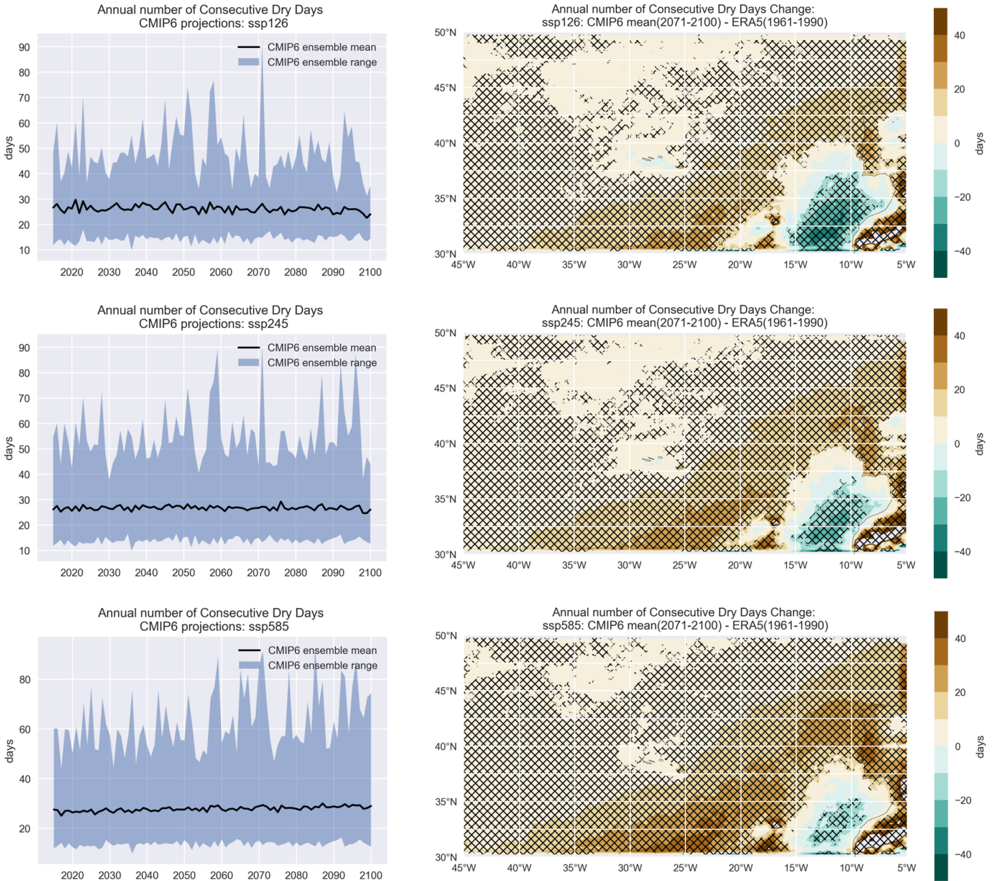
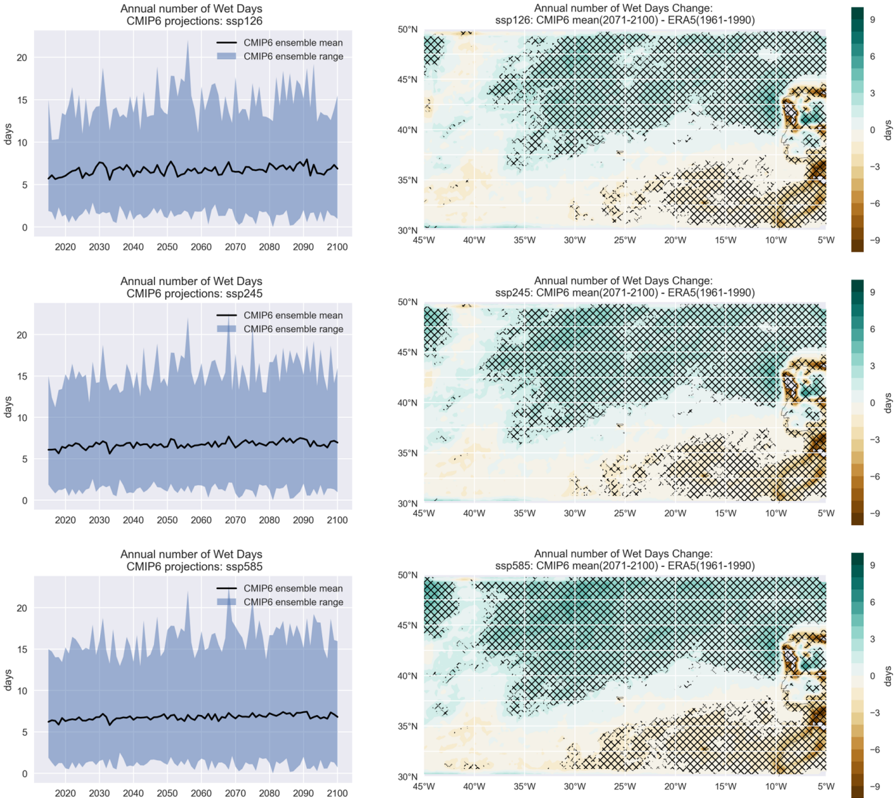
- Annual precipitation historical bias is -6.3 ± 123.7 mm (p = 0.78, not significant), and projected annual precipitation changes are not statistically significant for the Azores in all scenarios. CDD historical bias is 0.61 ± 5.3 days (not significant), with projected changes of 2.83 ± 5.20, 3.78 ± 5.01, and 5.64 ± 4.96 days. R20 mm historical bias is -0.16 ± 1.80 days (not significant); positive significant trends occur in all scenarios, with SSP2-4.5 and SSP5-8.5 end-century changes of 1.1 ± 1.9 days.
Methods
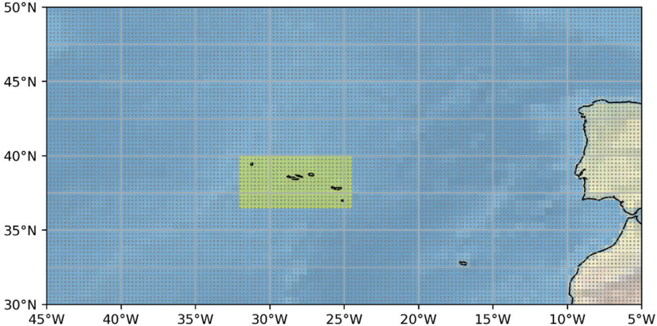
- The study defines an Azores region between 36.5–40°N and 32–24.5°W, plus a larger northeast Atlantic area (30–50°N, 5–45°W). It uses 33 CMIP6 models, with subsets depending on variable and scenario, only variant r1i1p1f1, and three SSP scenarios: SSP1-2.6, SSP2-4.5, and SSP5-8.5.
- Daily total precipitation (PRECTOT) and daily minimum temperature (TNM) are analyzed. Extreme indices CDD, R20 mm, and TR are computed with XCLIM. ERA5 1961–1990 is the reference, regridded to 0.25° × 0.25°. Spatial averages, biases, linear trends, and projected changes for 2071–2100 relative to 1961–1990 are evaluated with t-tests at p < 0.05. CO₂ data come from Serreta station (1980–2022) and input4MIPs historical/projection datasets.
Limitations
- Paper-stated: CMIP6 projections reflect large-scale features, not each island individually; island-scale differences may depend on physiographic characteristics. Ensemble means smooth year-to-year amplitudes, so individual years should be treated cautiously. The methodology only allows annual trends and changes, not seasonal trends. The authors also note no comparable literature evaluations of CMIP6 or CMIP5 extremes in oceanic regions or small islands.
- Paper-stated resolution limits: ERA5 resolution is about 28 km latitude × 22 km longitude; only São Miguel, Pico, Terceira, and São Jorge are larger than this. ERA5 underestimates topography (e.g., highest elevation in ERA5 for the Azores region is 116 m on São Miguel versus 1103 m actual; Pico shows 80 m in ERA5 versus 2351 m actual). CMIP6 nominal resolution is 100–500 km, while São Miguel is only 64 km long; most models show maximum altitudes of 3–27 m, some show no elevation, and all underestimate ERA5 by at least 100 m.
- Evident from the text: several sections and tables are duplicated or truncated in the provided full text, which limits verification of some reported values and reproducibility.
Model-written summary. Check it against the paper before relying on it.
Integrity signals
Registry
Cites
Statistics
Figures
Verification
Claims the paper makes
58 Own result · 15 Own interpretation · 9 Own method · 7 Not checked yet · 4 No full text of the sources · 2 Sources not found · 2 Check pending
A result the paper reports from its own data — it cites no other source for it, so there is none to check. The quote shows it is in the paper.
In the paper
“The results show a small but non-statistically significant (pvalue = 0.78) bias of -6.3 ± 123.7 mm in the region.”
§ Climate Change and Extreme Events in Northeast Atlantic and Azores Islands Region > Annual Total Precipitation Amount
plain- Asserted: passes — The authors put it forward as true.
- Checkable: passes — It can be checked against evidence.
- Load-bearing: unclear — It is unclear whether the paper’s conclusions depend on it.
- Based: passes — The paper gives a reason why it holds.
A result the paper reports from its own data — it cites no other source for it, so there is none to check. The quote shows it is in the paper.
In the paper
“Results show that the CMIP6 ensemble mean of historical simulations of the annual mean of the daily minimum temperature show statistically significant biases for the Azores region and for other regions of the Northeast Atlantic (Figure 3).”
- Also stated in: § 2. · plain
“The annual average daily minimum temperature projected by the CMIP6 models in the Azores presents a significant bias compared to the ERA5 reference.This is also true to most part of the Northeast Atlantic area.”
§ Climate Change and Extreme Events in Northeast Atlantic and Azores Islands Region > Discussion
plainstates an association- Asserted: passes — The authors put it forward as true.
- Checkable: passes — It can be checked against evidence.
- Load-bearing: passes — The paper’s conclusions depend on it.
- Based: passes — The paper gives a reason why it holds.
- Rests on an assumption not shown here.
- Also stated in: § 2. · plain
A result the paper reports from its own data — it cites no other source for it, so there is none to check. The quote shows it is in the paper.
In the paper
“Projected changes for the end of the XXI century show positive and statistically significant small values in the Azores region.”
§ Climate Change and Extreme Events in Northeast Atlantic and Azores Islands Region > Discussion
plain- Asserted: passes — The authors put it forward as true.
- Checkable: passes — It can be checked against evidence.
- Load-bearing: passes — The paper’s conclusions depend on it.
- Based: passes — The paper gives a reason why it holds.
- Rests on an assumption not shown here.
A result the paper reports from its own data — it cites no other source for it, so there is none to check. The quote shows it is in the paper.
In the paper
“The same is true of the changes projected for the end of the 21st century.”
§ Climate Change and Extreme Events in Northeast Atlantic and Azores Islands Region > Discussion
plain- Asserted: passes — The authors put it forward as true.
- Checkable: passes — It can be checked against evidence.
- Load-bearing: passes — The paper’s conclusions depend on it.
- Based: passes — The paper gives a reason why it holds.
- Rests on an assumption not shown here.
A result the paper reports from its own data — it cites no other source for it, so there is none to check. The quote shows it is in the paper.
In the paper
“Between these two areas of different bias signals, a small bias boundary crosses the ocean, including the Central Group of the Azores islands.”
§ Climate Change and Extreme Events in Northeast Atlantic and Azores Islands Region > Discussion
plain- Asserted: passes — The authors put it forward as true.
- Checkable: passes — It can be checked against evidence.
- Load-bearing: unclear — It is unclear whether the paper’s conclusions depend on it.
- Based: passes — The paper gives a reason why it holds.
- It may state two separate claims as one. 38
- Probably not a substantial claim. 10
- The quote only partly states this claim. 1
Create a free account to see these claims.
Create a free account to see these assumptions.
48 more claims
Create a free account to see all 97 claims and to verify the 11 references still open.
Self-check
Percentages, sums and reported differences re-computed from the paper’s own numbers.
Each contradiction between two passages listed here was confirmed by an independent check.
Rated major: it would touch a result — a value a result rests on, reported and recomputed p-values on opposite sides of the significance level, two passages that conflict with no sign which is right, or a cited work retracted before this paper was published.
In the paper
§ Climate Change and Extreme Events in Northeast Atlantic and Azores Islands Region > 3.
“An increase in the annual number of tropical nights is also very likely in all scenarios.”
§ Climate Change and Extreme Events in Northeast Atlantic and Azores Islands Region > 3.
“| ssp126 | 0.20 ± 0.02 | 1.21 × 10 -14 | -7.57 ± 12.57 | 1.38 × 10 -3 |”
Rated minor: it would not touch a result — a value no result rests on, a p-value that stays on the same side of the significance level, or a conflict that is clerical, resolved elsewhere in the paper, or outside its own findings.
In the paper
§ Climate Change and Extreme Events in Northeast Atlantic and Azores Islands Region > 3.
“Figure 5. CMIP6-projected annual mean daily minimum temperature for the Azores region and for SSP1 2.6 (top), SSP2 4.5 (middle) and SSP5 5.8 (bottom) scenarios.”
§ Climate Change and Extreme Events in Northeast Atlantic and Azores Islands Region > Model
“In this work we used three SSP scenarios: SSP1 2.6, SSP2 4.5 and SSP5 8.5.”
Rated minor: it would not touch a result — a value no result rests on, a p-value that stays on the same side of the significance level, or a conflict that is clerical, resolved elsewhere in the paper, or outside its own findings.
In the paper
§ Climate Change and Extreme Events in Northeast Atlantic and Azores Islands Region > Atmospheric CO2
“CO 2 historical simulation shows a non-statistically significant (p-value < 0.05) positive bias of 1.39 ± 2.48 ppm relative to ERA5”
§ Climate Change and Extreme Events in Northeast Atlantic and Azores Islands Region > Model
“The results are considered statistically significant when the p-values are less than 0.05, i.e., when the confidence interval is 95%.”
Rated minor: it would not touch a result — a value no result rests on, a p-value that stays on the same side of the significance level, or a conflict that is clerical, resolved elsewhere in the paper, or outside its own findings.
In the paper
§ Climate Change and Extreme Events in Northeast Atlantic and Azores Islands Region > Annual Total Precipitation Amount
“Figure 10 (left column) shows the ensemble means and ranges of the annual mean of the daily minimum temperature for each of the three scenarios.”
§ Climate Change and Extreme Events in Northeast Atlantic and Azores Islands Region > 3.
“Figure 10.CMIP6-projected annual precipitation for the Azores region and for SSP1 2.6 (top), SSP2 4.5 (middle) and SSP5 5.8 (bottom) scenarios.”
Rated minor: it would not touch a result — a value no result rests on, a p-value that stays on the same side of the significance level, or a conflict that is clerical, resolved elsewhere in the paper, or outside its own findings.
In the paper
§ Climate Change and Extreme Events in Northeast Atlantic and Azores Islands Region > 3.
“| Scenario | Trend (mm/Decade) | Trend p-Value | Δ (K) | Δ p-Value |”
§ Climate Change and Extreme Events in Northeast Atlantic and Azores Islands Region > 3.
“Table: 7 Table 7 . CMPI6 ensemble mean projections of annual total precipitation amount for the Azores region.Linear trends (2015-2100) and projected changes (Δ) for 2071-2100 relative to1961-1990.”
4 more findings
Create a free account to see every finding of this check.
Citations
Cites
Hersbach, H., Bell, B., Berrisford, P., Hirahara, S., Horányi, A., Muñoz‐Sabater, J., Nicolas, J., Peubey, C., Radu, R., Schepers, D., et al. (2020) · Quarterly Journal of the Royal Meteorological Society · doi:10.1002/qj.3803 · Cited by 31,882
Climate Change 2014 Impacts, Adaptation, and Vulnerability
(IPCC), I. P. O. C. C. (2014) · Cambridge University Press eBooks · doi:10.1017/cbo9781107415379 · Cited by 14,994
Eyring, V., Bony, S., Meehl, G. A., Senior, C. A., Stevens, B., Stouffer, R. J., & Taylor, K. E. (2016) · Geoscientific Model Development · doi:10.5194/gmd-9-1937-2016 · Cited by 11,981
(IPCC), I. P. O. C. C. (2023) · doi:10.1017/9781009157896 · Cited by 6,972
The Scenario Model Intercomparison Project (ScenarioMIP) for CMIP6
O'Neill, B. C., Tebaldi, C., van Vuuren, D. P., Eyring, V., Friedlingstein, P., Hurtt, G., Knutti, R., Kriegler, E., Lamarque, J.-F., Lowe, J., et al. (2016) · Geoscientific Model Development · doi:10.5194/gmd-9-3461-2016 · Cited by 5,241
A new scenario framework for climate change research: the concept of shared socioeconomic pathways
O’Neill, B. C., Kriegler, E., Riahi, K., Ebi, K. L., Hallegatte, S., Carter, T. R., Mathur, R., & van Vuuren, D. P. (2014) · Climatic Change · doi:10.1007/s10584-013-0905-2 · Cited by 2,716
Peixoto, J. P., Oort, A. H., Covey, C., & Taylor, K. E. (1992) · Physics Today · doi:10.1063/1.2809772 · Cited by 1,197
Historical greenhouse gas concentrations for climate modelling (CMIP6)
Meinshausen, M. A., Vogel, E., Nauels, A., Lorbacher, K., Meinshausen, N., Etheridge, D. M., Fraser, P. J., Montzka, S. A., Rayner, P. J., Trudinger, C. M., et al. (2017) · Geoscientific model development · doi:10.5194/gmd-10-2057-2017 · Cited by 784
Kriegler, E., Edmonds, J., Stéphane Hallegatte, A., Ebi, K. L., Kram, T., Riahi, K., Winkler, H., & van Vuuren, D. P. (2014) · Climatic Change · doi:10.1007/s10584-013-0971-5 · Cited by 589
Research works printed but not linked: 10
- (2022). Global Warming of 1.5 °C, Cambridge University Press.
- Wallace, J.M., and Hobbs, P.V. (2006). Atmospheric Science: An Introductory Survey: Second Edition, Elsevier Inc.
- Stensrud, D.J. (2009). Parameterization Schemes: Keys to Understanding Numerical Weather Prediction Models, Cambridge University Press.
- Carvalho, 2020, Alterações Climáticas e o Aumento de Eventos Extremos Nos Açores, Bol. Núcleo Cult. Horta, 29, 95
- Carvalho, 2020, Alterações Climáticas e Energia No Contexto Dos Açores, Bol. Núcleo Cult. Horta, 29, 95
- Carvalho, F.R.S., Meirelles, M.G., Henriques, D.V., Navarro, P.V., and Vasconcelos, H.C. (2022). Climate Change Management, Springer Science and Business Media.
- Mcavaney, B.J., and Holland, G.J. (1995). World Survey of Climatology, Elsevier.
- Sandstad, M., Schwingshackl, C., and Iles, C. (2022, June 01). Climate Extreme Indices and Heat Stress Indicators Derived from CMIP6 Global Climate Projections. Copernicus Climate Change Service (C3S) Climate Data Store (CDS). Available online: https://cds.climate.copernicus.eu/cdsapp#!/dataset/10.24381/cds.776e08bd?tab=overview. · DOI
- Pörtner, H.-O., Roberts, D.C., Tignor, M., Poloczanska, E.S., Mintenbeck, K., Alegría, A., Craig, M., Langsdorf, S., Löschke, S., and Möller, V. (2022). Climate Change 2022: Impacts, Adaptation and Vulnerability. Contribution of Working Group II to the Sixth Assessment Report of the Intergovernmental Panel on Climate Change, Cambridge University Press.
- Margolis, H.G. (2014). Global Climate Change and Public Health, Springer.
Cited by
Meirelles, M., & Vasconcelos, H. C. (2025) · Earth · doi:10.3390/earth6020054 · Cited by 9
Self-citationThreats and conservation status of the endemic terrestrial arthropods of the Azores
Oyarzabal, G., Pozsgai, G., Tsafack, N., Cardoso, P., Rigal, F., Boieiro, M., Santos, A. M. C., Amorim, I. R., Malumbres-Olarte, J., Costa, R., et al. (2025) · Biological Conservation · doi:10.1016/j.biocon.2025.111282 · Cited by 7
The Impact of Climate Change on Energy Consumption on Small Tropical Islands
Gargani, J. (2024) · Climate · doi:10.3390/cli12120227 · Cited by 6
Vasconcelos, H. C., Ferreira, A. C., & Meirelles, M. (2025) · Pollutants · doi:10.3390/pollutants5030027 · Cited by 3
Self-citationda Costa, D. P., & Sérgio, C. (2025) · Biodiversity Data Journal · doi:10.3897/bdj.13.e141577 · Cited by 3
Metadata
- Authors
- Carvalho, F. S., Meirelles, M. G., Henriques, D., Porteiro, J., Navarro, P., & Vasconcelos, H. C.
- Affiliations
- Portuguese Sea and Atmosphere Institute (PT)
- Universidade dos Açores (PT)
- Corresponding author
- Vasconcelos, Helena Cristina
- ORCID
- Venue
- Climate
- Publisher
- MDPI AG
- Published
- 2023-12-04
- Volume
- 11
- Issue
- 12
- Pages
- 238
- ISSN
- 2225-1154 (ISSN-L)
- OpenAlex
- W4389306455
- Semantic Scholar
- 1675891189111f0ddf8127d9205406ac431caf80
- Cited by
- 12
- References
- 17
- Citations by year
- 2026: 5 · 2025: 6 · 2024: 1
- FWCI
- 0.94
- Type
- journal article
- Language
- en
- Open access
- gold
- doi.org
- Licence
- Locations
- Climate (publishedVersion, cc-by)
- Portuguese National Funding Agency for Science, Research and Technology (RCAAP Project by FCT) (submittedVersion, other-oa)
- Topics
- Physical Sciences › Environmental Science › Global and Planetary Change › Climate variability and models
- Physical Sciences › Environmental Science › Global and Planetary Change › Climate Change and Environmental Impact
- Physical Sciences › Environmental Science › Global and Planetary Change › Hydrology and Drought Analysis
- Keywords
- climate change, climate extremes, Azores, Northeast Atlantic, CMIP6 projections, consecutive dry days, tropical nights, rainy days, precipitation, climate change adaptation, territorial management, topographic effects on precipitation
About these checks
Registry, retraction, Cites and statistics results are computed, not judged, with one exception: a printed reference that no index lists is read once by a model before it counts as a citation error. Claims are extracted by a model and kept only when their quote appears verbatim in the text; each cited source is then checked, with a model’s help, for whether it says what the claim relies on. Those verdicts can be wrong — read the claim’s quote and the cited source before relying on one.
A language model drew the claims from the paper on 2026-11-12, under version 3 of the claim definition (model deepseek-v4.1-flash, prompt extract-v3).
A second model labelled each claim on 2026-11-12 (model jev-1.13-20260917, definition revision gold-guideline-v0.2).
Statistics and arithmetic are recomputed, not judged.
Confidence bands are shown only for fields calibrated on our annotated test set. None is calibrated yet, so no band is shown.
What counts as a claim ›How we measure confidence ›How we check this ›
Are you an author, or do you see a problem with this page? Request a review
