

The DOI matches its Crossref record; 24 of the 26 references it cites were found in a registry or an index; 22 of the 37 sources its claims cite were checked for support.
DIALOGUE: A Generative AI-Based Pre–Post Simulation Study to Enhance Diagnostic Communication in Medical Students Through Virtual Type 2 Diabetes Scenarios
Open accessAbstract
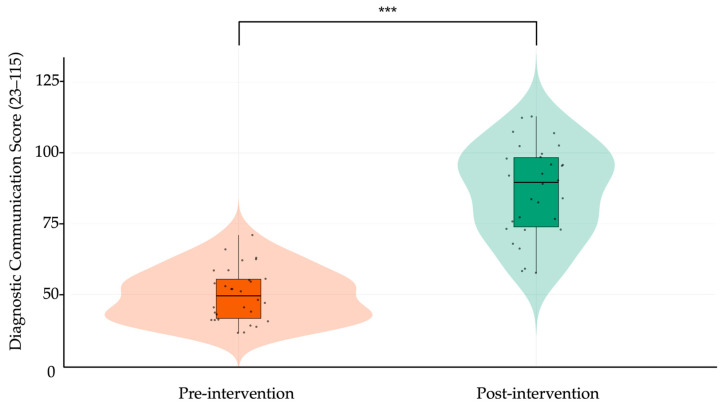
DIALOGUE (DIagnostic AI Learning through Objective Guided User Experience) is a generative artificial intelligence (GenAI)-based training program designed to enhance diagnostic communication skills in medical students. In this single-arm pre–post study, we evaluated whether DIALOGUE could improve students’ ability to disclose a type 2 diabetes mellitus (T2DM) diagnosis with clarity, structure, and empathy. Thirty clinical-phase students completed two pre-test virtual encounters with an AI-simulated patient (ChatGPT, GPT-4o), scored by blinded raters using an eight-domain rubric. Participants then engaged in ten asynchronous GenAI scenarios with automated natural-language feedback. Seven days later, they completed two post-test consultations with human standardized patients, again evaluated with the same rubric. Mean total performance increased by 36.7 points (95% CI: 31.4–42.1; p < 0.001), and the proportion of high-performing students rose from 0% to 70%. Gains were significant across all domains, most notably in opening the encounter, closure, and diabetes specific explanation. Multiple regression showed that lower baseline empathy (β = −0.41, p = 0.005) and higher digital self-efficacy (β = 0.35, p = 0.016) independently predicted greater improvement; gender had only a marginal effect. Cluster analysis revealed three learner profiles, with the highest-gain group characterized by low empathy and high digital self-efficacy. Inter-rater reliability was excellent (ICC ≈ 0.90). These findings provide empirical evidence that GenAI-mediated training can meaningfully enhance diagnostic communication and may serve as a scalable, individualized adjunct to conventional medical education.
Overview
CoChat Summary
TL;DR
DIALOGUE, a single-arm pre–post study in 30 clinical-phase Mexican medical students, tested whether ten asynchronous ChatGPT virtual-patient T2DM diagnostic conversations plus automated feedback improved diagnostic communication. Total rubric scores rose from 49.96 ± 9.72 to 86.70 ± 17.56 (Δ = 36.74, p < 0.001, d = 2.58), with gains across all eight domains.
Key findings
- Pre–post total performance increased by 36.74 points (95% CI: 31.39–42.09; p < 0.001; Cohen’s d = 2.58), and the proportion of high-performing students rose from 0% to 70%; inter-rater reliability was excellent (ICC ≈ 0.90).
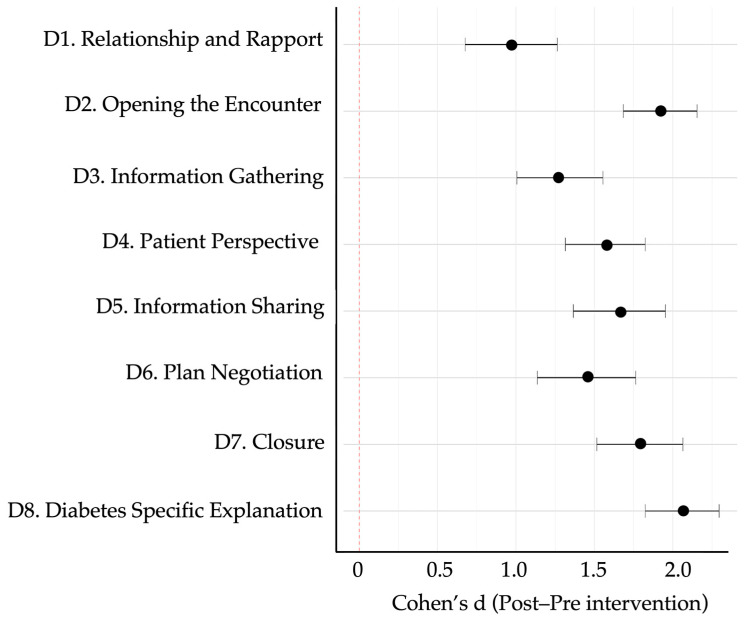
- Largest domain gains were in “Opening” (Δ = 1.92, d = 2.68), “Closure” (Δ = 1.79, d = 2.07), and “Diabetes specific explanation” (Δ = 2.06, d = 2.95); most improved subitems included teach-back (Δ = 2.12), goal negotiation (Δ = 1.58), and empathetic closure (Δ = 1.77).
- Multiple regression explained approximately 37% of variance in Δ-scores (R² = 0.43, adjusted R² = 0.37; F(6, 23) = 4.13, p = 0.004); lower baseline empathy (β = −0.41, p = 0.005) and higher digital self-efficacy (β = 0.35, p = 0.016) independently predicted greater improvement, while gender had only a marginal bivariate effect (p = 0.044) that was not significant after adjustment.
- K-means clustering (k = 3) identified three learner profiles: Cluster A (n = 10; Δ = 58.7 ± 10.2), Cluster B (n = 12; Δ = 33.4 ± 11.5), and Cluster C (n = 8; Δ = 16.2 ± 9.3), with between-cluster differences significant (p < 0.001); 93.3% (28/30) rated the GenAI sessions “very useful” or “extremely useful,” and 86.7% (26/30) were willing to integrate AI-based simulation into future training.
Methods
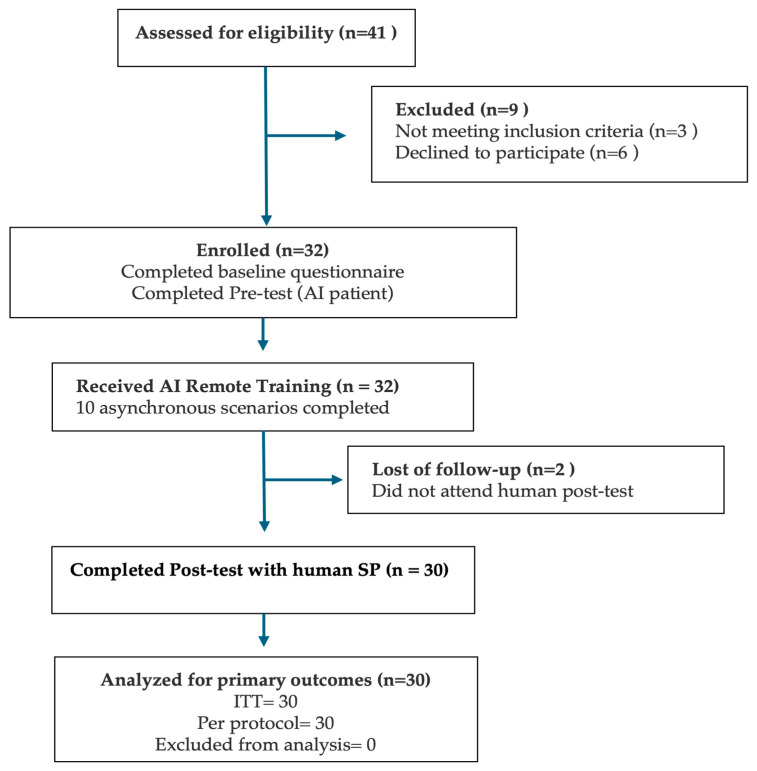
- Prospective, single-arm, pre–post intervention conducted May–June 2025 at FESI-UNAM; 41 students assessed for eligibility, 32 enrolled, and 30 completed the full protocol (two lost to follow-up). Participants were undergraduate medical students in clinical semesters 2–7 recruited by convenience sampling.
- Three phases: pre-test with two AI-simulated T2DM diagnostic encounters (ChatGPT GPT-4o-mini per methods; abstract says GPT-4o), asynchronous training consisting of a 20-min prompt engineering workshop and 40-min diagnostic communication workshop followed by ten independent ChatGPT simulated conversations with a “FEEDBACK” prompt, and post-test seven days later with two live human standardized-patient consultations lasting 5–7 min each, scored by blinded raters.
- Primary outcome was a modified Kalamazoo Essential Elements Communication Checklist (Adapted) with eight domains scored on a 5-point Likert scale; analyses used paired t-tests or Wilcoxon signed-rank tests, Cohen’s d or rank-based r, ICCs, multiple linear regression with AIC stepwise selection, k-means clustering (k = 3), and inductive thematic analysis of over 300 AI-generated feedback responses.
Limitations
- Stated by the authors: absence of a control group limits causal inference; short duration precludes conclusions about long-term retention or clinical transfer; single-institution deployment limits generalizability; AI feedback was not independently validated by clinical educators; LLM stochasticity may affect reproducibility; no comparison to faculty-led instruction or downstream clinical outcomes; participants were aware of study phase, potentially introducing performance expectancy bias.
- Evident from the text (not framed as limitations by the authors): small completer sample (n = 30) and convenience sampling; post-test surveys rely on self-report; the sample was 73.3% female, though the authors state this reflects institutional demographics; baseline Scenario 1 vs Scenario 2 total scores differed modestly (p = 0.05), which the authors interpret as possible procedural learning or familiarity with the simulation format.
Model-written summary. Check it against the paper before relying on it.
Integrity signals
Registry
Cites
Statistics
Figures





Verification
Claims the paper makes
17 Valid · 5 Not valid · 11 Not checked · 112 Own results and interpretations
Every source the paper cites for this claim was checked and supports it.
In the paper
“Effective doctor–patient communication improves the quality of care”
§ DIALOGUE: A Generative AI-Based Pre–Post Simulation Study to Enhance Diagnostic Communication in Medical Students Through Virtual Type 2 Diabetes Scenarios > 1. Introduction
What the sources say
- Supportedcites Moezzi et al., 2024 source
The Introduction states that effective doctor–patient communication is crucial for quality medical care and that poor communication can impair diagnosis and treatment. This supports the citing sentence’s general claim, though the paper presents it as background rather than as a result of its own study. (LLM, conf=0.92)
plainstates a cause- Asserted: passes — The authors put it forward as true.
- Checkable: passes — It can be checked against evidence.
- Load-bearing: passes — The paper’s conclusions depend on it.
- Based: passes — The paper gives a reason why it holds.
- Supported
The cited sources support only part of this claim — read each source’s verdict below.
In the paper
“The recent emergence of generative AI models capable of producing coherent, unscripted dialogue opens new possibilities for scalable, on-demand simulations (Kung et al., 2023).”
§ DIALOGUE: A Generative AI-Based Pre–Post Simulation Study to Enhance Diagnostic Communication in Medical Students Through Virtual Type 2 Diabetes Scenarios > 1. Introduction
What the sources say
- Partly supportedcites Kung et al., 2023 sourceExperimental — accuracy not yet measured
The Methods (Artificial Intelligence; page unavailable) describes ChatGPT generating coherent, contextually appropriate responses in a conversational context. The Discussion (The potential for AI-assisted human learning in medical education; page unavailable) proposes using generative AI to create clinical vignettes and exam items, but does not address scalable, on-demand dialogue simulations. (LLM, conf=0.85)
plainstates a possible cause- Asserted: passes — The authors put it forward as true.
- Checkable: passes — It can be checked against evidence.
- Load-bearing: passes — The paper’s conclusions depend on it.
- Based: passes — The paper gives a reason why it holds.
- Partly supported
Every source the paper cites for this claim was checked and supports it.
In the paper
“Simulation-based education has long been an integral strategy for teaching clinical communication and diagnostic reasoning skills in a safe, controlled environment (Elendu et al., 2024).”
§ DIALOGUE: A Generative AI-Based Pre–Post Simulation Study to Enhance Diagnostic Communication in Medical Students Through Virtual Type 2 Diabetes Scenarios > 1. Introduction
What the sources say
- Supportedcites Elendu et al., 2024 sourceExperimental — accuracy not yet measured
The Introduction describes simulation-based training as an integral component of medical education that develops skills in a safe, controlled environment. The Types of simulation section describes practicing communication and making diagnostic decisions with standardized patients. The historical account dates medical simulation to the 1960s, supporting the claim that it is a longstanding strategy. (LLM, conf=0.92)
plain- Asserted: passes — The authors put it forward as true.
- Checkable: passes — It can be checked against evidence.
- Load-bearing: passes — The paper’s conclusions depend on it.
- Based: passes — The paper gives a reason why it holds.
- Supported
Every source the paper cites for this claim was checked and supports it.
In the paper
“A key advantage of these tools lies in their capacity to tailor educational experiences—analyzing individual learner profiles and adapting feedback to specific gaps and learning styles (Chokkakula et al., 2025).”
§ DIALOGUE: A Generative AI-Based Pre–Post Simulation Study to Enhance Diagnostic Communication in Medical Students Through Virtual Type 2 Diabetes Scenarios > 1. Introduction
What the sources say
- Supportedcites Chokkakula et al., 2025 source
The “AI-driven personalized learning experiences in medical education” section says ChatGPT analyzes student interactions to create learner profiles and adapts content to individual needs and learning styles. The “ChatGPT in programmatic assessment” section says AI can identify knowledge gaps and provide adaptive, personalized feedback. (LLM, conf=0.92)
plainstates a cause- Asserted: passes — The authors put it forward as true.
- Checkable: passes — It can be checked against evidence.
- Load-bearing: passes — The paper’s conclusions depend on it.
- Based: passes — The paper gives a reason why it holds.
- Supported
Every source the paper cites for this claim was checked and supports it.
In the paper
“Importantly, deficiencies in communication—rather than medical knowledge—are often cited as a leading cause of patient dissatisfaction and complaints (Moezzi et al., 2024).”
§ DIALOGUE: A Generative AI-Based Pre–Post Simulation Study to Enhance Diagnostic Communication in Medical Students Through Virtual Type 2 Diabetes Scenarios > 1. Introduction
What the sources say
- Supportedcites Moezzi et al., 2024 source
The Introduction says that in many cases patient complaints arise from doctors’ poor communication rather than their scientific abilities. The Discussion also links better communication skills with higher patient satisfaction. These passages support the citing sentence’s paraphrase. (LLM, conf=0.90)
plainstates a cause- Asserted: passes — The authors put it forward as true.
- Checkable: passes — It can be checked against evidence.
- Load-bearing: passes — The paper’s conclusions depend on it.
- Based: passes — The paper gives a reason why it holds.
- Supported
51 more claims · 4 with their cited sources checked
Create a free account to see all 145 claims and every source verdict.
- It may state two separate claims as one. 63
- Probably not a substantial claim. 38
- Borderline: one of the tests for a substantial claim is unclear. 1
Statistics that don’t add up
Each reported p-value recomputed from its test statistic and degrees of freedom.
Rated minor: it would not touch a result — a value no result rests on, a p-value that stays on the same side of the significance level, or a conflict that is clerical, resolved elsewhere in the paper, or outside its own findings.
In the paper
“F(6, 23) = 4.13, p = 0.004”
§ DIALOGUE: A Generative AI-Based Pre–Post Simulation Study to Enhance Diagnostic Communication in Medical Students Through Virtual Type 2 Diabetes Scenarios > 3. Results > 3.4. Predictors of Improvement
Reported p = .004 · recomputed p = .006
Statistics recomputed
Every reported test result, recomputed from its test statistic and degrees of freedom. A result shows as not adding up only once an independent check has confirmed it.
- Doesn’t add upF(6, 23) = 4.13reported p = .004 · recomputed p = .006
“F(6, 23) = 4.13, p = .004”
Self-check
Percentages, sums and reported differences re-computed from the paper’s own numbers.
Each contradiction between two passages listed here was confirmed by an independent check.
Rated major: it would touch a result — a value a result rests on, reported and recomputed p-values on opposite sides of the significance level, two passages that conflict with no sign which is right, or a cited work retracted before this paper was published.
In the paper
§ DIALOGUE: A Generative AI-Based Pre–Post Simulation Study to Enhance Diagnostic Communication in Medical Students Through Virtual Type 2 Diabetes Scenarios > 3. Results > 3.4. Predictors of Improvement
“R2 = 0.43, adjusted R2 = 0.37”
§ DIALOGUE: A Generative AI-Based Pre–Post Simulation Study to Enhance Diagnostic Communication in Medical Students Through Virtual Type 2 Diabetes Scenarios > 3. Results > 3.4. Predictors of Improvement
“F(6, 23) = 4.13, p = 0.004”
Rated major: it would touch a result — a value a result rests on, reported and recomputed p-values on opposite sides of the significance level, two passages that conflict with no sign which is right, or a cited work retracted before this paper was published.
In the paper
§ DIALOGUE: A Generative AI-Based Pre–Post Simulation Study to Enhance Diagnostic Communication in Medical Students Through Virtual Type 2 Diabetes Scenarios > 2. Materials and Methods > 2.4. Evaluation Instruments
“The rubric was adapted for T2DM diagnostic disclosure and included eight domains: (1) opening and rapport, (2) patient-centered history, (3) empathic listening, (4) clarity of explanation, (5) emotional containment, (6) lay language use, (7) shared decision-making, and (8) professionalism. Each domain was scored on a 5-point Likert scale (1 = poor, 5 = excellent).”
§ DIALOGUE: A Generative AI-Based Pre–Post Simulation Study to Enhance Diagnostic Communication in Medical Students Through Virtual Type 2 Diabetes Scenarios > 4. Discussion
“The intervention yielded a substantial within-subject gain (Δ = +36.7 points on a 115-point rubric), with large effect sizes across all eight assessed domains.”
Rated major: it would touch a result — a value a result rests on, reported and recomputed p-values on opposite sides of the significance level, two passages that conflict with no sign which is right, or a cited work retracted before this paper was published.
In the paper
§ DIALOGUE: A Generative AI-Based Pre–Post Simulation Study to Enhance Diagnostic Communication in Medical Students Through Virtual Type 2 Diabetes Scenarios > 4. Discussion
“Three learner profiles were identified, with “Cluster A” students—characterized by high empathy and self-efficacy—demonstrating nearly fourfold higher gains compared to their peers.”
§ DIALOGUE: A Generative AI-Based Pre–Post Simulation Study to Enhance Diagnostic Communication in Medical Students Through Virtual Type 2 Diabetes Scenarios > 3. Results > 3.5. Learner Profiles and Cluster Patterns
“Baseline trait inspection revealed that Cluster A learners started with lower empathy but higher digital self-efficacy, consistent with predictors identified in Section 3.4; Cluster C showed the opposite pattern (higher empathy, lower self-efficacy).”
Rated major: it would touch a result — a value a result rests on, reported and recomputed p-values on opposite sides of the significance level, two passages that conflict with no sign which is right, or a cited work retracted before this paper was published.
In the paper
§ DIALOGUE: A Generative AI-Based Pre–Post Simulation Study to Enhance Diagnostic Communication in Medical Students Through Virtual Type 2 Diabetes Scenarios > 5. Conclusions
“A short, asynchronous GenAI-based intervention led to significant, domain-wide improvements, particularly among students with higher baseline empathy and digital self-efficacy.”
§ DIALOGUE: A Generative AI-Based Pre–Post Simulation Study to Enhance Diagnostic Communication in Medical Students Through Virtual Type 2 Diabetes Scenarios > 3. Results > 3.4. Predictors of Improvement
“baseline empathy was negatively associated with improvement (β = −0.41, SE = 0.13; 95% CI: −0.68 to −0.14; p = 0.005; Figure 6E), indicating that students with lower initial empathy scores tended to achieve larger gains”
Rated major: it would touch a result — a value a result rests on, reported and recomputed p-values on opposite sides of the significance level, two passages that conflict with no sign which is right, or a cited work retracted before this paper was published.
In the paper
§ DIALOGUE: A Generative AI-Based Pre–Post Simulation Study to Enhance Diagnostic Communication in Medical Students Through Virtual Type 2 Diabetes Scenarios > 2. Materials and Methods > 2.8. Statistical Analysis
“Cluster analysis (k-means, k = 3) was performed on standardized baseline variables to identify latent learner profiles.”
§ DIALOGUE: A Generative AI-Based Pre–Post Simulation Study to Enhance Diagnostic Communication in Medical Students Through Virtual Type 2 Diabetes Scenarios > 3. Results > 3.5. Learner Profiles and Cluster Patterns
“we performed unsupervised k-means clustering (k = 3) based on participants’ domain-level rubric scores before and after the intervention.”
6 more findings
Create a free account to see every finding of this check.
Citations
Cites
Perceived usefulness, perceived ease of use, and user acceptance of information technology
Davis, F. D. (1989) · MIS Quarterly · doi:10.2307/249008 · Cited by 68,483 · cited 1×
“These predictors jointly explained over one-third of the variance in learning gains and resonate with constructs from the technology acceptance model (Davis, 1989), where perceived usability and personal relevance enhance engagement with digital tools.”
Kung, T. H., Cheatham, M., Medenilla, A., Sillos, C., De Leon, L., Elepaño, C., Madriaga, M., Aggabao, R., Diaz-Candido, G., Maningo, J., et al. (2023) · PLOS Digital Health · doi:10.1371/journal.pdig.0000198 · Cited by 4,115 · cited 1×
“The recent emergence of generative AI models capable of producing coherent, unscripted dialogue opens new possibilities for scalable, on-demand simulations (Kung et al., 2023).”
Sallam, M. (2023) · Healthcare · doi:10.3390/healthcare11060887 · Cited by 3,126 · cited 1×
“Previous attempts to digitize these interactions—using scripted virtual patients or rule-based chatbots—have yielded mixed results, often hindered by limited interactivity, lack of realism, and poor accessibility (Sallam, 2023).”
Cook, D. A., Hatala, R., Brydges, R., Zendejas, B., Szostek, J. H., Wang, A. T., Erwin, P. J., & Hamstra, S. J. (2011) · JAMA · doi:10.1001/jama.2011.1234 · Cited by 2,170
CONSORT 2025 statement: updated guideline for reporting randomised trials
Hopewell, S., Chan, A.-W., Collins, G. S., Hróbjartsson, A., Moher, D., Schulz, K. F., Tunn, R., Aggarwal, R., Berkwits, M., Berlin, J. A., et al. (2025) · BMJ · doi:10.1136/bmj-2024-081123 · Cited by 1,195
The impact of simulation-based training in medical education: A review
Elendu, C., Amaechi, D. C., Okatta, A. U., Amaechi, E. C., Elendu, T. C., Ezeh, C. P., & Elendu, I. D. (2024) · Medicine · doi:10.1097/md.0000000000038813 · Cited by 994 · cited 2×
“Simulation-based education has long been an integral strategy for teaching clinical communication and diagnostic reasoning skills in a safe, controlled environment (Elendu et al., 2024).”
Essential Elements of Communication in Medical Encounters: The Kalamazoo Consensus Statement
Makoul, G. (2001) · Academic Medicine · doi:10.1097/00001888-200104000-00021 · Cited by 917 · cited 2×
“The primary outcome was the improvement in diagnostic communication competency, assessed using a modified version of the Kalamazoo Essential Elements Communication Checklist (Adapted), originally developed by the American Academy on Communication in Healthcare (Makoul, 2001a).”
The SEGUE Framework for teaching and assessing communication skills
Makoul, G. (2001) · Patient Education and Counseling · doi:10.1016/s0738-3991(01)00136-7 · Cited by 457 · cited 2×
“The primary outcome was the improvement in diagnostic communication competency, assessed using a modified version of the Kalamazoo Essential Elements Communication Checklist (Adapted), originally developed by the American Academy on Communication in Healthcare (Makoul, 2001a).”
Role-play for medical students learning about communication: guidelines for maximising benefits
Nestel, D., & Tierney, T. (2007) · BMC Medical Education · doi:10.1186/1472-6920-7-3 · Cited by 441 · cited 1×
“Thematic analysis of over 300 AI-generated responses revealed alignment with communication best practices (e.g., “organize your explanation,” “validate patient concerns,” “check for understanding”), echoing established heuristics described by (Nestel & Tierney, 2007).”
American Diabetes Association Professional Practice Committee, ElSayed, N. A., McCoy, R. G., Aleppo, G., Bajaj, M., Balapattabi, K., Beverly, E. A., Briggs Early, K., Bruemmer, D., Cusi, K., et al. (2025) · Diabetes Care · doi:10.2337/dc25-s004 · Cited by 205
Cited by
Basil, M., Ahmed, W., Hajeomar, R., Strawbridge, J., Lynch, M. R., & Mukhalalati, B. (2026) · BMC Medical Education · doi:10.1186/s12909-025-08527-3 · Cited by 20
“The observed advantages of such integration closely align with those reported in the literature [176, 177], while also offering opportunities to train students in the management of rare diseases that can be challenging to secure in clinical placements [178].”
AI-supported case-based learning in medical education: a comprehensive scoping review
Abidi, S. H., Almazan, J., Fabiyi, O. T., Zehra, F., & Tariq, M. (2026) · Frontiers in Medicine · doi:10.3389/fmed.2026.1798097 · Cited by 18
Kotzki, S., Turner, C. M., Gauthier, K., Minovès, M., & Vuillerme, N. (2026) · JMIR Medical Education · doi:10.2196/85243 · Cited by 10
“Emerging evidence also suggests that structured GenAI-supported simulations can improve targeted competencies in medical students [31,32].”
Thind, B. S., Javidi, D., & Schwartz, L. M. (2026) · Frontiers in Digital Health · doi:10.3389/fdgth.2026.1830254 · Cited by 6
Lesińska‐Sawicka, M., & Michalak, B. (2026) · Education Sciences · doi:10.3390/educsci16010126 · Cited by 7
“The realism of such simulations is primarily cognitive-emotional and linguistic in nature, rather than embodied, as AI does not fully replicate non-verbal communication or spontaneous emotional expression (Suárez-García et al., 2025).”
Metadata
- Authors
- Suárez-García, R. X., Chavez-Castañeda, Q., Orrico-Pérez, R., Valencia-Marin, S., Castañeda-Ramírez, A. E., Quiñones-Lara, E., Ramos-Cortés, C. A., Gaytán-Gómez, A. M., Cortés-Rodríguez, J., Jarquín-Ramírez, J., Aguilar-Marchand, N. G., Valdés-Hernández, G., Campos-Martínez, T. E., Vilches-Flores, A., Leon-Cabrera, S., Méndez-Cruz, A. R., Jay-Jímenez, B. O., & Saldívar-Cerón, H. I.
- Affiliations
- Universidad Nacional Autónoma de México, Facultad de Estudios Superiores Iztacala (MX)
- Unidad de Remisión de Diabetes Mellitus (URDM), Facultad de Estudios Superiores-Iztacala, Universidad Nacional Autónoma de México, Tlalnepantla 54090, Mexico
- Instituto Politécnico Nacional (MX)
- Carrera de Médico Cirujano, Facultad de Estudios Superiores-Iztacala, Universidad Nacional Autónoma de México, Tlalnepantla 54090, Mexico
- Corresponding author
- Jay-Jímenez, Brenda Ofelia
- Saldívar-Cerón, Héctor Iván
- ORCID
- Venue
- European Journal of Investigation in Health, Psychology and Education
- Publisher
- MDPI AG
- Published
- 2025-08-07
- Volume
- 15
- Issue
- 8
- Pages
- 152
- ISSN
- 2174-8144 (ISSN-L)
- 2254-9625
- PMC
- PMC12385505
- OpenAlex
- W4413122463
- Cited by
- 18
- References
- 26
- Citations by year
- 2026: 17 · 2025: 1
- FWCI
- 4.33
- Type
- journal article
- Language
- en
- Open access
- gold
- doi.org
- Licence
- Locations
- European Journal of Investigation in Health Psychology and Education (publishedVersion, cc-by)
- Preprints.org (acceptedVersion, cc-by)
- Europe PMC (PubMed Central) (publishedVersion, cc-by)
- PubMed Central (publishedVersion, cc-by)
- PubMed (publishedVersion)
- DOAJ (DOAJ: Directory of Open Access Journals) (submittedVersion, cc-by-sa)
- Funders
- Consejo Mexiquense de Ciencia y Tecnología (COMECYT) (FICDTEM-2023-131, PAPIIT IA201725, PAPIME 203825, PAPIIT IN201724)
- Universidad Nacional Autónoma de México (UNAM) (FICDTEM-2023-131, PAPIIT IA201725, PAPIME 203825, PAPIIT IN201724)
- Topics
- Health Sciences › Medicine › Health Informatics › Artificial Intelligence in Healthcare and Education
- Social Sciences › Education › Innovations in Medical Education
- Social Sciences › Education › Simulation-Based Education in Healthcare
- Keywords
- diagnosis communication, type 2 diabetes, generative AI, medical students, ChatGPT, GPT-4o, empathy, digital self-efficacy, learner profiles, natural language feedback, standardized patients, communication skills training
About these checks
Registry, retraction, Cites and statistics results are computed, not judged, with one exception: a printed reference that no index lists is read once by a model before it counts as a citation error. Claims are extracted by a model and kept only when their quote appears verbatim in the text; each cited source is then checked, with a model’s help, for whether it says what the claim relies on. Those verdicts can be wrong — read the claim’s quote and the cited source before relying on one.
The claim verdicts this report counts are experimental: their accuracy is not yet measured.
A language model drew the claims from the paper on 2026-10-05, under version 3 of the claim definition (model deepseek-v4.1-flash, prompt extract-v3).
A second model labelled each claim on 2026-10-05 (model jev-1.13-20260917, definition revision gold-guideline-v0.2).
Cited sources are checked with a language model’s help (gpt-6-sol).
Statistics and arithmetic are recomputed, not judged.
Confidence bands are shown only for fields calibrated on our annotated test set. None is calibrated yet, so no band is shown.
What counts as a claim ›How we measure confidence ›How we check this ›
Are you an author, or do you see a problem with this page? Request a review
How to cite
Cite CoChat for the checks on this page, and the paper for its own findings.
- This page
- CoChat. (2026). Citation check: DIALOGUE: A Generative AI-Based Pre–Post Simulation Study to Enhance Diagnostic Communication in Medical Students Through Virtual Type 2 Diabetes Scenarios. https://app.cochat.ai/papers/10.3390/ejihpe15080152
- The paper
- Suárez-García, R. X., Chavez-Castañeda, Q., Orrico-Pérez, R., Valencia-Marin, S., Castañeda-Ramírez, A. E., Quiñones-Lara, E., Ramos-Cortés, C. A., Gaytán-Gómez, A. M., Cortés-Rodríguez, J., Jarquín-Ramírez, J., Aguilar-Marchand, N. G., Valdés-Hernández, G., Campos-Martínez, T. E., Vilches-Flores, A., Leon-Cabrera, S., Méndez-Cruz, A. R., Jay-Jímenez, B. O., & Saldívar-Cerón, H. I. (2025). DIALOGUE: A Generative AI-Based Pre–Post Simulation Study to Enhance Diagnostic Communication in Medical Students Through Virtual Type 2 Diabetes Scenarios. European Journal of Investigation in Health, Psychology and Education. https://doi.org/10.3390/ejihpe15080152
Data sources
Bibliographic data: Semantic Scholar, OpenAlex, Crossref.
Contains information from the Semantic Scholar Academic Graph Datasets, made available under the ODC Attribution License (ODC-BY 1.0).
Semantic Scholar’s data is described in: Kinney, R., et al. (2023). The Semantic Scholar Open Data Platform. arXiv:2301.10140.
