

Ensemble Gradient Boosted Tree for SoH Estimation Based on Diagnostic Features
Open accessThe DOI matches its Crossref record; 32 of the 33 references it cites were found in a registry or an index.
Abstract
The success of electric vehicles (EVs) depends principally on their energy storage system. Lithium-ion batteries currently feature the ideal properties to fulfil the wide range of prerequisites specific to electric vehicles. Meanwhile, the precise estimation of batteries’ state of health (SoH) should be available to provide the optimal performance of EVs. This study attempts to propose a precise, real-time method to estimate lithium-ion state of health when it operates in a realistic driving condition in the presence of dynamic stress factors. To this end, a real-life driving profile was simulated based on highly dynamic worldwide harmonized light vehicle test cycle load profiles. Afterward, various features will be extracted from voltage data and they will be scored based on prognostic metrics to select diagnostic features which can conveniently identify battery degradation. Lastly, an ensemble learning model was developed to capture the correlation of diagnostic features and battery’s state of health (SoH). The result illustrates that the proposed method has the potential to estimate the SoH of battery cells aged under a distinct depth of discharge and current profile with a maximum error of 1%. This confirms the robustness of the developed approach. The proposed method has the capability of implementing in battery management systems due to many reasons; firstly, it is tested and validated based on the data which are equal to the real-life driving operation of an electric vehicle. Secondly, it has high accuracy and precision, and a low computational cost. Finally, it can estimate the SoH of battery cells with different aging patterns.
Overview
The claims and statistics of this paper haven’t been checked yet.
Free: it reads the open-access text and checks the first 5 claims that cite a source we can check. Create a free account to check every claim.
Integrity signals
Registry
Cites
Statistics
Figures
Verification
Claims the paper makes
The claims and statistics of this paper haven’t been checked yet.
Free: it reads the open-access text and checks the first 5 claims that cite a source we can check. Create a free account to check every claim.
Claims other papers make about this one
Each is checked against this paper’s own text: does it say what the citing paper says it does?
The cited source doesn’t support the claim as written.
In the citing paper
“SOH estimation methods can be broadly classified into two categories: direct measurement and indirect estimation [51,97-99].”
From The State of Health Estimation of Lithium-Ion Batteries: A Review of Health Indicators, Estimation Methods, Development Trends and Challenges (2025) · cites this paper as [97]
Checked by a reasoning model — may be wrong.
Experimental — accuracy not yet measured
Self-check
Percentages, sums and reported differences re-computed from the paper’s own numbers.
The self-check needs the paper’s full text.
Citations
Cites
The Elements of Statistical Learning
Hastie, T., Tibshirani, R., & Friedman, J. (2009) · Springer Series in Statistics · doi:10.1007/978-0-387-84858-7 · Cited by 25,970
Sagi, O., & Rokach, L. (2018) · WIREs Data Mining and Knowledge Discovery · doi:10.1002/widm.1249 · Cited by 3,103 · cited 2×
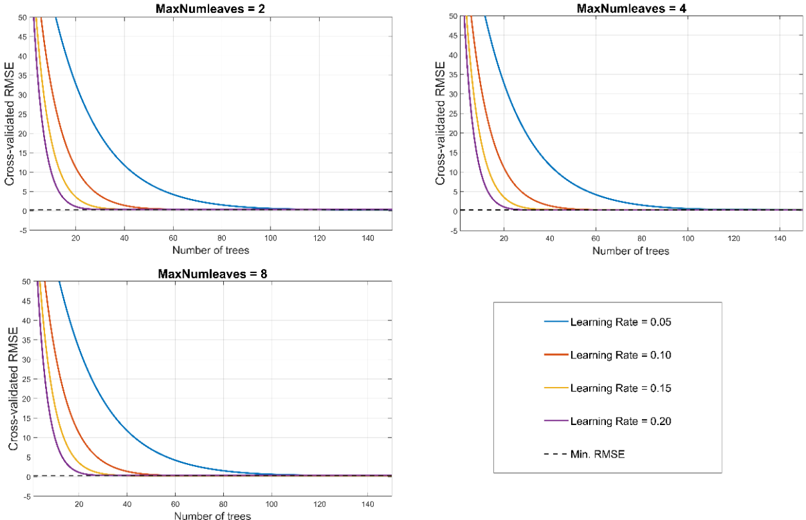
“There are three main hyperparameters that should be specified initially: (1) the number of trees (iterations), (2) the number of leaves of decision tree, and (3) the learning rate of algorithm (α) which is range between 0 to 1 [23].”
BackgroundMethodDong, X., Yu, Z., Cao, W., Shi, Y., & Ma, Q. (2020) · Frontiers of Computer Science · doi:10.1007/s11704-019-8208-z · Cited by 1,928 · cited 1×
“The output of an ensemble algorithm is achieved by merging the base learners’ outputs [22].”
MethodData-driven health estimation and lifetime prediction of lithium-ion batteries: A review
Li, Y., Liu, K., Foley, A. M., Zülke, A., Berecibar, M., Nanini-Maury, E., Van Mierlo, J., & Hoster, H. E. (2019) · Renewable and Sustainable Energy Reviews · doi:10.1016/j.rser.2019.109254 · Cited by 1,193 · cited 1×
“A recent study has thoroughly reviewed the data-driven methods for SoH estimation [8].”
MethodSelf-citationCritical review of state of health estimation methods of Li-ion batteries for real applications
Berecibar, M., Gandiaga, I., Villarreal, I., Omar, N., Van Mierlo, J., & Van den Bossche, P. (2016) · Renewable and Sustainable Energy Reviews · doi:10.1016/j.rser.2015.11.042 · Cited by 1,126 · cited 1×
“A 100% percent value of SoH means the battery is fresh while decreasing SoH to 80% the battery cannot satisfy the requirements of electric vehicles (EVs) [3].”
BackgroundSelf-citationXiong, R., Li, L., & Tian, J. (2018) · Journal of Power Sources · doi:10.1016/j.jpowsour.2018.10.019 · Cited by 1,017 · cited 1×
“Data-driven SoH estimation methods require an extensive volume of historical data to track battery degradation, nevertheless, they have gained much importance in recent years due to their simplicity and being model-free [7].”
BackgroundHow, D. N. T., Hannan, M. A., Hossain Lipu, M. S., & Ker, P. J. (2019) · IEEE Access · doi:10.1109/access.2019.2942213 · Cited by 812 · cited 1×
“Model-based methods are solid however, they require comprehensive domain knowledge and their development is time-consuming and complex [6].”
BackgroundEnsemble Machine Learning: Methods and Applications
(2012) · doi:10.1007/978-1-4419-9326-7 · Cited by 746
Weng, C., Cui, Y., Sun, J., & Peng, H. (2013) · Journal of Power Sources · doi:10.1016/j.jpowsour.2013.02.012 · Cited by 561 · cited 1×
“[15] investigated IC curves to extract the feature which are able to predict capacity fade.”
BackgroundLi, Y., Abdel-Monem, M., Gopalakrishnan, R., Berecibar, M., Nanini-Maury, E., Omar, N., van den Bossche, P., & Van Mierlo, J. (2018) · Journal of Power Sources · doi:10.1016/j.jpowsour.2017.10.092 · Cited by 531 · cited 1×
“[14] established a correlation between SoH and features such as peaks and valleys detected on IC curves.”
BackgroundSelf-citation
Research works printed but not linked: 1
- Zhang, C., and Ma, Y. (1996). Ensemble Machine Learning, Springer.
Cited by
Sui, X., He, S., Vilsen, S. B., Meng, J., Teodorescu, R., & Stroe, D.-I. (2021) · Applied Energy · doi:10.1016/j.apenergy.2021.117346 · Cited by 409
Deep neural network battery charging curve prediction using 30 points collected in 10 min
Tian, J., Xiong, R., Shen, W., Lu, J., & Yang, X.-G. (2021) · Joule · doi:10.1016/j.joule.2021.05.012 · Cited by 340
Rauf, H., Khalid, M., & Arshad, N. (2022) · Renewable and Sustainable Energy Reviews · doi:10.1016/j.rser.2021.111903 · Cited by 326
Manoharan, A., Begam, K. M., Aparow, V. R., & Sooriamoorthy, D. (2022) · Journal of Energy Storage · doi:10.1016/j.est.2022.105384 · Cited by 293
Khaleghi, S., Hosen, M. S., Karimi, D., Behi, H., Beheshti, S. H., Van Mierlo, J., & Berecibar, M. (2022) · Applied Energy · doi:10.1016/j.apenergy.2021.118348 · Cited by 199
Self-citation
Metadata
- Authors
- Khaleghi, S., Firouz, Y., Berecibar, M., Mierlo, J. V., & Bossche, P. V. D.
- Affiliations
- Vrije Universiteit Brussel (BE)
- Corresponding author
- Khaleghi, Sahar
- Venue
- Energies
- Publisher
- MDPI AG
- Published
- 2020-03-09
- Volume
- 13
- Issue
- 5
- Pages
- 1262
- ISSN
- 1996-1073 (ISSN-L)
- OpenAlex
- W3009397746
- Cited by
- 44
- References
- 33
- Citations by year
- 2026: 5 · 2025: 8 · 2024: 9 · 2023: 6 · 2022: 2 · 2021: 9 · 2020: 5
- FWCI
- 2.03
- Type
- journal article
- Language
- en
- Open access
- gold
- doi.org
- Licence
- Locations
- Energies (publishedVersion, cc-by)
- RePEc: Research Papers in Economics (submittedVersion)
- DOAJ (DOAJ: Directory of Open Access Journals) (submittedVersion, cc-by-sa)
- VUBIR (Vrije Universiteit Brussel) (submittedVersion)
- Funders
- Flanders Make
- Vlaamse regering
- Topics
- Physical Sciences › Engineering › Automotive Engineering › Battery Modeling and Management
- Physical Sciences › Engineering › Electrical and Electronic Engineering › Advancements in Battery Materials
- Physical Sciences › Engineering › Automotive Engineering › Electric and Hybrid Vehicle Technologies
- Keywords
- state of health estimation, lithium-ion batteries, electric vehicles, battery degradation, battery management systems, driving cycle simulation, depth of discharge
About these checks
Registry, retraction, Cites and statistics results are computed, not judged, with one exception: a printed reference that no index lists is read once by a model before it counts as a citation error. Claims are extracted by a model and kept only when their quote appears verbatim in the text; each cited source is then checked, with a model’s help, for whether it says what the claim relies on. Those verdicts can be wrong — read the claim’s quote and the cited source before relying on one.
Statistics and arithmetic are recomputed, not judged.
Confidence bands are shown only for fields calibrated on our annotated test set. None is calibrated yet, so no band is shown.
What counts as a claim ›How we measure confidence ›How we check this ›
Are you an author, or do you see a problem with this page? Request a review
How to cite
Cite CoChat for the checks on this page, and the paper for its own findings.
- This page
- CoChat. (2026). Citation check: Ensemble Gradient Boosted Tree for SoH Estimation Based on Diagnostic Features. https://app.cochat.ai/papers/10.3390/en13051262
- The paper
- Khaleghi, S., Firouz, Y., Berecibar, M., Mierlo, J. V., & Bossche, P. V. D. (2020). Ensemble Gradient Boosted Tree for SoH Estimation Based on Diagnostic Features. Energies. https://doi.org/10.3390/en13051262
Data sources
Bibliographic data: Semantic Scholar, OpenAlex, Crossref.
Contains information from the Semantic Scholar Academic Graph Datasets, made available under the ODC Attribution License (ODC-BY 1.0).
Semantic Scholar’s data is described in: Kinney, R., et al. (2023). The Semantic Scholar Open Data Platform. arXiv:2301.10140.
