

The DOI matches its Crossref record; 2 of the 2 references it cites were found in a registry or an index.
Multi-Proxy Characterisation of the Storegga Tsunami and Its Impact on the Early Holocene Landscapes of the Southern North Sea
Published version of a preprint
Abstract
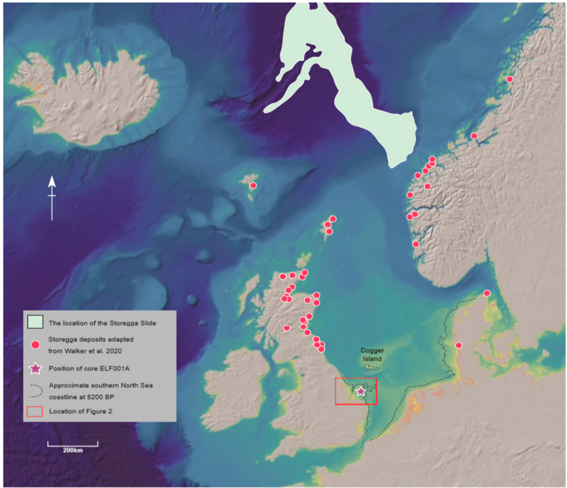
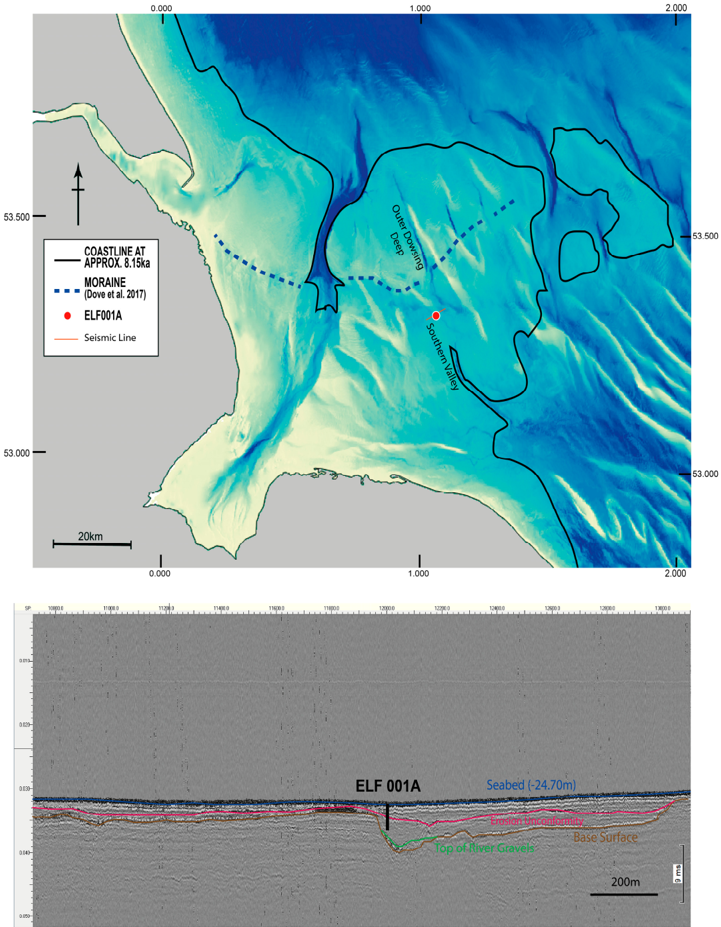
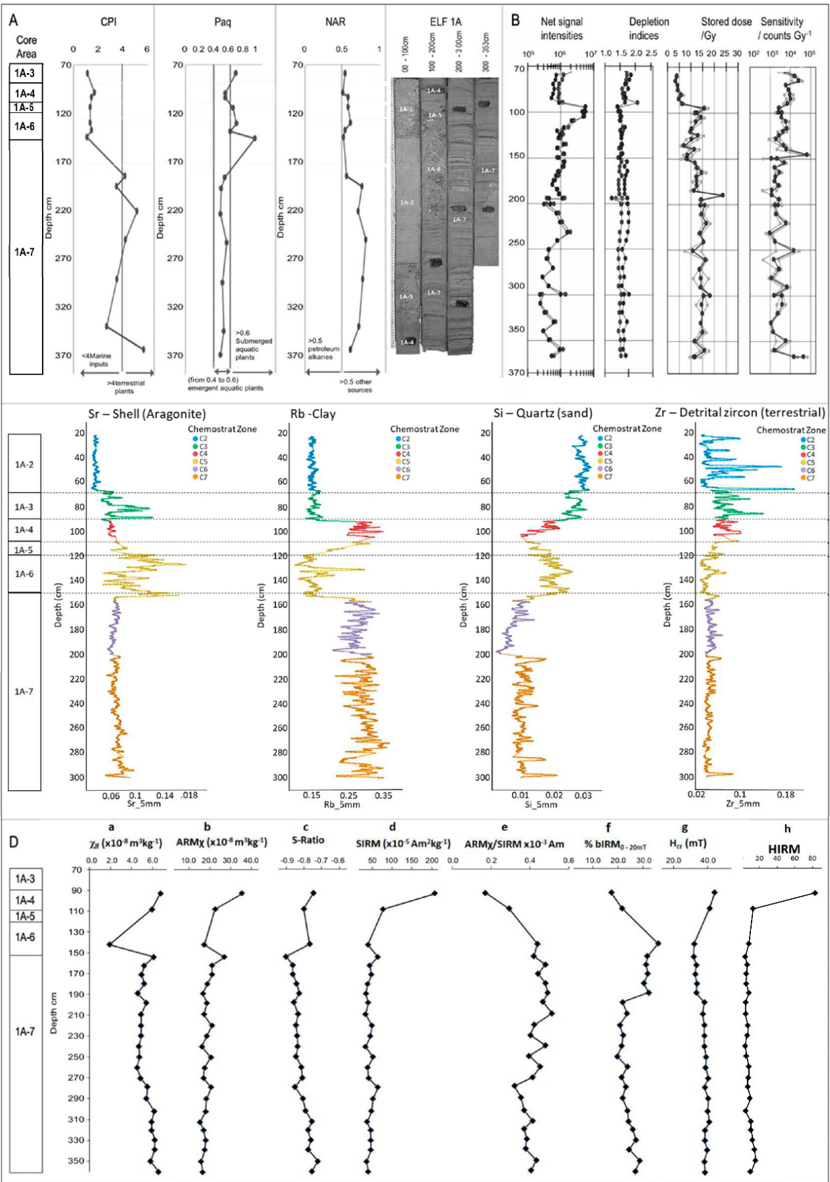
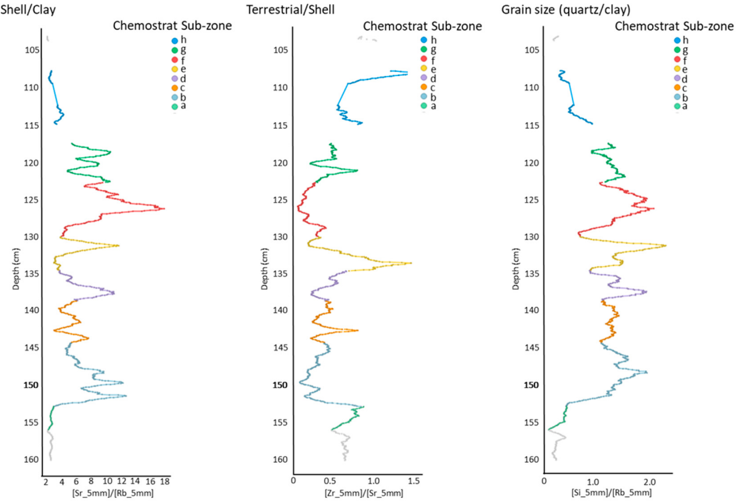
Doggerland was a landmass occupying an area currently covered by the North Sea until marine inundation took place during the mid-Holocene, ultimately separating the British landmass from the rest of Europe. The Storegga Event, which triggered a tsunami reflected in sediment deposits in the northern North Sea, northeast coastlines of the British Isles and across the North Atlantic, was a major event during this transgressive phase. The spatial extent of the Storegga tsunami however remains unconfirmed as, to date, no direct evidence for the event has been recovered from the southern North Sea. We present evidence of a tsunami deposit in the southern North Sea at the head of a palaeo-river system that has been identified using seismic survey. The evidence, based on lithostratigraphy, geochemical signatures, macro and microfossils and sedimentary ancient DNA (sedaDNA), supported by optical stimulated luminescence (OSL) and radiocarbon dating, suggests that these deposits were a result of the tsunami. Seismic identification of this stratum and analysis of adjacent cores showed diminished traces of the tsunami which was largely removed by subsequent erosional processes. Our results confirm previous modelling of the impact of the tsunami within this area of the southern North Sea, and also indicate that these effects were temporary, localized, and mitigated by the dense woodland and topography of the area. We conclude that clear physical remnants of the wave in these areas are likely to be restricted to now buried, palaeo-inland basins and incised river valley systems.
Overview
The claims and statistics of this paper haven’t been checked yet.
Run the check — free, no account needed. It reads the open-access text and checks the sources it cites.
Integrity signals
Registry
Cites
Statistics
Figures
Verification
Claims the paper makes
The claims and statistics of this paper haven’t been checked yet.
Run the check — free, no account needed. It reads the open-access text and checks the sources it cites.
Claims other papers make about this one
Each is checked against this paper’s own text: does it say what the citing paper says it does?
The source backs part of the claim, not all of it — or backs it for a different population, condition or comparison.
In the citing paper
“The extent to which quantitative assessments can be obtained is currently unknown, although new biomass proxies aim at this objective 136 .”
From Ancient DNA analysis (2021) · cites this paper as [136]
Experimental — accuracy not yet measured
Self-check
Percentages, sums and reported differences re-computed from the paper’s own numbers.
The self-check needs the paper’s full text.
Citations
Cites
mapDamage2.0: fast approximate Bayesian estimates of ancient DNA damage parameters
Jónsson, H., Ginolhac, A., Schubert, M., Johnson, P. L. F., & Orlando, L. (2013) · Bioinformatics · doi:10.1093/bioinformatics/btt193 · Cited by 1,669
Double indexing overcomes inaccuracies in multiplex sequencing on the Illumina platform
Kircher, M., Sawyer, S., & Meyer, M. (2012) · Nucleic Acids Research · doi:10.1093/nar/gkr771 · Cited by 1,106
Research works printed but not linked: 26
- Coles, 1998, Doggerland: A speculative survey, Proc. Prehist. Soc., 64, 45, 10.1017/S0079497X00002176 · DOI
- Weninger, 2008, The catastrophic final flooding of Doggerland by the Storegga Slide tsunami, Doc. Praehist., 35, 1, 10.4312/dp.35.1 · DOI
- Waddington, 2017, Resilience or wipe out? Evaluating the convergent impacts of the 8.2 ka event and Storegga tsunami on the Mesolithic of northeast Britain, J. Archaeol. Sci. Rep., 14, 692
- Bondevik, 1997, The Storegga tsunami along the Norwegian coast, its age and runup, Boreas, 26, 29, 10.1111/j.1502-3885.1997.tb00649.x · DOI
- Fruergaard, 2015, Tsunami propagation over a wide, shallow continental shelf caused by the Storegga slide, southeastern North Sea, Denmark, Geology, 43, 1047
- Hill, J., Avdis, A., Mouradian, S., Collins, G.S., and Piggott, M. (2017). Was Doggerland catastrophically flooded by the Mesolithic Storegga tsunami?. arXiv.
- Bondevik, 2005, The Storegga Slide tsunami—Comparing field observations with numerical simulations, Mar. Pet. Geol., 22, 195, 10.1016/j.marpetgeo.2004.10.003 · DOI
- Walker, J., Gaffney, V., Fitch, S., Muru, M., Fraser, A., Bates, M., and Bates, R. (2020). A Great Wave: The Storegga Tsunami and the end of Doggerland?. Antiquity, in press. · DOI
- Dawson, 2007, Tsunami deposits in the geological record, Sediment. Geol., 200, 166, 10.1016/j.sedgeo.2007.01.002 · DOI
- Fujiwara, 2007, Identification of tsunami deposits considering the tsunami waveform: An example of subaqueous tsunami deposits in Holocene shallow bay on southern Boso Peninsula, Central Japan, Sediment. Geol., 200, 295, 10.1016/j.sedgeo.2007.01.009 · DOI
- Nanayama, 2000, Sedimentary differences between the 1993 Hokkaido-nansei-oki tsunami and the 1959 Miyakojima typhoon at Taisea, southwestern Hokkaido, northern Japan, Sediment. Geol., 135, 255, 10.1016/S0037-0738(00)00076-2 · DOI
- Kortekaas, 2007, Distinguishing tsunami and storm surge: An example from Martinhal, SW Portugal, Sediment. Geol., 200, 208, 10.1016/j.sedgeo.2007.01.004 · DOI
- Goff, 2002, Sedimentary differences between the 2002 Easter storm and the 15th century Okoropunga tsunami, southeastern North Island, New Zealand, Mar. Geol., 204, 235, 10.1016/S0025-3227(03)00352-9 · DOI
- Morton, 2007, Physical criteria for distinguishing sandy tsunami and storm deposits using modern examples, Sediment. Geol., 200, 184, 10.1016/j.sedgeo.2007.01.003 · DOI
- Riou, 2020, Backwash sediment record of the 2009 South Pacific Tsunami and 1960 Great Chilean Earthquake Tsunami, Nat. Sci. Rep., 10, 1
- Peters, R., and Jaffe, B. (2010). Identification of Tsunami Deposits in the Geologic Record; Developing Criteria Using Recent Tsunami Deposits, Pacific Coastal and Marine Science Center. U.S. Geological Survey Open-File Report 2010-1239. · DOI
- Dawson, 2000, Tsunami deposits, Pure Appl. Geophys., 157, 875, 10.1007/s000240050010 · DOI
- Bradley, 2011, An improved glacial isostatic adjustment model for the British Isles, J. Quat. Sci., 26, 541, 10.1002/jqs.1481 · DOI
- Dove, 2017, Phased occupation and retreat of the last British-Irish Ice Sheet in the southern North Sea; geomorphic and seismostratigraphic evidence of a dynamic ice lobe, Quat. Sci. Rev., 163, 114, 10.1016/j.quascirev.2017.03.006 · DOI
- Fortin, 2012, Destructive and non-destructive density determination: Method comparison and evaluationfrom the Laguna Potrok Aike sedimentary record, Quat. Sci. Rev., 71, 147, 10.1016/j.quascirev.2012.08.024 · DOI
- Shinozaki, 2017, Applications of geochemistry in tsunami research: A review, Earth-Sci. Rev., 165, 203, 10.1016/j.earscirev.2016.12.003 · DOI
- Kistler, 2017, A new model for ancient DNA decay based on paleogenomic meta-analysis, Nucleic Acids Res., 45, 6310, 10.1093/nar/gkx361 · DOI
- Willerslev, 2007, Ancient Biomolecules from Deep Ice Cores Reveal a Forested Southern Greenland, Science, 317, 111, 10.1126/science.1141758 · DOI · Paper page
- Wagner, 2006, First indication of Storegga tsunami deposits from East Greenland, J. Quat. Sci., 22, 321, 10.1002/jqs.1064 · DOI
- Didenkulova, 2010, Runup of tsunami waves in U-shaped bays, Pure Appl. Geophys., 168, 1239, 10.1007/s00024-010-0232-8 · DOI
- Bondevik, 1997, Tsunami sedimentary facies deposited by the Storegga tsunami in shallow marine basins and coastal lakes, western Norway, Sedimentology, 44, 1115, 10.1046/j.1365-3091.1997.d01-63.x · DOI
Cited by
Sorted by citations
Orlando, L., Allaby, R., Skoglund, P., Der Sarkissian, C., Stockhammer, P. W., Ávila-Arcos, M. C., Fu, Q., Krause, J., Willerslev, E., Stone, A. C., et al. (2021) · Nature Reviews Methods Primers · doi:10.1038/s43586-020-00011-0 · Cited by 411
Self-citation
Metadata
- Authors
- Gaffney, V., Fitch, S., Bates, M., Ware, R. L., Kinnaird, T., Gearey, B., Hill, T., Telford, R., Batt, C., Stern, B., Whittaker, J., Davies, S., Sharada, M. B., Everett, R., Cribdon, R., Kistler, L., Harris, S., Kearney, K., Walker, J., Muru, M., Hamilton, D., Law, M., Finlay, A., Bates, R., & Allaby, R. G.
- Affiliations
- School of Archaeological and Forensic Sciences, University of Bradford, Bradford BD7 1DP, UK
- Faculty of Humanities and Performing Arts, University of Wales Trinity Saint David, Lampeter, Ceredigion, Wales SA48 7ED, UK
- School of Life Sciences, Gibbet Hill Campus, University of Warwick, Coventry CV4 7AL, UK
- School of Earth and Environmental Sciences, University of St Andrews, St Andrews KY16 9AL, UK
- Department of Archaeology, University College Cork, T12 CY82 Cork, Ireland
- Department of Earth Sciences, Natural History Museum, London SW7 5BD, UK
- Geography and Earth Sciences, Aberystwyth University, Aberystwyth SY23 3FL, UK
- Department of Anthropology, National Museum of Natural History, Smithsonian Institution, Washington, DC 20560, USA
- SUERC Radiocarbon Dating Laboratory, Scottish Enterprise Park, East Kilbride G75 0QF, UK
- School of Sciences, Bath Spa University, Bath BA2 9BN, UK
- Chemostrat Ltd., 1 Ravenscroft Court, Buttington Cross Enterprise Park, Welshpool, Powys SY21 8SL, UK
- ORCID
- Venue
- Geosciences
- Publisher
- MDPI AG
- Published
- 2020-07-15
- Volume
- 10
- Issue
- 7
- Pages
- 270
- ISSN
- 2076-3263
- Cited by
- 33
- References
- 2
- Language
- en
- Funders
- European Research Council (670518)
About these checks
Registry, retraction, Cites and statistics results are computed, not judged, with one exception: a printed reference that no index lists is read once by a model before it counts as a citation error. Claims are extracted by a model and kept only when their quote appears verbatim in the text; each cited source is then checked, with a model’s help, for whether it says what the claim relies on. Those verdicts can be wrong — read the claim’s quote and the cited source before relying on one.
Statistics and arithmetic are recomputed, not judged.
Confidence bands are shown only for fields calibrated on our annotated test set. None is calibrated yet, so no band is shown.
What counts as a claim ›How we measure confidence ›How we check this ›
Are you an author, or do you see a problem with this page? Request a review
