

The DOI matches its Crossref record; 42 of the 42 references it cites were found in a registry or an index.
Water-Borne Diseases and Extreme Weather Events in Cambodia: Review of Impacts and Implications of Climate Change
Open accessAbstract
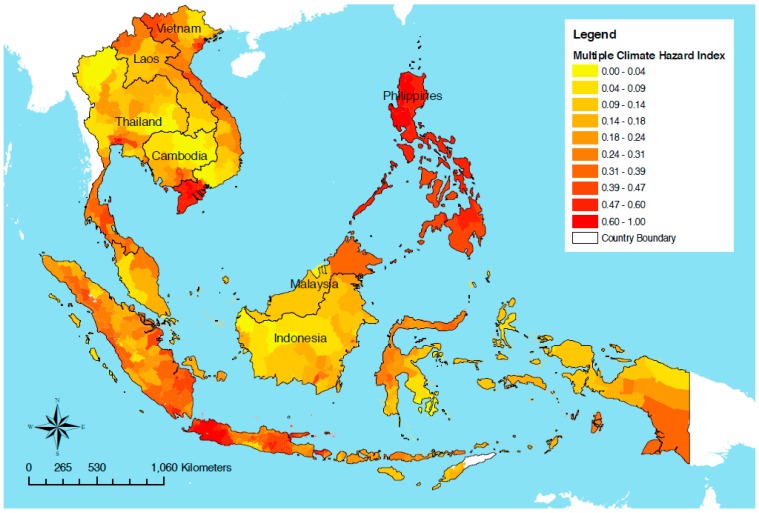
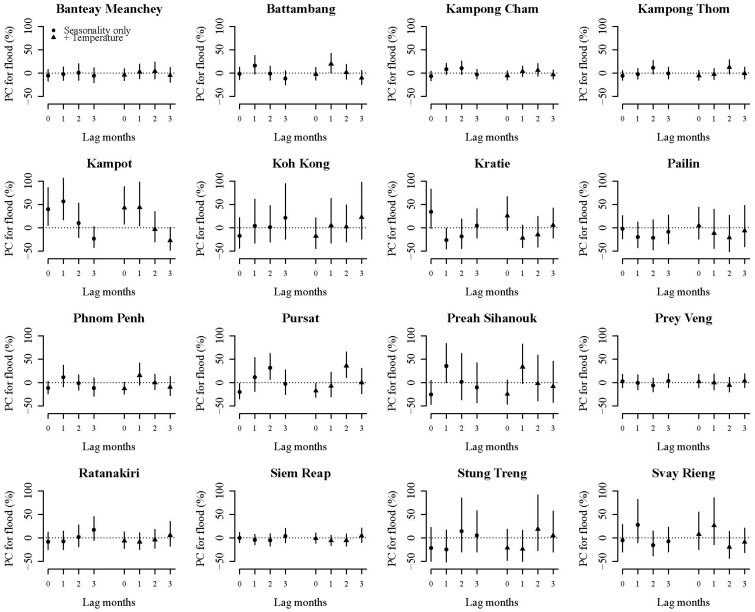
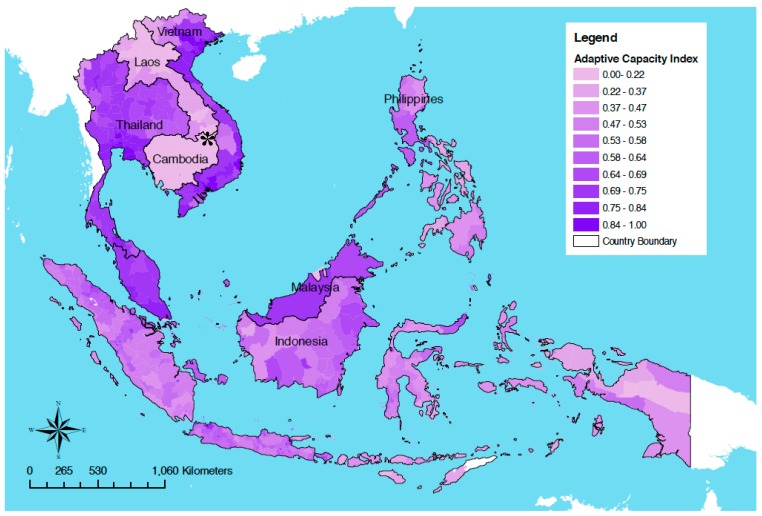
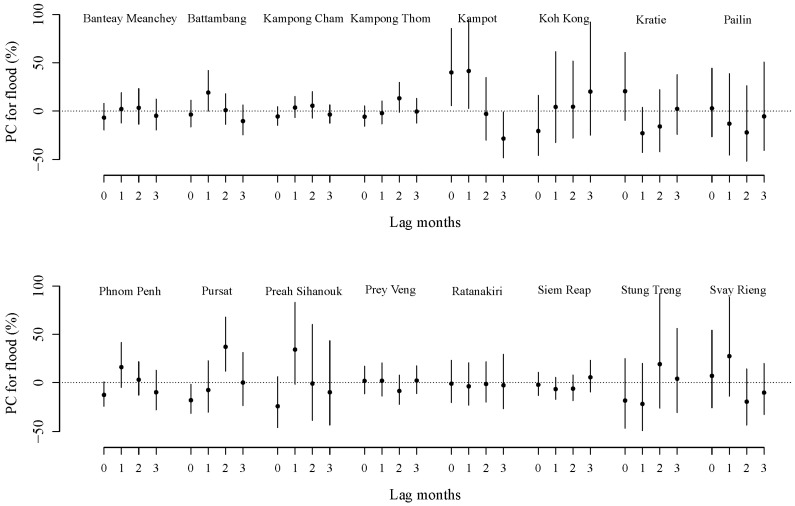
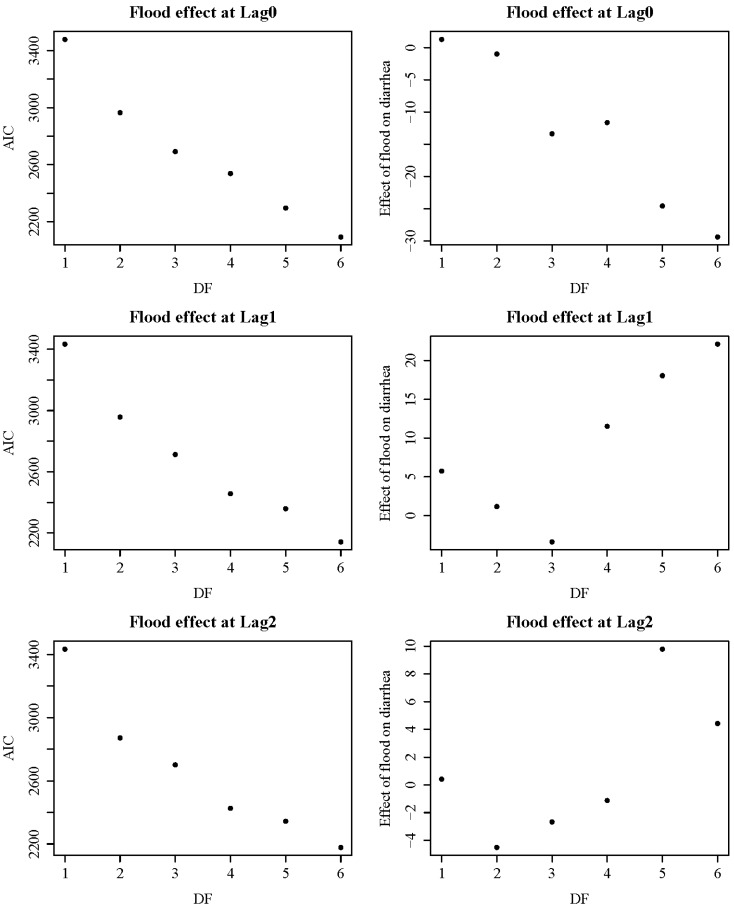
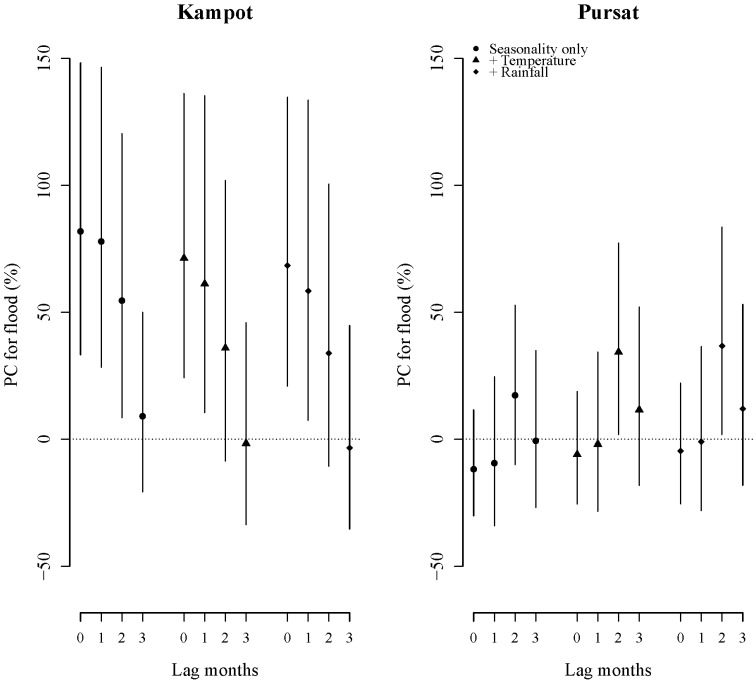
Cambodia is prone to extreme weather events, especially floods, droughts and typhoons. Climate change is predicted to increase the frequency and intensity of such events. The Cambodian population is highly vulnerable to the impacts of these events due to poverty; malnutrition; agricultural dependence; settlements in flood-prone areas, and public health, governance and technological limitations. Yet little is known about the health impacts of extreme weather events in Cambodia. Given the extremely low adaptive capacity of the population, this is a crucial knowledge gap. A literature review of the health impacts of floods, droughts and typhoons in Cambodia was conducted, with regional and global information reviewed where Cambodia-specific literature was lacking. Water-borne diseases are of particular concern in Cambodia, in the face of extreme weather events and climate change, due to, inter alia, a high pre-existing burden of diseases such as diarrhoeal illness and a lack of improved sanitation infrastructure in rural areas. A time-series analysis under quasi-Poisson distribution was used to evaluate the association between floods and diarrhoeal disease incidence in Cambodian children between 2001 and 2012 in 16 Cambodian provinces. Floods were significantly associated with increased diarrhoeal disease in two provinces, while the analysis conducted suggested a possible protective effect from toilets and piped water. Addressing the specific, local pre-existing vulnerabilities is vital to promoting population health resilience and strengthening adaptive capacity to extreme weather events and climate change in Cambodia.
Overview
The claims and statistics of this paper haven’t been checked yet.
Run the check — free, no account needed. It reads the open-access text and checks the sources it cites.
Integrity signals
Registry
Cites
Statistics
Figures
Verification
Claims the paper makes
The claims and statistics of this paper haven’t been checked yet.
Run the check — free, no account needed. It reads the open-access text and checks the sources it cites.
Claims other papers make about this one
Each is checked against this paper’s own text: does it say what the citing paper says it does?
In the citing paper
“Flood events and climate change increase the risk of water-borne-diseases [128], as they create isolated water bodies that are out of reach of fish, the natural predators of mosquito larvae.”
From Urban Stream and Wetland Restoration in the Global South—A DPSIR Analysis (2019) · cites this paper as [128]
Self-check
Percentages, sums and reported differences re-computed from the paper’s own numbers.
The self-check needs the paper’s full text.
Citations
Cites
Brown, R. A., Hastie, T. J., & Tibshirani, R. J. (1991) · Biometrics · doi:10.2307/2532174 · Cited by 8,263
Liu, L., Johnson, H. L., Cousens, S., Perin, J., Scott, S., Lawn, J. E., Rudan, I., Campbell, H., Cibulskis, R., Li, M., et al. (2012) · The Lancet · doi:10.1016/s0140-6736(12)60560-1 · Cited by 3,934
Hastie, T. J., & Tibshirani, R. J. (2014) · Wiley StatsRef: Statistics Reference Online · doi:10.1002/9781118445112.stat03141 · Cited by 3,156
Global, regional, and national causes of child mortality in 2008: a systematic analysis
Black, R. E., Cousens, S. N., Johnson, H. L., Lawn, J. E., Rudan, I., Bassani, D. G., Jha, P., Campbell, H. J., Walker, C. L. F., Cibulskis, R. E., et al. (2010) · The Lancet · doi:10.1016/s0140-6736(10)60549-1 · Cited by 3,062
Climate change and human health: Impacts, vulnerability and public health
Haines, A., Kovats, R. S., Campbell-Lendrum, D., & Corvalan, C. (2006) · Public Health · doi:10.1016/j.puhe.2006.01.002 · Cited by 1,041
Global Health Impacts of Floods: Epidemiologic Evidence
Ahern, M., Kovats, S. R., Wilkinson, P., Few, R., & Matthies, F. (2005) · Epidemiologic Reviews · doi:10.1093/epirev/mxi004 · Cited by 859
Floods and human health: A systematic review
Alderman, K. B., Turner, L., & Tong, S. (2012) · Environment International · doi:10.1016/j.envint.2012.06.003 · Cited by 849
(2014) · University of Canberra Research Portal · Cited by 538
Extreme water-related weather events and waterborne disease
Cann, K., Thomas, D. R., Salmon, R. L., Wyn-Jones, A. P., & Kay, D. (2012) · Epidemiology and Infection · doi:10.1017/s0950268812001653 · Cited by 486
Climate Change Vulnerability Mapping for Southeast AsiaPreprint
Yusuf, A. A., & Francisco, H. A. (2009) · RePEc: Research Papers in Economics · Cited by 284
京都大学グローバルCOEプログラムアジア・メガシティの人間安全保障工学拠点 (2010) · Medical Entomology and Zoology · Cited by 282
Intensity of Rainfall and Severity of Melioidosis, Australia
Currie, B. J., & Jacups, S. P. (2003) · Emerging infectious diseases · doi:10.3201/eid0912.020750 · Cited by 272
Melioidosis as an emerging global problem
Dance, D. A. B. (2000) · Acta Tropica · doi:10.1016/s0001-706x(99)00059-5 · Cited by 243
DIARRHEAL EPIDEMICS IN DHAKA, BANGLADESH, DURING THREE CONSECUTIVE FLOODS: 1988, 1998, AND 2004
SCHWARTZ, B. S., Harris, J. B., Khan, A. I., LaRocque, R. C., Sack, D. A., MALEK, M. A., Faruque, A. S. G., Qadri, F., Calderwood, S. B., Luby, S. P., et al. (2006) · American Journal of Tropical Medicine and Hygiene · doi:10.4269/ajtmh.2006.74.1067 · Cited by 227
Rapid tests for diagnosis of leptospirosis: Current tools and emerging technologies
Picardeau, M., Bertherat, E., Jancloes, M., nikolaos, S. A., Durski, K. N., & Hartskeerl, R. A. (2013) · Diagnostic Microbiology and Infectious Disease · doi:10.1016/j.diagmicrobio.2013.09.012 · Cited by 203
Infectious diseases of severe weather-related and flood-related natural disasters
Ivers, L. C., & Ryan, E. T. (2006) · Current Opinion in Infectious Diseases · doi:10.1097/01.qco.0000244044.85393.9e · Cited by 203
Post-flood — Infectious Diseases in Mozambique
Kondo, H., Seo, N., Yasuda, T., Hasizume, M., Koido, Y., Ninomiya, N., & Yamamoto, Y. (2002) · Prehospital and Disaster Medicine · doi:10.1017/s1049023x00000340 · Cited by 179
EnterotoxigenicEscherichia coliandVibrio choleraeDiarrhea, Bangladesh, 2004
Qadri, F., Khan, A. I., Faruque, A. S. G., Begum, Y. A., Chowdhury, F., Nair, G. B., Salam, M. A., Sack, D. A., & Svennerholm, A. (2005) · Emerging infectious diseases · doi:10.3201/eid1107.041266 · Cited by 162
Warming Oceans, Phytoplankton, and River Discharge: Implications for Cholera Outbreaks
Jutla, A., Akanda, A. S., Griffiths, J. K., Colwell, R. R., & Islam, S. (2011) · American Journal of Tropical Medicine and Hygiene · doi:10.4269/ajtmh.2011.11-0181 · Cited by 119
1988 floods in Bangladesh: pattern of illness and causes of death.
Siddique, A., Baqui, A. H., Eusof, A., & Zaman, K. (1991) · PubMed · Cited by 113
McCreesh, N., & Booth, M. (2013) · Trends in Parasitology · doi:10.1016/j.pt.2013.08.007 · Cited by 113
Infectious diseases in the aftermath of monsoon flooding in Pakistan
Baqir, M., Sobani, Z. A., Bhamani, A., Bham, N. S., Abid, S., Farook, J., & Beg, M. A. (2011) · Asian Pacific Journal of Tropical Biomedicine · doi:10.1016/s2221-1691(11)60194-9 · Cited by 102
Etiology of Diarrhea in Young Children and Patterns of Antibiotic Resistance in Cambodia
Meng, C. Y., Smith, B. L., Bodhidatta, L., Richard, S. A., Vansith, K., Thy, B., Srijan, A., Serichantalergs, O., & Mason, C. J. (2010) · The Pediatric Infectious Disease Journal · doi:10.1097/inf.0b013e3181fb6f82 · Cited by 94
Floods in Southeast Asia: A health priority
Torti, J. M. I. (2012) · Journal of Global Health · doi:10.7189/jogh.02.020304 · Cited by 76
The Mekong: A Drought-prone Tropical Environment?
Adamson, P. T., & Bird, J. (2010) · International Journal of Water Resources Development · doi:10.1080/07900627.2010.519632 · Cited by 70
Ding, G., Zhang, Y., Gao, L., Ma, W., Li, X., Liu, J., Liu, Q., & Jiang, B. (2013) · PLoS ONE · doi:10.1371/journal.pone.0065112 · Cited by 69
Climate change and temperature rise: Implications on food- and water-borne diseases
El‐Fadel, M., Ghanimeh, S. A., Maroun, R., & Alameddine, I. (2012) · The Science of The Total Environment · doi:10.1016/j.scitotenv.2012.07.041 · Cited by 68
Leptospira and Rodents in Cambodia: Environmental Determinants of Infection
Ivanova, S., Herbreteau, V., Blasdell, K. R., Chaval, Y., Buchy, P., Guillard, B., & Morand, S. (2012) · American Journal of Tropical Medicine and Hygiene · doi:10.4269/ajtmh.2012.11-0349 · Cited by 63
Gentry-Shields, J., & Bartram, J. (2013) · The Science of The Total Environment · doi:10.1016/j.scitotenv.2013.08.052 · Cited by 49
Kazama, S., Aizawa, T., Watanabe, T., Sarukkalige, R., Gunawardhana, L. N., & Amano, A. (2011) · Sustainability Science · doi:10.1007/s11625-011-0141-5 · Cited by 41
Southeast Asia: an emerging focus for global health
Acuin, J. M., Firestone, R., Htay, T. T., Khor, G. L., Thabrany, H., Saphonn, V., & Wibulpolprasert, S. (2011) · The Lancet · doi:10.1016/s0140-6736(10)61426-2 · Cited by 30
Water and Climate Change in the Lower Mekong Basin: Diagnosis & recommendations for adaptation
Keskinen, M., Chinvanno, S., Kummu, M., Nuorteva, P., Snidvongs, A., Varis, O., & Västilä, K. (2009) · Cited by 24
Floods in southern Africa result in cholera outbreak and displacement
Sidley, P. (2008) · BMJ · doi:10.1136/bmj.39503.700903.db · Cited by 23
UNDP Climate Change Country Profiles: Cambodia
McSweeney, C., New, M., & Lizcano, G. (2006) · University of North Texas Digital Library (University of North Texas) · Cited by 17
The stress of climate change on water management in Cambodia with a focus on rice production
Murphy, T., Irvine, K. N., & Sampson, M. (2013) · Climate and Development · doi:10.1080/17565529.2013.771570 · Cited by 16
Cambodia, O. G. (2008) · Cited by 9
Adaptation to climate change in Asia
Vachani, S., & Usmani, J. (2014) · Edward Elgar Publishing eBooks · doi:10.4337/9781781954737.00006 · Cited by 7
Contextualizing Disaster in Relation to Human Health in Bangladesh
Nahar, P., Alamgir, F., Collins, A., et al. (2010) · Northumbria Research Link (Northumbria University) · doi:10.1605/01.301-0009421162.2010 · Cited by 6
Climate change adaptation in agriculture in Cambodia
Chhinh, N. (2014) · Edward Elgar Publishing eBooks · doi:10.4337/9781781954737.00013 · Cited by 6
Contextualizing Disaster in Relation to Human Health in Bangladesh
Nahar, P., Alamgir, F., Collins, A., & Bhuiya, A. (2010) · Asian Journal of Water Environment and Pollution · doi:10.3233/ajw-2010-7_1_08 · Cited by 6
Cambodia : Post-Ketsana Disaster Needs Assessment
Bank, W. (2010) · doi:10.1596/12498 · Cited by 3
Infectious diseases in the aftermath of monsoon flooding in Pakistan
Maryam, M., Baqir, Zain, Sobani, Amyn, Bhamani, Bham, Sidra, S., Abid, Javeria, J., et al. (2012) · 亚太热带生物医学杂志:英文版 · Cited by 2
Research works printed but not linked: 5
- Chinvanno, S. (2003, January 24–27). Results from regional climate modelling and their future use in analysis of hydrologic impacts in Mekong River Basin. Proceedings of the First AIACC Regional Workshop and Open Meeting for Asia-Pacific, Bangkok, Thiland.
- Communicable Disease Surveillance Centre, Public Health Wales (2011). Systematic Review of Waterborne Disease Outbreaks Following Extreme Weather Events, Public Health Wales.
- Asia (2014). Intergovernmental Panel on Climate Change (IPCC) WGII AR5, IPCC. Chapter 24.
- (2010). Floods in Pakistan-Health Cluster Bulletin No 12–16 August 2010, World Health Organisation.
- (2014). Intergovernmental Panel on Climate Change (IPCC) WGII AR5, IPCC. Chapter 11.
Cited by
Sorted by citations
Extreme weather impacts of climate change: an attribution perspective
Clarke, B. J., Otto, F. E. L., Stuart-Smith, R. F., & Harrington, L. J. (2022) · Environmental Research Climate · doi:10.1088/2752-5295/ac6e7d · Cited by 727
Climate Change and Water and Sanitation: Likely Impacts and Emerging Trends for Action
Howard, G., Calow, R., MacDonald, A., & Bartram, J. (2016) · Annual Review of Environment and Resources · doi:10.1146/annurev-environ-110615-085856 · Cited by 305
Urban Stream and Wetland Restoration in the Global South—A DPSIR Analysis
Wantzen, K., Alves, C., Badiane, S., Bala, R., Blettler, M., Callisto, M., Cao, Y., Kolb, M., Kondolf, G., Leite, M., et al. (2019) · Sustainability · doi:10.3390/su11184975 · Cited by 135
The Canmore Declaration: Statement of Principles for Planetary Health
Prescott, S. L., Logan, A. C., Albrecht, G. A., Campbell, D. E., Crane, J., Cunsolo, A., Holloway, J. W., Kozyrskyj, A. L., Lowry, C. A., Penders, J., et al. (2018) · Challenges · doi:10.3390/challe9020031 · Cited by 149
Thoma, M. V., Rohleder, N., & Rohner, S. L. (2021) · Frontiers in Psychiatry · doi:10.3389/fpsyt.2021.675936 · Cited by 117
Metadata
- Authors
- Davies, G., McIver, L., Kim, Y., Hashizume, M., Iddings, S., & Chan, V.
- Affiliations
- Monash University (AU)
- Australian National University (AU)
- Nagasaki University (JP)
- World Health Organization (CH)
- Corresponding author
- McIver, Lachlan
- Venue
- International Journal of Environmental Research and Public Health
- Publisher
- MDPI AG
- Published
- 2014-12-23
- Volume
- 12
- Issue
- 1
- Pages
- 191-213
- ISSN
- 1660-4601 (ISSN-L)
- PMC
- PMC4306857
- OpenAlex
- W2163225196
- Cited by
- 106
- References
- 42
- Citations by year
- 2026: 4 · 2025: 13 · 2024: 17 · 2023: 9 · 2022: 10 · 2021: 14 · 2020: 2 · 2019: 10 · 2018: 11 · 2017: 8 · 2016: 7 · 2015: 1
- FWCI
- 3.50
- Type
- journal article
- Language
- en
- Open access
- gold
- dx.doi.org
- Licence
- Locations
- International Journal of Environmental Research and Public Health (publishedVersion, cc-by)
- Europe PMC (PubMed Central) (publishedVersion, cc-by)
- PubMed Central (publishedVersion, cc-by)
- PubMed (publishedVersion)
- ResearchOnline - JCU (James Cook University) (submittedVersion)
- RePEc: Research Papers in Economics (submittedVersion)
- DOAJ (DOAJ: Directory of Open Access Journals) (submittedVersion, cc-by-sa)
- Institutional Repositories DataBase (IRDB) (submittedVersion, cc-by-nc-nd)
- Nagasaki University's Academic Output SITE (Nagasaki University) (submittedVersion, cc-by-nc-nd)
- ANU Open Research (Australian National University) (submittedVersion, cc-by)
- Funders
- World Health Organization
- Topics
- Physical Sciences › Environmental Science › Health, Toxicology and Mutagenesis › Climate Change and Health Impacts
- Physical Sciences › Environmental Science › Health, Toxicology and Mutagenesis › Public Health and Environmental Issues
- Health Sciences › Health Professions › Emergency Medical Services › Disaster Response and Management
- Keywords
- waterborne diseases, extreme weather events, climate change, floods, drought, typhoons, diarrhoeal diseases, child health, sanitation, toilets, piped water, adaptive capacity, health resilience, poverty, Cambodia
- MeSH terms
- Adolescent, Cambodia, Child, Child, Preschool, Communicable Diseases, Diarrhea, Female, Humans, Infant, Male, Toilet Facilities, Weather, Cyclonic Storms, Floods, Climate Change, Drinking Water
About these checks
Registry, retraction, Cites and statistics results are computed, not judged, with one exception: a printed reference that no index lists is read once by a model before it counts as a citation error. Claims are extracted by a model and kept only when their quote appears verbatim in the text; each cited source is then checked, with a model’s help, for whether it says what the claim relies on. Those verdicts can be wrong — read the claim’s quote and the cited source before relying on one.
Statistics and arithmetic are recomputed, not judged.
Confidence bands are shown only for fields calibrated on our annotated test set. None is calibrated yet, so no band is shown.
What counts as a claim ›How we measure confidence ›How we check this ›
Are you an author, or do you see a problem with this page? Request a review
