

The DOI matches its Crossref record; 191 of the 192 references it cites were found in a registry or an index.
Bioinformatics Methods for Mass Spectrometry-Based Proteomics Data Analysis
Open accessAbstract
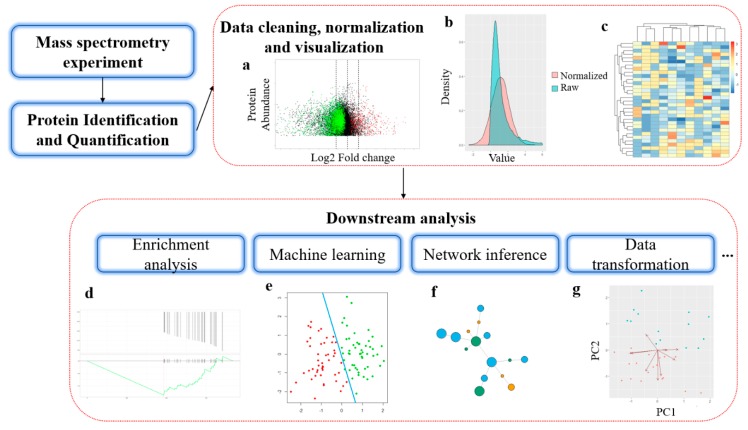
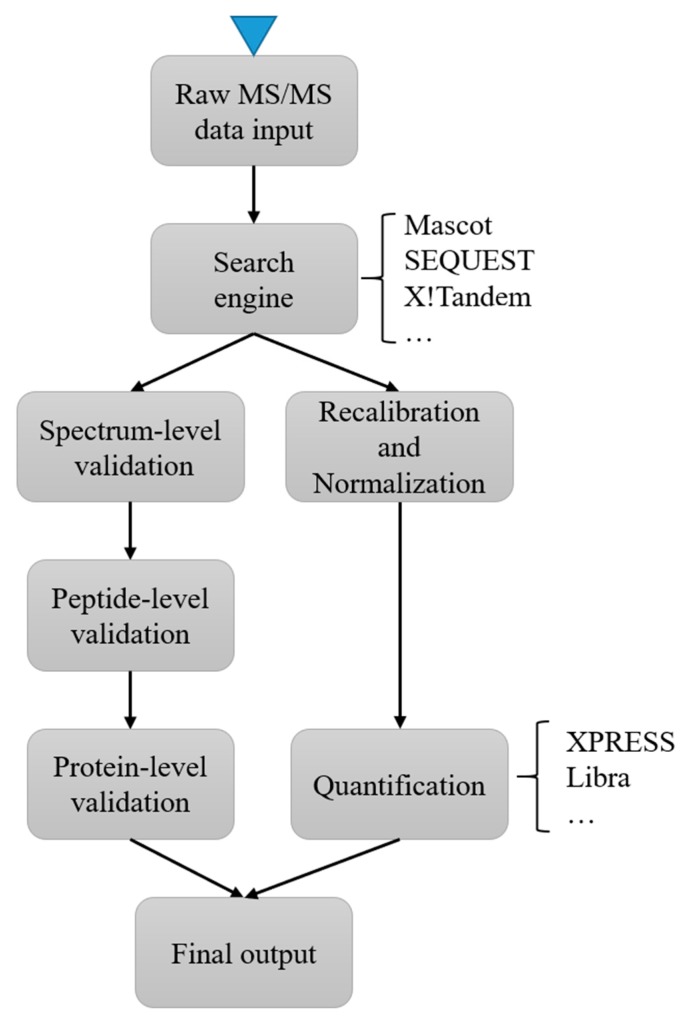
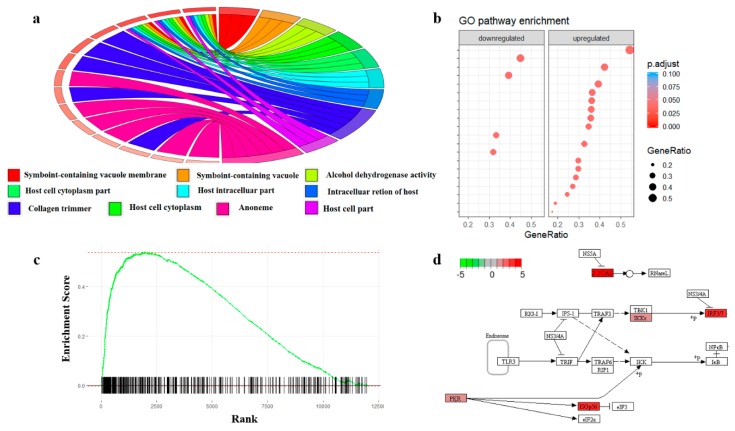
Recent advances in mass spectrometry (MS)-based proteomics have enabled tremendous progress in the understanding of cellular mechanisms, disease progression, and the relationship between genotype and phenotype. Though many popular bioinformatics methods in proteomics are derived from other omics studies, novel analysis strategies are required to deal with the unique characteristics of proteomics data. In this review, we discuss the current developments in the bioinformatics methods used in proteomics and how they facilitate the mechanistic understanding of biological processes. We first introduce bioinformatics software and tools designed for mass spectrometry-based protein identification and quantification, and then we review the different statistical and machine learning methods that have been developed to perform comprehensive analysis in proteomics studies. We conclude with a discussion of how quantitative protein data can be used to reconstruct protein interactions and signaling networks.
Overview
The claims and statistics of this paper haven’t been checked yet.
Run the check — free, no account needed. It reads the open-access text and checks the sources it cites.
Integrity signals
Registry
Cites
Statistics
Figures
Verification
Claims the paper makes
The claims and statistics of this paper haven’t been checked yet.
Run the check — free, no account needed. It reads the open-access text and checks the sources it cites.
Claims other papers make about this one
Each is checked against this paper’s own text: does it say what the citing paper says it does?
The cited source says what the claim attributes to it.
In the citing paper
“For example, mRNA abundance from transcriptomics alone is insufficient to infer protein abundance [Chen et al., 2020; Reimegård et al., 2021]”
From Cell signaling pathways discovery from multi-modal data (2025) · cites this paper as Chen et al., 2020
Self-check
Percentages, sums and reported differences re-computed from the paper’s own numbers.
The self-check needs the paper’s full text.
Citations
Cites
Szklarczyk, D., Gable, A. L., Lyon, D., Junge, A., Wyder, S., Huerta-Cepas, J., Simonovic, M., Doncheva, N. T., Morris, J. H., Bork, P., et al. (2019) · Nucleic Acids Research · doi:10.1093/nar/gky1131 · Cited by 17,749
DAVID: Database for Annotation, Visualization, and Integrated Discovery
Dennis, G., Sherman, B. T., Hosack, D. A., Yang, J., Gao, W., Lane, H. C., & Lempicki, R. A. (2003) · Genome Biology · doi:10.1186/gb-2003-4-5-p3 · Cited by 9,327
KEGG: new perspectives on genomes, pathways, diseases and drugs
Kanehisa, M., Furumichi, M., Tanabe, M., Sato, Y., & Morishima, K. (2017) · Nucleic Acids Research · doi:10.1093/nar/gkw1092 · Cited by 8,865
Perkins, D. N., Pappin, D., Creasy, D. M., & Cottrell, J. S. (1999) · Electrophoresis · doi:10.1002/(sici)1522-2683(19991201)20:18 · Cited by 8,264
Szklarczyk, D., Morris, J. H., Cook, H., Kuhn, M., Wyder, S., Simonovic, M., Santos, A., Doncheva, N. T., Roth, A., Bork, P., et al. (2017) · Nucleic Acids Research · doi:10.1093/nar/gkw937 · Cited by 6,980
Eng, J. K., McCormack, A. L., & Yates, J. R. (1994) · Journal of the American Society for Mass Spectrometry · doi:10.1016/1044-0305(94)80016-2 · Cited by 6,484
Ong, S.-E., Blagoev, B., Kratchmarova, I., Kristensen, D. B., Steen, H., Pandey, A., & Mann, M. (2002) · Molecular & Cellular Proteomics · doi:10.1074/mcp.m200025-mcp200 · Cited by 5,574
Andromeda: A Peptide Search Engine Integrated into the MaxQuant Environment
Cox, J., Neuhauser, N., Michalski, A., Scheltema, R. A., Olsen, J. V., & Mann, M. (2011) · Journal of Proteome Research · doi:10.1021/pr101065j · Cited by 5,520
Cox, J., Hein, M. Y., Luber, C. A., Paron, I., Nagaraj, N., & Mann, M. (2014) · Molecular & Cellular Proteomics · doi:10.1074/mcp.m113.031591 · Cited by 5,180
A statistical model for identifying proteins by tandem mass spectrometry.
Nesvizhskii, A., Keller, A., Kolker, E., & Aebersold, R. (2003) · Analytical Chemistry · doi:10.1021/ac0341261 · Cited by 4,902
Research works printed but not linked: 1
- Fischer, B., Roth, V., Grossmann, J., Baginsky, S., Gruissem, W., Roos, F., Widmayer, P., and Buhmann, J.M. (2005). A hidden markov model for de novo peptide sequencing. Advances in Neural Information Processing Systems, MIT Press. · DOI
Cited by
Sorted by citations
Items 101–200 of 283
Mass Spectrometry Proteomics: A Key to Faster Drug Discovery
Tagliazucchi, L., & Costi, M. P. (2025) · Journal of Medicinal Chemistry · doi:10.1021/acs.jmedchem.5c01986 · Cited by 7
Metabolomic and proteomic analyses of primary Sjogren’s syndrome
Zhang, J., Tang, Z., Liu, Z., Wang, G., Yang, X., & Hou, X. (2023) · Immunobiology · doi:10.1016/j.imbio.2023.152722 · Cited by 7
Unveiling the potential of proteomics in addressing food and feed safety challenges
Pērkons, I., Varunjikar, M. S., & Rasinger, J. D. (2023) · EFSA Journal · doi:10.2903/j.efsa.2023.e211013 · Cited by 7
Neiers, F., Saliou, J., Briand, L. V., & Robichon, A. (2021) · ACS Omega · doi:10.1021/acsomega.1c01465 · Cited by 7
Selvam, M. K. P., Durairajanayagam, D., & Sikka, S. C. (2022) · Advances in experimental medicine and biology · doi:10.1007/978-3-030-89340-8_4 · Cited by 7
Using proteomics for stratification and risk prediction in patients with solid tumors
Werner, T., Fahrner, M., & Schilling, O. (2023) · Die Pathologie · doi:10.1007/s00292-023-01261-x · Cited by 7
Li, B., Li, H., Zhang, L., Ren, T., & Meng, J. (2023) · Annals of Translational Medicine · doi:10.21037/atm-22-5646 · Cited by 7
Biomarker research for Henoch-Schönlein purpura nephritis based on “omics” techniques
Zhou, X., Yuan, Z., Jiang, H., Ju, Y., Chen, C., Zhang, W., Liu, H., Zhang, L., Qi, M., & An, D. (2025) · Frontiers in Medicine · doi:10.3389/fmed.2025.1626324 · Cited by 6
Self-citationGonzález‐Avendaño, M., Zúñiga-Almonacid, S., Silva, I., Lavanderos, B. J., Robinson, F., Rosales‐Rojas, R., Durán-Verdugo, F., González, W., Cáceres, M., Cerda, O., et al. (2021) · Frontiers in Molecular Biosciences · doi:10.3389/fmolb.2021.701477 · Cited by 6
Proteomic advance of ischemic stroke: preclinical, clinical, and intervention
Zhao, T., Zeng, J., Zhang, R., Pu, L., Wang, H., Pan, L., Jiang, Y., Dai, X., Sha, Y., & Han, L. (2023) · Metabolic Brain Disease · doi:10.1007/s11011-023-01262-y · Cited by 6
Li, H., Lin, G., Cui, M., Wang, L., Ding, D., Li, X., Fan, X., Yang, Q., Wang, Y., Kang, C., et al. (2023) · Medicine · doi:10.1097/md.0000000000036414 · Cited by 6
Proteomic Signatures: A review on forensic bone proteomics and estimation of post-mortem interval
Arora, S., Dalal, J., Kumari, K., & Shukla, S. (2024) · Microchemical Journal · doi:10.1016/j.microc.2024.111317 · Cited by 6
Fetse, J., Olawode, E. O., & Deb, S. (2024) · European Journal of Drug Metabolism and Pharmacokinetics · doi:10.1007/s13318-024-00912-5 · Cited by 6
Mass spectrometry based proteomics for developmental neurobiology in the amphibian Xenopus laevis
Baxi, A. B., Pade, L. R., & Nemes, P. (2021) · Current topics in developmental biology/Current Topics in Developmental Biology · doi:10.1016/bs.ctdb.2021.04.002 · Cited by 6
Application of Proteomics in Apical Periodontitis
Hussein, H., & Kishen, A. (2022) · Frontiers in Dental Medicine · doi:10.3389/fdmed.2022.814603 · Cited by 6
The Breast Cancer Protein Co-Expression Landscape
Ruhle, M., Enríquez, J. E., & Lemus, E. H. (2022) · Cancers · doi:10.3390/cancers14122957 · Cited by 6
Top-Down Mass Spectrometry Data Analysis Using TopPIC Suite
Choi, I. K., & Liu, X. (2022) · Methods in molecular biology · doi:10.1007/978-1-0716-2325-1_8 · Cited by 6
Proteomic Analysis of the Sphincter in a Neurogenic Bladder Caused by T10 Spinal Cord Injury
Qu, Q.-R., Tang, L.-Y., Liu, Q., Long, Y.-Y., Wu, X., Xu, M. J., Qi, F., Zhang, H., Ai, K., & Lü, Z. (2022) · Journal of Integrative Neuroscience · doi:10.31083/j.jin2105147 · Cited by 6
Ramírez-Carreto, S., Miranda-Zaragoza, B., Simões, N., González-Muñoz, R., & Rodríguez-Almazán, C. (2023) · Marine Drugs · doi:10.3390/md22010012 · Cited by 6
The Perspectives of Platelet Proteomics in Health and Disease
Chaudhary, P. K., Upadhayaya, S., Kim, S., & Kim, S. (2024) · Biomedicines · doi:10.3390/biomedicines12030585 · Cited by 6
Phosphoproteome Analysis in Immune Cell Signaling
Rathore, D., & Nita‐Lazar, A. (2020) · Current Protocols in Immunology · doi:10.1002/cpim.105 · Cited by 6
Subramanian, D., & Natarajan, J. (2022) · Critical Reviews in Microbiology · doi:10.1080/1040841x.2022.2065905 · Cited by 7
Structural proteomics of a bacterial mega membrane protein complex: FtsH-HflK-HflC
Akkulak, H., İnce, H. K., Goc, G., Lebrilla, C. B., Kabasakal, B. V., & Ozcan, S. (2024) · International Journal of Biological Macromolecules · doi:10.1016/j.ijbiomac.2024.131923 · Cited by 5
Common scents? A review of potentially shared chemical signals in the order Carnivora
Root‐Gutteridge, H., de Kock, N., Young, M., Gill, A. C., Penny, J. A., Pike, T. W., & Mills, D. S. (2025) · Chemical Senses · doi:10.1093/chemse/bjaf019 · Cited by 5
Abad, P., Coronado, M., Vincelle-Nieto, Á., Pérez-Benavente, S., Fobil, J. N., Puyet, A., Díez, A., Reyes‐Palomares, A., Azcárate, I. G., & Bautista, J. M. (2024) · Journal of Proteome Research · doi:10.1021/acs.jproteome.3c00439 · Cited by 5
Guo, S., & Yang, Q. (2024) · Frontiers in Bioscience-Landmark · doi:10.31083/j.fbl2901039 · Cited by 5
Serum L-selectin levels as predictive markers for chronic major depressive disorder progression
Yun, Y., Mun, S., Lee, S., Kang, H., & Lee, J. (2024) · Annals of General Psychiatry · doi:10.1186/s12991-024-00522-0 · Cited by 5
SQuAPP—simple quantitative analysis of proteins and PTMs
Ergin, E. K., Uzozie, A. C., Chen, S., Su, Y., & Lange, P. F. (2022) · Bioinformatics · doi:10.1093/bioinformatics/btac628 · Cited by 5
Postoenko, V. I., Garibova, L. A., Levitsky, L. I., Bubis, J. A., Gorshkov, M. V., & Ivanov, M. V. (2023) · Journal of Proteome Research · doi:10.1021/acs.jproteome.3c00075 · Cited by 5
Tsc22d3 promotes morphine tolerance in mice through the GPX4 ferroptosis pathway
Chen, Y., Li, S., & Guo, F. (2024) · Aging · doi:10.18632/aging.205903 · Cited by 5
Full Window Data-Independent Acquisition Method for Deeper Top-Down Proteomics
Sun, C., Zhang, W., Zhou, M., Myu, M., & Xu, W. L. (2025) · Analytical Chemistry · doi:10.1021/acs.analchem.4c06471 · Cited by 6
Mass Spectral Analysis of Synthetic Peptides: Implications in Proteomics
Jagannadham, M. V., Gayatri, P., Binny, T. M., Raman, B., Kameshwari, D. B., & Nagaraj, R. (2020) · Journal of Biomolecular Techniques JBT · doi:10.7171/jbt.21-3201-001 · Cited by 5
CEACAM1 as a molecular target in oral cancer
Ma, S., Wang, Z., Li, C., Liu, Z., Zhang, X., Li, L., An, F., & Qiao, X. (2023) · Aging · doi:10.18632/aging.204960 · Cited by 5
Validating Amino Acid Variants in Proteogenomics Using Sequence Coverage by Multiple Reads
Levitsky, L. I., Kuznetsova, K. G., Kliuchnikova, A. A., Ilina, I. Y., Goncharov, A. O., Lobas, A. A., Ivanov, M. V., Lazarev, V. N., Ziganshin, R., Gorshkov, M. V., et al. (2022) · Journal of Proteome Research · doi:10.1021/acs.jproteome.2c00033 · Cited by 5
Paredes, J., Wang, Z., Patel, P. R., Rose, K. L., & Schey, K. L. (2023) · Frontiers in Ophthalmology · doi:10.3389/fopht.2023.1241001 · Cited by 4
Data-driven discovery of antiviral peptides against PRRSV using multiple machine learning models
Yousaf, W., Haseeb, A., Shen, Y., Li, H., Fan, K., Sun, N., Sun, P., Sun, Y., Yang, H., Yin, W., et al. (2025) · Frontiers in Veterinary Science · doi:10.3389/fvets.2025.1681083 · Cited by 4
Interpreting the Function of the IL-23/IL-17 Axis through Bioinformatics
Vázquez‐Jiménez, S. I., González–Sánchez, G. D., Velázquez, C. G., & Guzmán‐Flores, J. M. (2024) · Endocrine Metabolic & Immune Disorders - Drug Targets · doi:10.2174/0118715303316226240823045641 · Cited by 4
Biophysical Analysis of Therapeutic Antibodies in the Early Development Pipeline
Willis, L. F., Kapur, N., Radford, S. E., & Brockwell, D. J. (2024) · Biologics · doi:10.2147/btt.s486345 · Cited by 6
Zero-shot de novo peptide sequencing with open posttranslational modification discovery
Mao, Z., Peng, C., Chen, Y., Wu, P., Zhang, Q., Yu, Y., Zhang, R., Xin, L., Shan, B., Deng, H., et al. (2026) · Nature Biotechnology · doi:10.1038/s41587-026-03116-1 · Cited by 4
Unlocking the algae toolbox: Cutting-edge tools for environmental and biotechnological solutions
Bui, V. K. H., Trung, L. G., Huu, H., Tran, N. T., & Nguyen, M. K. (2025) · Biotechnology Advances · doi:10.1016/j.biotechadv.2025.108652 · Cited by 4
Cai, S., Fan, L., Liu, D., Wei, C. H., Yang, N., Fu, X., Tang, R., Xu, J., Yin, S., & Chen, X. (2025) · Food Chemistry · doi:10.1016/j.foodchem.2025.146696 · Cited by 4
Lang, T., Liu, X., & Meng, L. (2025) · Journal of Cardiothoracic Surgery · doi:10.1186/s13019-025-03634-0 · Cited by 4
Khalil, S., Wychowski, A., Chéry, C. C., & Gervais, A. (2023) · Journal of Pharmaceutical and Biomedical Analysis Open · doi:10.1016/j.jpbao.2023.100012 · Cited by 4
Sun, M. J., Lv, F., Qin, C., Du, D., Li, W., & Liu, S. (2024) · Current Pharmaceutical Design · doi:10.2174/0113816128289900240219104854 · Cited by 4
PDCD4-induced oxidative stress through FGR/NF-κB axis in rectal cancer radiotherapy-induced AKI
Ma, Q., Zheng, L., Cheng, H., Li, X., Liu, Z., & Gong, P. (2024) · International Immunopharmacology · doi:10.1016/j.intimp.2024.111779 · Cited by 5
Bioinformation Analysis of Differential Expression Proteins in Different Processes of COVID-19
Guo, N., Han, X., Han, G., Dai, M., Han, Z., & Li, Q. (2024) · Viral Immunology · doi:10.1089/vim.2023.0094 · Cited by 4
High expression of CNOT6L contributes to the negative development of type 2 diabetes
Zhang, Y., Liu, G., Ding, H., & Fan, B. (2024) · Scientific Reports · doi:10.1038/s41598-024-76095-5 · Cited by 4
Liao, Q., Wu, S., Li, X., & Yuan, L.-X. (2025) · Journal of Ethnopharmacology · doi:10.1016/j.jep.2025.119381 · Cited by 6
Lin, J., Cai, X., Liu, L., Li, A., Huang, H., Fu, Y., Dai, Z., & Sun, Y. (2025) · Current Cancer Drug Targets · doi:10.2174/0115680096326784241009113454 · Cited by 4
Kołodziejczak, I., Simões, R., Santos, E. D. S., Demicco, E. G., Segura, R. N. L., Weiping, M., Wang, P., Geffen, Y., Storrs, E. P., Petralia, F., et al. (2025) · Cell Genomics · doi:10.1016/j.xgen.2025.100851 · Cited by 4
Tong, C., Cong, P., Liu, Y., Shi, X., Shi, L., Mao, S., Zhao, Y., Hou, M., & Liu, Y. (2021) · Frontiers in Molecular Neuroscience · doi:10.3389/fnmol.2021.688050 · Cited by 4
Establishment of a novel myocarditis mouse model based on cyclosporine A
Zhao, T. H., Jiang, Y. X., Chen, K. Q., Qiu, D., Xu, Y., Ye, C., Ren, T., Zhang, B., Dai, B., Hu, J., et al. (2022) · Genes & Genomics · doi:10.1007/s13258-022-01267-4 · Cited by 4
Parvin, S., Arabfard, M., Ghazvini, A., Ghanei, M., & Najafi, A. (2022) · BMC Pulmonary Medicine · doi:10.1186/s12890-022-02240-3 · Cited by 4
Mass Spectrometry-Based Vitreous Proteomics: Validated Methods and Analysis Pipeline
Weber, S. R., Carruthers, N., Gates, C., Zhao, Y., & Sundstrom, J. M. (2023) · Methods in molecular biology · doi:10.1007/978-1-0716-3255-0_11 · Cited by 4
The potential mechanisms of neuroblastoma in children based on bioinformatics big data
Chen, Z.-F., Wu, L., Chen, Z.-T., Su, L., & Fu, C.-J. (2022) · Translational Pediatrics · doi:10.21037/tp-22-504 · Cited by 4
Cell signaling pathways discovery from multi-modal data
He, C., Simpson, C., Cossentino, I., Zhang, B., Tkachev, S., Eddins, D. J., Kosters, A., Yang, J., Sheth, S., Levy, T., et al. (2025) · doi:10.1101/2025.02.06.636961 · Cited by 3
CENPF as a prognostic marker of glioma: unraveling the molecular mechanisms
Chen, X., Wu, Y., Xing, Y., & Zhong, P. Y. (2025) · Journal of Cancer Research and Clinical Oncology · doi:10.1007/s00432-025-06144-7 · Cited by 3
Proteomics and metabolomics in cancer biomarker discovery
Basoya, R., Bhasin, N., Jain, P., & Aggarwal, S. (2025) · Methods in cell biology · doi:10.1016/bs.mcb.2025.02.010 · Cited by 3
Khalil, S., & Plisnier, M. (2025) · Journal of Pharmaceutical and Biomedical Analysis Open · doi:10.1016/j.jpbao.2025.100082 · Cited by 3
Ambli, M., Deracinois, B., Jenequin, A.-S., Ravallec, R., Cudennec, B., & Flahaut, C. (2023) · Foods · doi:10.3390/foods12132524 · Cited by 3
Kuo, C.-M., Jen, H., Chen, F., Akbarian, M., Ou, T.-H., Lin, J., Lin, J.-L., & Chen, S. (2023) · Analytica Chimica Acta · doi:10.1016/j.aca.2023.341790 · Cited by 3
Proteomic Analysis of Soybean Nodules: Insights into Efficient Nitrogen Fixation
Zhou, X., & Guo, T. (2025) · Molecular Soil Biology · doi:10.5376/msb.2024.15.0021 · Cited by 3
Zuo, H., Zhou, D., Gao, C., Yang, Y., Cao, L. S., Liao, S., Ou, J., & Bian, Y. (2025) · Journal of Chromatography A · doi:10.1016/j.chroma.2025.465789 · Cited by 3
Identification of noval diagnostic biomarker for HFpEF based on proteomics and machine learning
Abudurexiti, M., Aimaier, S., Wupuer, N., Duan, D., Abudouwayiti, A., Nuermaimaiti, M., & Mahemuti, A. (2025) · Proteome Science · doi:10.1186/s12953-025-00242-7 · Cited by 3
Chen, X., Xie, Z., Wu, R., He, X., Qin, M., Wang, H., Bai, S., Chen, Z., He, C., Ou, Y., et al. (2025) · Advanced Materials · doi:10.1002/adma.202507743 · Cited by 3
Mining Proteome Research Reports: A Bird’s Eye View
Sahu, J. (2021) · Proteomes · doi:10.3390/proteomes9020029 · Cited by 3
Aziz, S., Rasheed, F., Zahra, R., & König, S. (2023) · Life · doi:10.3390/life13020544 · Cited by 3
Guzmán‐Flores, J. M., Martínez–Esquivias, F., Becerra‐Ruiz, J. S., & Vázquez-Rodríguez, S. B. (2023) · Current Proteomics · doi:10.2174/1570164620666230331102317 · Cited by 3
Insights into enhancing Centella asiatica organ cell biofactories via hairy root protein profiling
Alcalde, M. A., Hidalgo, D., Bru‐Martínez, R., Sellés‐Marchart, S., Bonfill, M., & Palazón, J. (2023) · Frontiers in Plant Science · doi:10.3389/fpls.2023.1274767 · Cited by 3
Screening the Biomarkers and Related Medicines for Gastric Adenocarcinoma
Lin, J., Xu, N., & An, W. (2024) · Journal of College of Physicians And Surgeons Pakistan · doi:10.29271/jcpsp.2024.03.290 · Cited by 3
Multi-Omic Approaches in Cancer-Related Micropeptide Identification
Vrbnjak, K., & Sewduth, R. N. (2024) · Proteomes · doi:10.3390/proteomes12030026 · Cited by 3
Cell-Lineage Guided Mass Spectrometry Proteomics in the Developing (Frog) Embryo
Baxi, A. B., Pade, L. R., & Nemes, P. (2022) · Journal of Visualized Experiments · doi:10.3791/63586 · Cited by 3
Wang, C., Wu, S., Li, J., Ma, Y., Huang, Y., & Fang, N. (2022) · Translational Andrology and Urology · doi:10.21037/tau-22-366 · Cited by 3
Abidin, I. Z. Z., Manogaran, T., Wahab, R. M. A., Karsani, S. A., Yazid, M. D., Yazid, F., Ariffin, Z. Z., Johari, A. N., & Ariffin, S. H. Z. (2022) · Current Stem Cell Research & Therapy · doi:10.2174/1574888x17666220627145424 · Cited by 3
Peng, L., Bai, G., Wang, C., Dong, J., Liu, Y., Sun, Z., Zhen, Y., Qin, G., Zhang, X., Aschalew, N. D., et al. (2022) · Animals · doi:10.3390/ani12131718 · Cited by 3
Correia, I., Oliveira, C., Reis, A., Guimarães, A. R., Aveiro, S. S., Domingues, P. M., Bezerra, A. R., Vitorino, R. M. P., Moura, G. R., & Santos, M. A. S. (2024) · Molecular & Cellular Proteomics · doi:10.1016/j.mcpro.2024.100818 · Cited by 2
El-Wakil, E. S., Tolba, M. M., El-Sayad, M. H., Hassen, M. K., Al-Rashidi, H. S., Almayouf, M. A., Al‐Megrin, W. A. I., Alzaylaee, H., & Moneer, E. A. (2025) · Frontiers in Veterinary Science · doi:10.3389/fvets.2025.1646155 · Cited by 2
Sahu, P., Camarillo, I. G., & Sundararajan, R. (2025) · Bioelectrochemistry · doi:10.1016/j.bioelechem.2025.109153 · Cited by 2
Wang, M.-G., Zhang, M., Liu, Q., & He, J. (2026) · British Journal of Clinical Pharmacology · doi:10.1002/bcp.70446 · Cited by 2
A Review of Artificial Intelligence Applications in Baijiu Research: From Experience to Data
Huang, H., Zhao, J., Deng, Y., Liu, J., Li-ping, X., & Lv, H. (2026) · Fermentation · doi:10.3390/fermentation12050233 · Cited by 2
Application of Bioinformatics in Health Care and Medicine
Keerthana, P., & Gochhait, S. (2022) · Springer eBooks · doi:10.1007/978-981-19-6506-7_5 · Cited by 2
Guo, J., Xing, W., Liu, W., Liu, J., Zhang, J., & Pang, Z. (2022) · PubMed Central · Cited by 2
Forknall, C. R., Verbyla, A. P., Nazarathy, Y., Yousif, A. M., Osama, S. K., Jones, S. H., Kerr, E. D., Schulz, B. L., Fox, G. P., & Kelly, A. M. (2023) · Journal of Agricultural Biological and Environmental Statistics · doi:10.1007/s13253-023-00574-x · Cited by 2
Balaya, R. D. A., & Prasad, T. S. K. (2024) · Springer eBooks · doi:10.1007/978-981-97-5045-0_7 · Cited by 2
Application of Metabolomics in Carcinogenesis and Cancer Prevention by Dietary Phytochemicals
Peter, R. M., Su, X., & Kong, A. T. (2025) · Current Pharmacology Reports · doi:10.1007/s40495-025-00396-0 · Cited by 2
Coding Methods for String Reconstruction From Erroneous Prefix-Suffix Compositions
Chen, Z. (2025) · IEEE Journal on Selected Areas in Information Theory · doi:10.1109/jsait.2025.3617251 · Cited by 2
Yan, Y., Shi, Z., & Wei, H. (2023) · Frontiers in Microbiology · doi:10.3389/fmicb.2023.1245805 · Cited by 2
Chen, D., Yang, Y., Shi, D., Zhang, Z., Wang, M., Pan, Q., Su, J., & Wang, Z. (2024) · Journal of Bioinformatics and Computational Biology · doi:10.1142/s0219720024500252 · Cited by 2
Nanni, P., Gehrig, P., & Schlapbach, R. (2022) · CHIMIA International Journal for Chemistry · doi:10.2533/chimia.2022.73 · Cited by 2
Bioinformatics Approaches for Fungal Biotechnology
Li, J., de Vries, R. P., & Peng, M. (2020) · Elsevier eBooks · doi:10.1016/b978-0-12-819990-9.00012-3 · Cited by 2
Proteomics in the Pharmaceutical Industry: Prospects and Challenges
Patel, D., Patel, V., Patel, G., & Patel, J. K. (2024) · Springer eBooks · doi:10.1007/978-3-031-64021-6_14 · Cited by 1
Kulyyassov, A., Makhsatova, S., & Kurmanbay, A. (2025) · Applied Sciences · doi:10.3390/app15020666 · Cited by 1
Global Proteomic Profiling to Unravel Lipofuscin’s Protein Repertoire
Thanos, D.-F., Saiti, A., Giannopoulos‐Dimitriou, A., Kontouli-Pertesi, N., Gorgoulis, V. G., & Anagnostopoulos, A. K. (2025) · Methods in molecular biology · doi:10.1007/978-1-0716-4426-3_12 · Cited by 1
Identification and verification of the key genes involved in gallbladder cancer
Tang, J., Zhou, H., Lu, M., Cao, D., Zhang, Y., & Zhou, S. (2025) · Frontiers in Immunology · doi:10.3389/fimmu.2025.1643366 · Cited by 1
Pandey, P. (2026) · Journal of Mass Spectrometry · doi:10.1002/jms.70025 · Cited by 1
Yagoubi, R., Hennekinne, J., & Nia, Y. (2026) · Current Opinion in Food Science · doi:10.1016/j.cofs.2026.101407 · Cited by 1
Mass spectrometry in snake venom research
Leonardi, A. (2022) · Acta Biologica Slovenica · doi:10.14720/abs.65.2.12499 · Cited by 1
Computational tools in genomics and proteomics
Desai, S. A., Patel, V. P., Bhosle, K., Sapkal, S. P., & More, M. J. (2025) · Elsevier eBooks · doi:10.1016/b978-0-443-27416-9.00002-2 · Cited by 2
de Souza, G. F., Magalhães, R. S. S., Monteiro-Neto, J. R., Martins, M. R., Follmer, C., Junqueira, M., & Eleuthério, E. C. A. (2025) · GeroScience · doi:10.1007/s11357-025-01934-w · Cited by 1
Mustafina, G. R., Khalikov, A. A., Олегович, К. К., & Nazarova, E. M. (2025) · Russian Journal of Forensic Medicine · doi:10.17816/fm16284 · Cited by 1
Metadata
- Authors
- Chen, C., Hou, J., Tanner, J. J., & Cheng, J.
- Affiliations
- University of Missouri (US)
- Saint Louis University (US)
- Corresponding author
- Cheng, Jianlin
- Venue
- International Journal of Molecular Sciences
- Publisher
- MDPI AG
- Published
- 2020-04-20
- Volume
- 21
- Issue
- 8
- Pages
- 2873
- ISSN
- 1422-0067 (ISSN-L)
- PMC
- PMC7216093
- OpenAlex
- W3016487203
- Cited by
- 280
- References
- 192
- Citations by year
- 2026: 22 · 2025: 58 · 2024: 56 · 2023: 51 · 2022: 54 · 2021: 33 · 2020: 6
- FWCI
- 4.31
- Type
- journal article
- Language
- en
- Open access
- gold
- dx.doi.org
- Licence
- Locations
- International Journal of Molecular Sciences (publishedVersion, cc-by)
- PubMed Central (publishedVersion, cc-by)
- PubMed (publishedVersion)
- DOAJ (DOAJ: Directory of Open Access Journals) (submittedVersion, cc-by-sa)
- Funders
- National Institutes of Health (R01GM093123)
- National Science Foundation (DBI1759934, IIS1763246)
- Topics
- Physical Sciences › Chemistry › Spectroscopy › Advanced Proteomics Techniques and Applications
- Life Sciences › Biochemistry, Genetics and Molecular Biology › Molecular Biology › Bioinformatics and Genomic Networks
- Physical Sciences › Chemistry › Spectroscopy › Mass Spectrometry Techniques and Applications
- Keywords
- proteomics data analysis, mass spectrometry, protein identification, protein quantification, bioinformatics software, statistical analysis, machine learning, protein-protein interaction network, signaling networks, quantitative proteomics
- MeSH terms
- Machine Learning, Data Analysis, Humans, Mass Spectrometry, Computational Biology, Protein Interaction Mapping, Proteomics, Workflow, Protein Interaction Maps
About these checks
Registry, retraction, Cites and statistics results are computed, not judged, with one exception: a printed reference that no index lists is read once by a model before it counts as a citation error. Claims are extracted by a model and kept only when their quote appears verbatim in the text; each cited source is then checked, with a model’s help, for whether it says what the claim relies on. Those verdicts can be wrong — read the claim’s quote and the cited source before relying on one.
Statistics and arithmetic are recomputed, not judged.
Confidence bands are shown only for fields calibrated on our annotated test set. None is calibrated yet, so no band is shown.
What counts as a claim ›How we measure confidence ›How we check this ›
Are you an author, or do you see a problem with this page? Request a review
