Cited by 21TGF-β signaling in diseasesCancer Cells and MetastasisKruppel-like factors research

The DOI matches its Crossref record; 4 of the 4 references it cites were found in a registry or an index.

The New Model of Snail Expression Regulation: The Role of MRTFs in Fast and Slow Endothelial–Mesenchymal Transition

Open access
Sobierajska, Katarzyna, Ciszewski, Wojciech M., Macierzynska-Piotrowska, Ewa, Klopocka, Wanda, Przygodzka, Patrycja, Karakula, Magdalena, Pestka, Karolina, Wawro, Marta E., Niewiarowska, Jolanta·2020·International Journal of Molecular Sciences

Abstract

Endothelial–mesenchymal transition (EndMT) is a crucial phenomenon in regulating the development of diseases, including cancer metastasis and fibrotic disorders. The primary regulators of disease development are zinc-finger transcription factors belonging to the Snail family. In this study, we characterized the myocardin-related transcription factor (MRTF)-dependent mechanisms of a human snail promoter regulation in TGF-β-stimulated human endothelial cells. Although in silico analysis revealed that the snail promoter’s regulatory fragment contains one GCCG and two SP1 motifs that could be occupied by MRTFs, the genetic study confirmed that MRTF binds only to SP1 sites to promote snail expression. The more accurate studies revealed that MRTF-A binds to both SP1 elements, whereas MRTF-B to only one (SP1near). Although we found that each MRTF alone is capable of inducing snail expression, the direct cooperation of these proteins is required to reinforce snail expression and promote the late stages of EndMT within 48 hours. Furthermore, genetic and biochemical analysis revealed that MRTF-B alone could induce the late stage of EndMT. However, it requires a prolonged time. Therefore, we concluded that MRTFs might cause EndMT in a fast- and slow-dependent manner. Based on MRTF-dependent Snail upregulation, we recognized that TGF-β1, as an MRTF-B regulator, is involved in slow EndMT induction, whereas TGF-β2, which altered both MRTF-A and MRTF-B expression, promotes a fast EndMT process.

Overview

The claims and statistics of this paper haven’t been checked yet.

Run the check — free, no account needed. It reads the open-access text and checks the sources it cites.

A few free checks a day · papers already verified open instantly · results are public

Integrity signals

Registry

Crossref · 10.3390/ijms21165875

Cites

4 of 4 references verified0 citation errors · 0 not checkable

Statistics

Figures

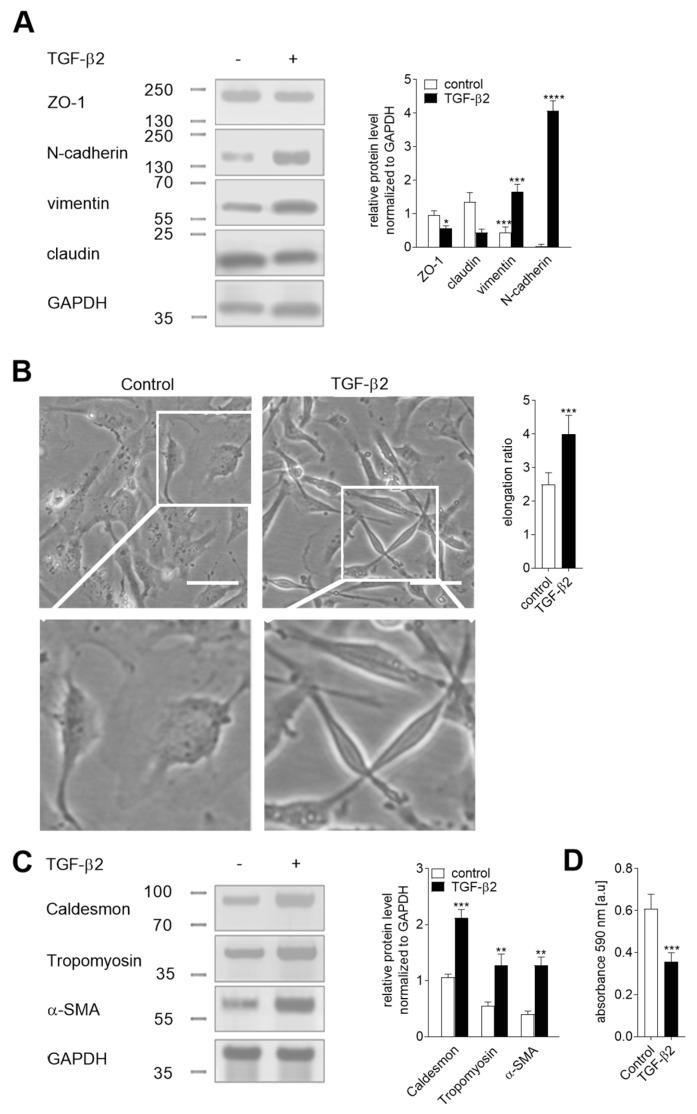
Figure 1 Characteristics of the TGF-β2-induced endothelial–mesenchymal transition (EndMT) in HUVEC. Cells were incubated with TGF-β2 (10 ng/mL) for 48 h or alone. Subsequently, (A) the level of EndMT markers was evaluated using Western blot assay with the appropriate antibodies. The background was subtracted and the area for each protein peak was determined. Protein levels were normalized to GAPDH. (B) Cell morphology was observed under the microscope. Representative images are shown and a quantitative analysis of the mean of elongation ratio from three independent experiments was performed in Meta®Morph. Bars, 30 μm. (C) Contraction markers were determined by Western blot analysis. The relative protein level was quantified using scan densitometry. The background was subtracted and the area for each protein peak was determined. Protein levels were normalized to GAPDH. Subsequently, (D) the adhesion properties to collagen I was analyzed. Cells were placed on a collagen I pre-coated well for 1 h to adhere. After washing, the cells were stained, and the total cell-associated protein was determined using a microplate reader at 595 nm. The results are presented as the means ± SD (N = 3); * p < 0.05, ** p < 0.01, *** p < 0.001, **** p < 0.0005.
Figure 1 Characteristics of the TGF-β2-induced endothelial–mesenchymal transition (EndMT) in HUVEC. Cells were incubated with TGF-β2 (10 ng/mL) for 48 h or alone. Subsequently, (A) the level of EndMT markers was evaluated using Western blot assay with the appropriate antibodies. The background was subtracted and the area for each protein peak was determined. Protein levels were normalized to GAPDH. (B) Cell morphology was observed under the microscope. Representative images are shown and a quantitative analysis of the mean of elongation ratio from three independent experiments was performed in Meta®Morph. Bars, 30 μm. (C) Contraction markers were determined by Western blot analysis. The relative protein level was quantified using scan densitometry. The background was subtracted and the area for each protein peak was determined. Protein levels were normalized to GAPDH. Subsequently, (D) the adhesion properties to collagen I was analyzed. Cells were placed on a collagen I pre-coated well for 1 h to adhere. After washing, the cells were stained, and the total cell-associated protein was determined using a microplate reader at 595 nm. The results are presented as the means ± SD (N = 3); * p < 0.05, ** p < 0.01, *** p < 0.001, **** p < 0.0005.CC BY · PubMed Central
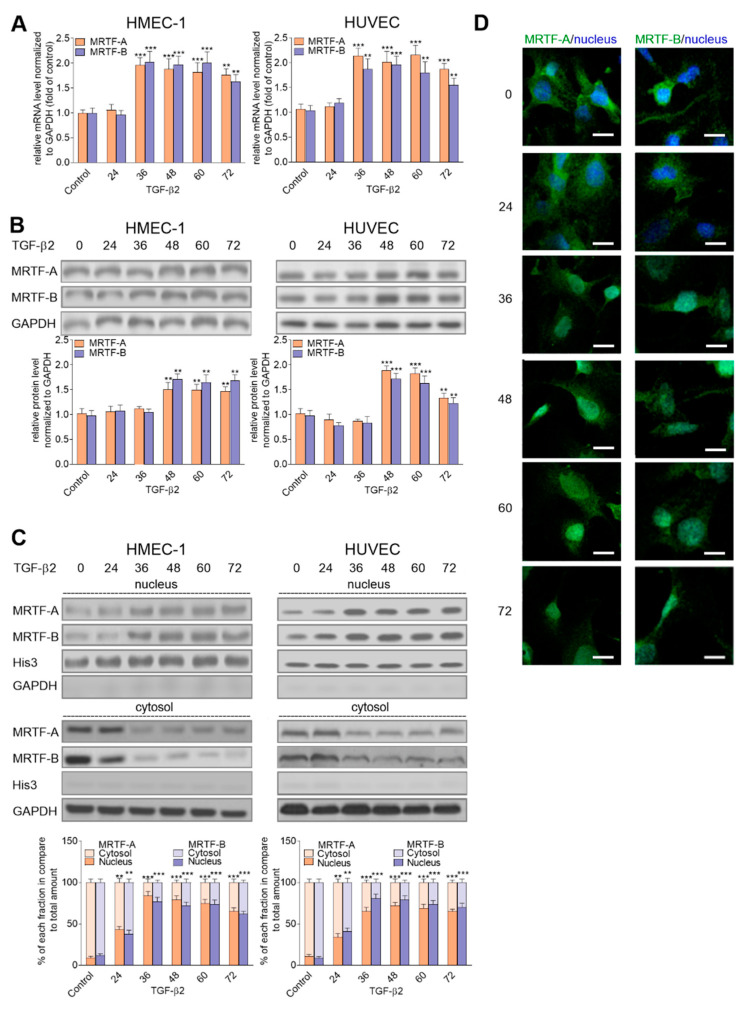
Figure 2 TGF-β2-induced myocardin-related transcription factor (MRTF) upregulation affected their nucleus accumulation. HMEC-1 cells and HUVECs were incubated with TGF-β2 (10 ng/mL) for 24, 36, 48, 60, and 72 h, or alone. Subsequently, (A) expression of MRTF-A and MRTF-B was analyzed by real-time PCR. The protein levels of the MRTFs were determined by Western blot analysis in (B) total lysate and (C) the nucleus and cytoplasm fraction of the analyzed cells. The background was subtracted and the area for each protein peak was determined. In the analysis of the MRTFs, the translocation MRTF-A or -B level was determined as a % of the total MRTF-A or –B. Protein levels were normalized to GAPDH (total lysate or cytoplasm fraction) or His3 (nuclear fraction). Blots are representative of three independent experiments. (D) The localization of MRTF-A and MRTF-B in the cellular compartments were analyzed using a confocal microscope. MRTFs were stained with antibodies conjugated with FITC. The white bar represents a 30 μm length. Representative images are shown. The results are presented as the means ± SD (N ≥ 3); ** p < 0.01, *** p < 0.001.
Figure 2 TGF-β2-induced myocardin-related transcription factor (MRTF) upregulation affected their nucleus accumulation. HMEC-1 cells and HUVECs were incubated with TGF-β2 (10 ng/mL) for 24, 36, 48, 60, and 72 h, or alone. Subsequently, (A) expression of MRTF-A and MRTF-B was analyzed by real-time PCR. The protein levels of the MRTFs were determined by Western blot analysis in (B) total lysate and (C) the nucleus and cytoplasm fraction of the analyzed cells. The background was subtracted and the area for each protein peak was determined. In the analysis of the MRTFs, the translocation MRTF-A or -B level was determined as a % of the total MRTF-A or –B. Protein levels were normalized to GAPDH (total lysate or cytoplasm fraction) or His3 (nuclear fraction). Blots are representative of three independent experiments. (D) The localization of MRTF-A and MRTF-B in the cellular compartments were analyzed using a confocal microscope. MRTFs were stained with antibodies conjugated with FITC. The white bar represents a 30 μm length. Representative images are shown. The results are presented as the means ± SD (N ≥ 3); ** p < 0.01, *** p < 0.001.CC BY · PubMed Central
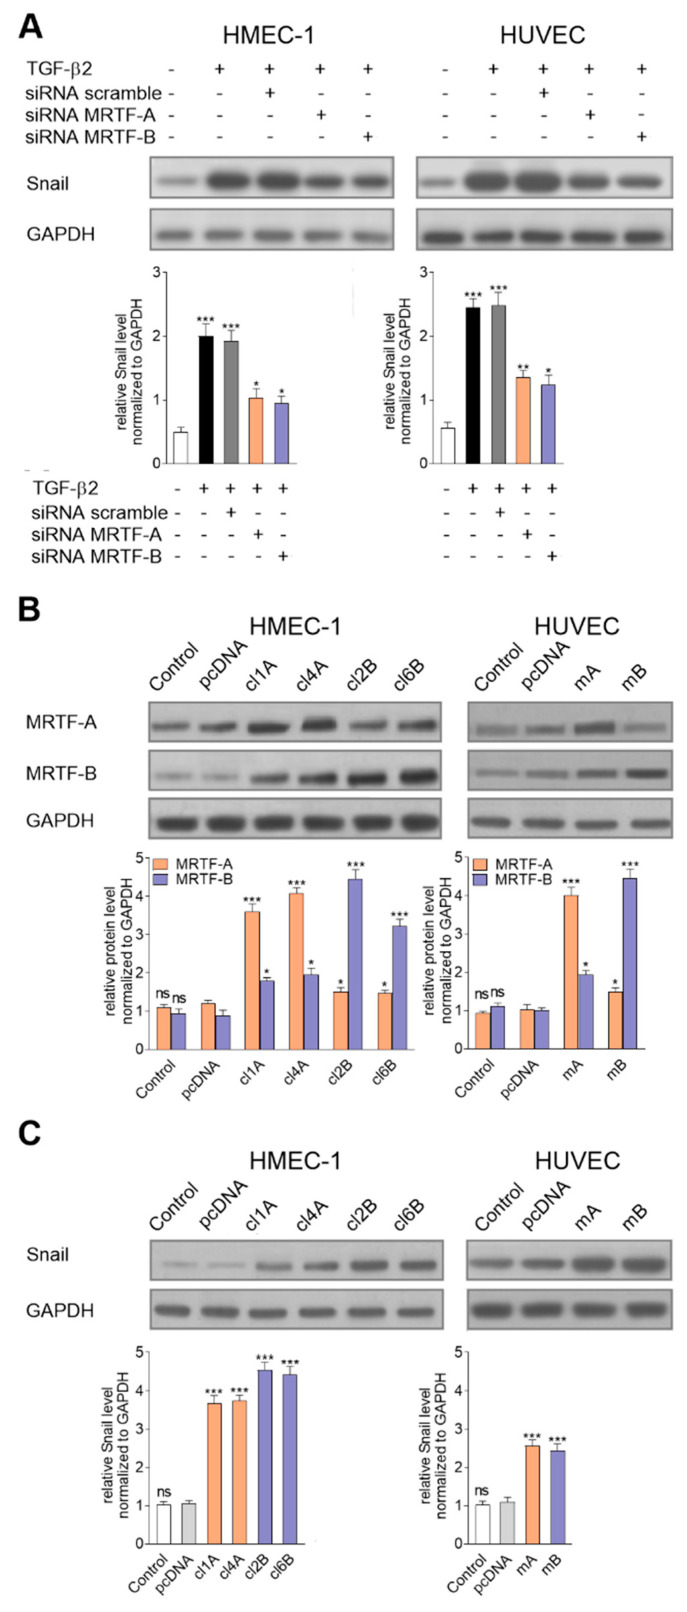
Figure 3 Regulation of the MRTFs caused modulation of snail expression. (A) Effect of MRTF-A or MRTF-B downregulation using siRNA treatment on the Snail level in TGF-β2-induced cells was analyzed by a Western blot assay. Subsequently, (B) MRTF-A (Clone 1—cl1A; Clone 4—cl4A) or MRTF-B (Clone 2—cl2B; Clone 6—cl6B) stably transfected HMEC-1 cells and MRTF-A (mA) or MRTF-B (mB) transiently transfected HUVECs were analyzed. Additionally, the control of the cell transfection clones with only an empty vector (pcDNA) was tested. (C) Next, a similar analysis of the Snail level was done. The protein level in each sample was determined using scan densitometry in compared to GAPDH (as the normalization). Blots are representative of three independent experiments. The results are presented as the means ± SD (N ≥ 3); * p < 0.05, ** p < 0.01, *** p < 0.001.
Figure 3 Regulation of the MRTFs caused modulation of snail expression. (A) Effect of MRTF-A or MRTF-B downregulation using siRNA treatment on the Snail level in TGF-β2-induced cells was analyzed by a Western blot assay. Subsequently, (B) MRTF-A (Clone 1—cl1A; Clone 4—cl4A) or MRTF-B (Clone 2—cl2B; Clone 6—cl6B) stably transfected HMEC-1 cells and MRTF-A (mA) or MRTF-B (mB) transiently transfected HUVECs were analyzed. Additionally, the control of the cell transfection clones with only an empty vector (pcDNA) was tested. (C) Next, a similar analysis of the Snail level was done. The protein level in each sample was determined using scan densitometry in compared to GAPDH (as the normalization). Blots are representative of three independent experiments. The results are presented as the means ± SD (N ≥ 3); * p < 0.05, ** p < 0.01, *** p < 0.001.CC BY · PubMed Central
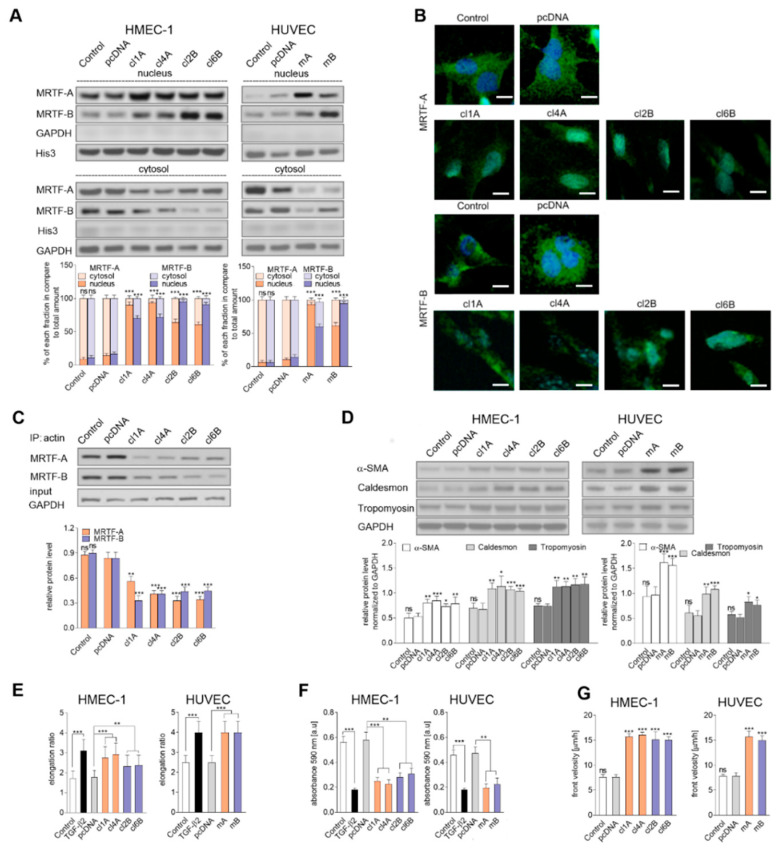
Figure 4 MRTF overexpression resulted in their activation, nuclear accumulation, and induction contraction and adhesion ability. (A) MRTF-A and MRTF-B localization were analyzed by Western blotting of the cytosol and nucleus fractions isolated from transfected cells. (B) The localization of MRTF-A and MRTF-B in the cellular compartments were analyzed using a confocal microscope. MRTFs were stained with antibodies conjugated with FITC. The white bar represents a 30 μm length. Representative images are shown. (C) Additionally, an IP assay of the cytosol fraction protein was applied. The MRTFs that interacted with the actin was precipitated with mouse anti-actin protein and subsequently analyzed by a Western blot assay with anti-rabbit MRTF-A or MRTF-B antibodies. (D) Contraction markers, such as α-SMA, caldesmon, and tropomyosin, were determined by Western blot analysis. For (A–D), the protein level in each sample was determined using scan densitometry. The results were normalized to GAPDH (cytosol and a nuclear fraction or total lysates) or Histone3 (His3, cytosol and nucleus fraction), or total the MRTFs (IP assay). Blots are representative of three independent experiments. The results are presented as the means ± SD (N = 3); * p < 0.05, ** p < 0.01, *** p < 0.001. (E) Changing in the cell morphology was observed under the microscope. Representative images are shown in the supplementary data (Figure S5) and a quantitative analysis of mean of the elongation ratio ((N = 3); ** p < 0.01, *** p < 0.001) was performed in Meta®Morph. Bars, 30 μm. (F) Subsequently, adhesion properties to collagen I was analyzed. Cells were placed on the collagen I pre-coated well for 1 h to adhere. After washing, the cells were stained, and the total cell-associated protein was determined using a microplate reader at 595 nm. The results are presented as the means ± SD (N = 5); ** p < 0.01, *** p < 0.001. (G) The effect of MRTF-A- or MRTF-B-overexpression on cell movement by the wound healing assay was studied. An appropriate cell number was seeded on 12-well plates pre-coated with collagen 1 (Coll). A total of 48 h later (after 4 h starvation in an FBS-free medium), a monolayer of confluent cells was wounded and images thereof were captured at the following times: 0, 2, 4, 6, 8, 10, 12, and 24 h. The results are given as the standard error of the mean of the cell front velocity ± SD (N = 4); *** p < 0.001.
Figure 4 MRTF overexpression resulted in their activation, nuclear accumulation, and induction contraction and adhesion ability. (A) MRTF-A and MRTF-B localization were analyzed by Western blotting of the cytosol and nucleus fractions isolated from transfected cells. (B) The localization of MRTF-A and MRTF-B in the cellular compartments were analyzed using a confocal microscope. MRTFs were stained with antibodies conjugated with FITC. The white bar represents a 30 μm length. Representative images are shown. (C) Additionally, an IP assay of the cytosol fraction protein was applied. The MRTFs that interacted with the actin was precipitated with mouse anti-actin protein and subsequently analyzed by a Western blot assay with anti-rabbit MRTF-A or MRTF-B antibodies. (D) Contraction markers, such as α-SMA, caldesmon, and tropomyosin, were determined by Western blot analysis. For (A–D), the protein level in each sample was determined using scan densitometry. The results were normalized to GAPDH (cytosol and a nuclear fraction or total lysates) or Histone3 (His3, cytosol and nucleus fraction), or total the MRTFs (IP assay). Blots are representative of three independent experiments. The results are presented as the means ± SD (N = 3); * p < 0.05, ** p < 0.01, *** p < 0.001. (E) Changing in the cell morphology was observed under the microscope. Representative images are shown in the supplementary data (Figure S5) and a quantitative analysis of mean of the elongation ratio ((N = 3); ** p < 0.01, *** p < 0.001) was performed in Meta®Morph. Bars, 30 μm. (F) Subsequently, adhesion properties to collagen I was analyzed. Cells were placed on the collagen I pre-coated well for 1 h to adhere. After washing, the cells were stained, and the total cell-associated protein was determined using a microplate reader at 595 nm. The results are presented as the means ± SD (N = 5); ** p < 0.01, *** p < 0.001. (G) The effect of MRTF-A- or MRTF-B-overexpression on cell movement by the wound healing assay was studied. An appropriate cell number was seeded on 12-well plates pre-coated with collagen 1 (Coll). A total of 48 h later (after 4 h starvation in an FBS-free medium), a monolayer of confluent cells was wounded and images thereof were captured at the following times: 0, 2, 4, 6, 8, 10, 12, and 24 h. The results are given as the standard error of the mean of the cell front velocity ± SD (N = 4); *** p < 0.001.CC BY · PubMed Central
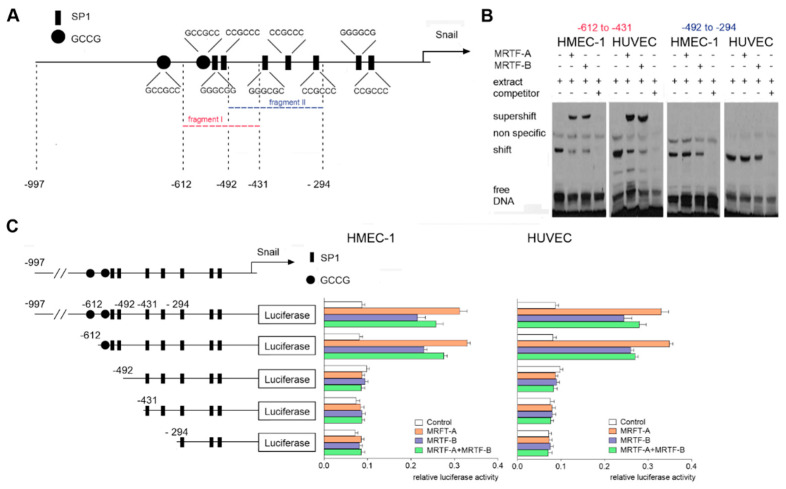
Figure 5 Binding of the MRTFs to the −612/−431 sequence of the human snail promoter. (A) Schematic map of the snail promoter with potential activation sites for the MRTFs. (B) Nuclear extracts prepared from the HMEC-1 cells or HUVECs were used for the EMSA assay. For competition experiments, unlabeled competitor oligonucleotides in 200-fold molar excess were used. For the supershift experiments, the rabbit monoclonal anti-MRTF-A or anti-MRTF-B antibodies were used. (C) Snail luciferase constructs were studied in MRTF-A-, MRTF-B-, or MRTF-A–MRTF-B-overexpressed HMEC-1 cells or HUVECs. The following constructs were used: −997/90, −612/90, −492/90, −431/90, and −294/90. Results are given as the standard error of the mean of the relative luciferase activity (N = 3).
Figure 5 Binding of the MRTFs to the −612/−431 sequence of the human snail promoter. (A) Schematic map of the snail promoter with potential activation sites for the MRTFs. (B) Nuclear extracts prepared from the HMEC-1 cells or HUVECs were used for the EMSA assay. For competition experiments, unlabeled competitor oligonucleotides in 200-fold molar excess were used. For the supershift experiments, the rabbit monoclonal anti-MRTF-A or anti-MRTF-B antibodies were used. (C) Snail luciferase constructs were studied in MRTF-A-, MRTF-B-, or MRTF-A–MRTF-B-overexpressed HMEC-1 cells or HUVECs. The following constructs were used: −997/90, −612/90, −492/90, −431/90, and −294/90. Results are given as the standard error of the mean of the relative luciferase activity (N = 3).CC BY · PubMed Central
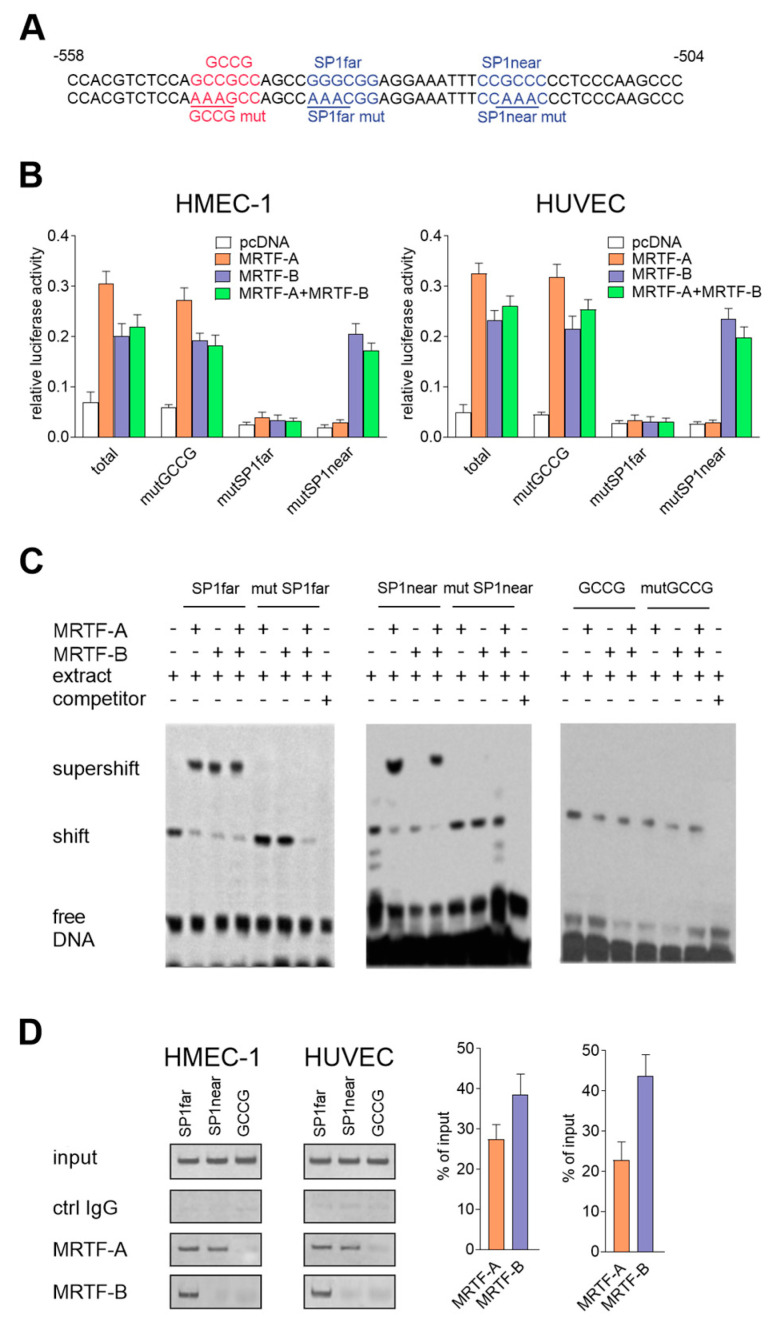
Figure 6 Role of the SP1 motifs in MRTFs-dependent snail expression regulation. (A) Sequences of mutated GCCG- and SP1-binding sites. Comparison of SP1 sequence localization in the mammalian snail promoter (B). Snail luciferase mutated constructs were studied in MRTF-A-, MRTF-B-, or MRTF-A–MRTF-B-overexpressed HMEC-1 cells or HUVECs. The constructs with mutGCCG, mutSP1far, and mutSP1near were mutated as indicated in the figure. The results are given as the standard error of the mean of the relative luciferase activity (N = 3). (C) Nuclear extracts prepared from the HMEC-1 cells were used for the EMSA assay. For competition experiments, unlabeled competitor oligonucleotides, wild-type, or mutated (mutGCCG, mutSP1far, mutSP1near) oligonucleotides were added. For the supershift experiments, the rabbit monoclonal anti-MRTF-A or anti-MRTF-B antibodies and isotype control were used. (D) The chip assay was performed in HMEC-1 cells. Chromatin was fragmented and immunoprecipitated with normal rabbit IgG, anti-MRTF-A, and anti-MRTF-B antibodies. Immunoprecipitated DNA was amplified by PCR and separated on an agarose gel and visualized. The representative inverted gel images are shown. The results are presented as the means ± SD (N = 3).
Figure 6 Role of the SP1 motifs in MRTFs-dependent snail expression regulation. (A) Sequences of mutated GCCG- and SP1-binding sites. Comparison of SP1 sequence localization in the mammalian snail promoter (B). Snail luciferase mutated constructs were studied in MRTF-A-, MRTF-B-, or MRTF-A–MRTF-B-overexpressed HMEC-1 cells or HUVECs. The constructs with mutGCCG, mutSP1far, and mutSP1near were mutated as indicated in the figure. The results are given as the standard error of the mean of the relative luciferase activity (N = 3). (C) Nuclear extracts prepared from the HMEC-1 cells were used for the EMSA assay. For competition experiments, unlabeled competitor oligonucleotides, wild-type, or mutated (mutGCCG, mutSP1far, mutSP1near) oligonucleotides were added. For the supershift experiments, the rabbit monoclonal anti-MRTF-A or anti-MRTF-B antibodies and isotype control were used. (D) The chip assay was performed in HMEC-1 cells. Chromatin was fragmented and immunoprecipitated with normal rabbit IgG, anti-MRTF-A, and anti-MRTF-B antibodies. Immunoprecipitated DNA was amplified by PCR and separated on an agarose gel and visualized. The representative inverted gel images are shown. The results are presented as the means ± SD (N = 3).CC BY · PubMed Central
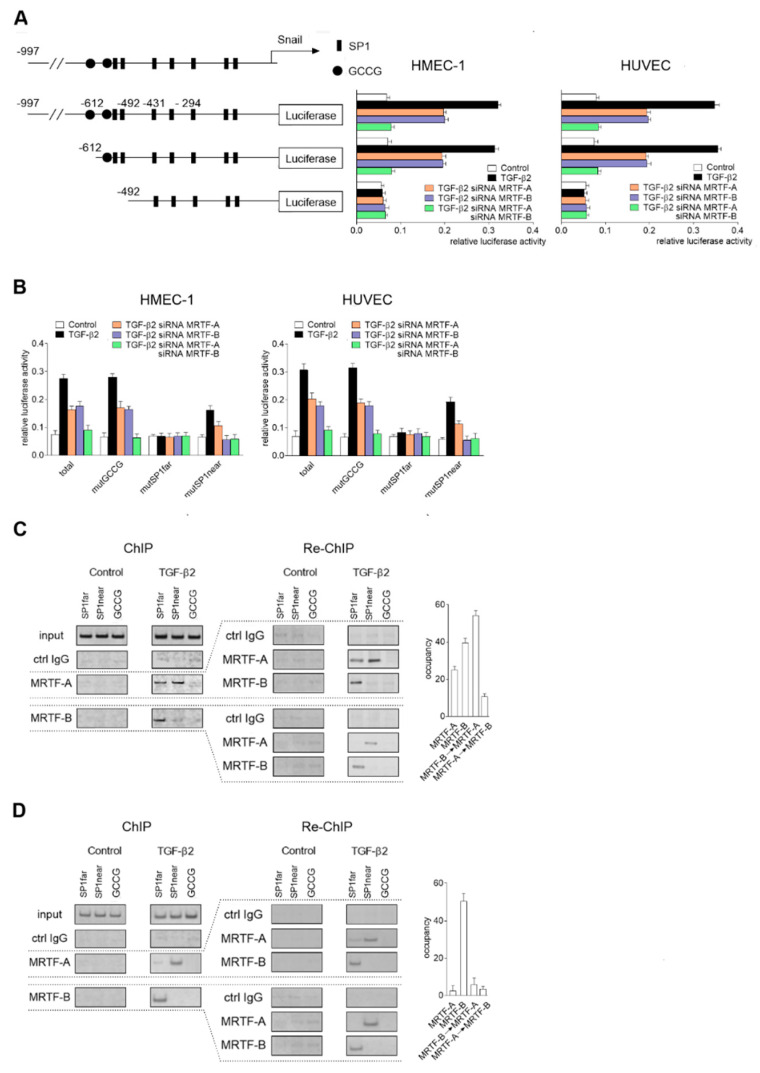
Figure 7 Direct MRTF-A and MRTF-B cooperation is required for complete regulation of snail expression in TGF-β2-induced EndMT. HMEC-1 cells and HUVECs were incubated with TGF-β2 (10 ng/mL) for 48 h. As the control, non-stimulated cells were used. Subsequently, (A) Snail luciferase constructs were studied in MRTF-A-, MRTF-B-, or both MRTFs silenced (MRTF-A–MRTF-B-silenced) HMEC-1 cells or HUVECs. The following constructs were used: −997/90, −612/90, and −492/90. (B) Snail luciferase constructs with mutations in CGGC or SP1 fragments were analyzed in MRTF-A-, MRTF-B-, or MRTF-A–MRTF-B-silenced HMEC-1 cells or HUVECs. The constructs with mutGCCG, mutSP1far, and mutSP1near were made as indicated previously. (C) HMEC-1 cells were incubated with TGF-β2 or TGF-β1 (10 ng/mL) for 24, 48, 60, and 72 h. As the control, non-induced cells were applied. Subsequently, the Snail luciferase construct (-997/90) was studied in MRTF-A-, MRTF-B-, or MRTF-A–MRTF-B-silenced HMEC-1 cells. For (A) and (B), results are given as the standard error of the mean of the relative luciferase activity (N = 3). Then, a chip assay was performed in the HMEC-1 cells incubated with TGF-β2 (10 ng/mL) for 48 (C) or 72 h (D). Chromatin was fragmented and immunoprecipitated with normal rabbit IgG, anti-MRTF-A, and anti-MRTF-B antibodies. For the Re-Chip assay, immunoprecipitated DNA was diluted 10 times and re-immunoprecipitated with normal rabbit IgG, anti-MRTF-A, and anti-MRTF-B antibodies. Immunoprecipitated and re-immunoprecipitated DNA was amplified by PCR and separated on an agarose gel and visualized. Representative inverted gel images are shown. The results are presented as the means ± SD (N = 3).
Figure 7 Direct MRTF-A and MRTF-B cooperation is required for complete regulation of snail expression in TGF-β2-induced EndMT. HMEC-1 cells and HUVECs were incubated with TGF-β2 (10 ng/mL) for 48 h. As the control, non-stimulated cells were used. Subsequently, (A) Snail luciferase constructs were studied in MRTF-A-, MRTF-B-, or both MRTFs silenced (MRTF-A–MRTF-B-silenced) HMEC-1 cells or HUVECs. The following constructs were used: −997/90, −612/90, and −492/90. (B) Snail luciferase constructs with mutations in CGGC or SP1 fragments were analyzed in MRTF-A-, MRTF-B-, or MRTF-A–MRTF-B-silenced HMEC-1 cells or HUVECs. The constructs with mutGCCG, mutSP1far, and mutSP1near were made as indicated previously. (C) HMEC-1 cells were incubated with TGF-β2 or TGF-β1 (10 ng/mL) for 24, 48, 60, and 72 h. As the control, non-induced cells were applied. Subsequently, the Snail luciferase construct (-997/90) was studied in MRTF-A-, MRTF-B-, or MRTF-A–MRTF-B-silenced HMEC-1 cells. For (A) and (B), results are given as the standard error of the mean of the relative luciferase activity (N = 3). Then, a chip assay was performed in the HMEC-1 cells incubated with TGF-β2 (10 ng/mL) for 48 (C) or 72 h (D). Chromatin was fragmented and immunoprecipitated with normal rabbit IgG, anti-MRTF-A, and anti-MRTF-B antibodies. For the Re-Chip assay, immunoprecipitated DNA was diluted 10 times and re-immunoprecipitated with normal rabbit IgG, anti-MRTF-A, and anti-MRTF-B antibodies. Immunoprecipitated and re-immunoprecipitated DNA was amplified by PCR and separated on an agarose gel and visualized. Representative inverted gel images are shown. The results are presented as the means ± SD (N = 3).CC BY · PubMed Central
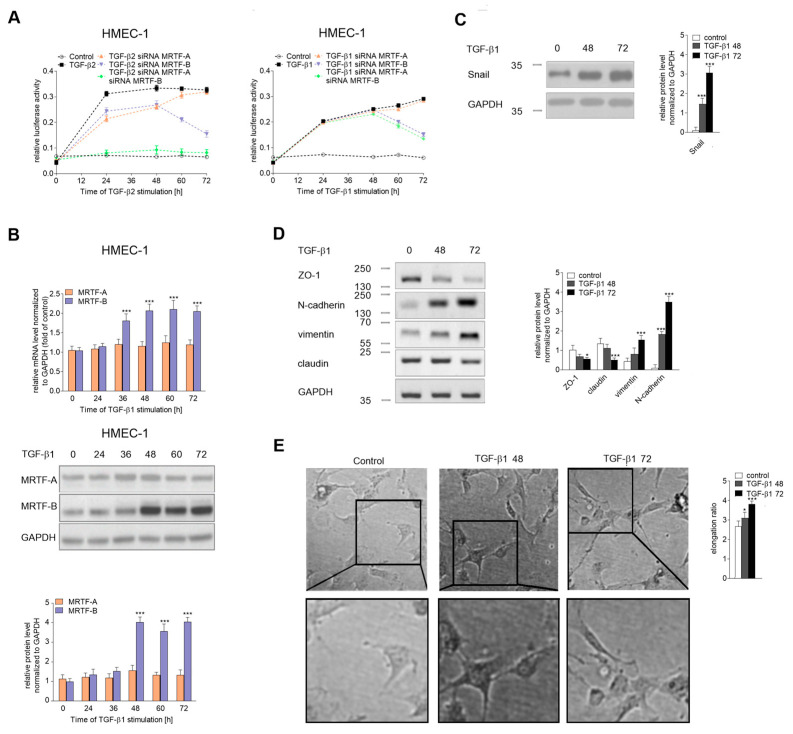
Figure 8 TGF-β1 induced slow EndMT in HMEC-1 cells. (A) HMEC-1 cells were incubated with TGF-β2 or TGF-β1 (10 ng/mL) for 24, 48, 60, or 72 h, or alone. Subsequently, the Snail luciferase construct (-997/90) was studied in MRTF-A-, MRTF-B-, or MRTF-A–MRTF-B-silenced HMEC-1 cells. Results are given as the standard error of the mean of the relative luciferase activity (N = 3). (B) Cells were incubated with TGF-β1 (10 ng/mL) for the indicated time points. Then, the expressions of the MRTFs were analyzed by real-time PCR and the protein level was determined by a Western blot analysis of the total lysate. Cells were incubated with TGF-β1 (10 ng/mL) for 48, 72 h, or alone. Subsequently, (C) the level of Snail and (D) the levels of EndMT markers were evaluated using Western blot assays with the appropriate antibodies. For the protein level analysis, the background was subtracted and the area for each protein peak was determined. Protein levels were normalized to GAPDH. (E) Cell morphology was observed under the microscope. Representative images are shown and quantitative analysis of the mean of elongation ratio from three independent experiments was performed in Meta®Morph. Bars, 30 μm. The results are presented as the means ± SD (N = 3); *** p < 0.001.
Figure 8 TGF-β1 induced slow EndMT in HMEC-1 cells. (A) HMEC-1 cells were incubated with TGF-β2 or TGF-β1 (10 ng/mL) for 24, 48, 60, or 72 h, or alone. Subsequently, the Snail luciferase construct (-997/90) was studied in MRTF-A-, MRTF-B-, or MRTF-A–MRTF-B-silenced HMEC-1 cells. Results are given as the standard error of the mean of the relative luciferase activity (N = 3). (B) Cells were incubated with TGF-β1 (10 ng/mL) for the indicated time points. Then, the expressions of the MRTFs were analyzed by real-time PCR and the protein level was determined by a Western blot analysis of the total lysate. Cells were incubated with TGF-β1 (10 ng/mL) for 48, 72 h, or alone. Subsequently, (C) the level of Snail and (D) the levels of EndMT markers were evaluated using Western blot assays with the appropriate antibodies. For the protein level analysis, the background was subtracted and the area for each protein peak was determined. Protein levels were normalized to GAPDH. (E) Cell morphology was observed under the microscope. Representative images are shown and quantitative analysis of the mean of elongation ratio from three independent experiments was performed in Meta®Morph. Bars, 30 μm. The results are presented as the means ± SD (N = 3); *** p < 0.001.CC BY · PubMed Central
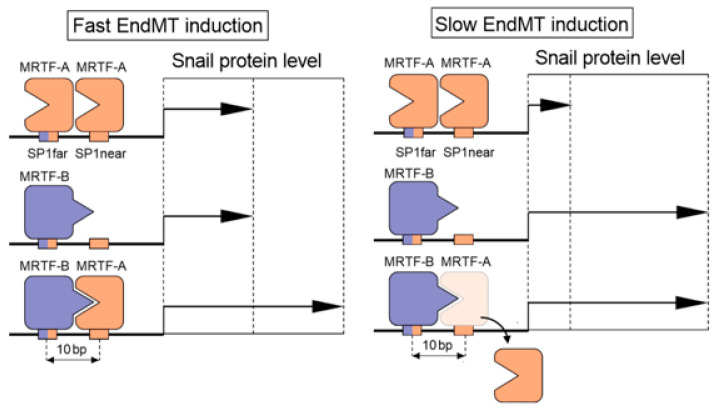
Figure 9 A schematic model of MRTF-induced snail expression via SP1 sites in EndMT.3.1. TGF-β stimulates the MRTFs’ upregulation in endothelial cells.
Figure 9 A schematic model of MRTF-induced snail expression via SP1 sites in EndMT.3.1. TGF-β stimulates the MRTFs’ upregulation in endothelial cells.CC BY · PubMed Central

Verification

Claims the paper makes

The claims and statistics of this paper haven’t been checked yet.

Run the check — free, no account needed. It reads the open-access text and checks the sources it cites.

A few free checks a day · papers already verified open instantly · results are public

Claims other papers make about this one

Each is checked against this paper’s own text: does it say what the citing paper says it does?

Self-check

Percentages, sums and reported differences re-computed from the paper’s own numbers.

The self-check needs the paper’s full text.

Citations

Cites

Show all 4 references

Research works printed but not linked: 50

  1. Cipriani, 2015, The Endothelial-mesenchymal Transition in Systemic Sclerosis Is Induced by Endothelin-1 and Transforming Growth Factor-beta and May Be Blocked by Macitentan, a Dual Endothelin-1 Receptor Antagonist, J. Rheumatol., 42, 1808, 10.3899/jrheum.150088 · DOI
  2. Chen, 2015, Endothelial-to-mesenchymal transition drives atherosclerosis progression, J. Clin. Investig., 125, 4514, 10.1172/JCI82719 · DOI
  3. Ranchoux, 2015, Endothelial-to-mesenchymal transition in pulmonary hypertension, Circulation, 131, 1006, 10.1161/CIRCULATIONAHA.114.008750 · DOI
  4. Li, 2010, Blockade of endothelial-mesenchymal transition by a Smad3 inhibitor delays the early development of streptozotocin-induced diabetic nephropathy, Diabetes, 59, 2612, 10.2337/db09-1631 · DOI
  5. Cao, 2014, Mechanisms of endothelial to mesenchymal transition in the retina in diabetes, Investig. Ophthalmol. Vis. Sci., 55, 7321, 10.1167/iovs.14-15167 · DOI
  6. Huang, 2013, Loss of caveolin-1 promotes endothelial-mesenchymal transition during sepsis: A membrane proteomic study, Int. J. Mol. Med., 32, 585, 10.3892/ijmm.2013.1432 · DOI
  7. Zeisberg, 2007, Discovery of endothelial to mesenchymal transition as a source for carcinoma-associated fibroblasts, Cancer Res., 67, 10123, 10.1158/0008-5472.CAN-07-3127 · DOI · Paper page
  8. Pinto, 2016, Endothelial Mesenchymal Transition: Comparative Analysis of Different Induction Methods, Biol. Proced. Online, 18, 10, 10.1186/s12575-016-0040-3 · DOI
  9. Zeisberg, 2007, Endothelial-to-mesenchymal transition contributes to cardiac fibrosis, Nat. Med., 13, 952, 10.1038/nm1613 · DOI
  10. Mihira, 2012, TGF-beta-induced mesenchymal transition of MS-1 endothelial cells requires Smad-dependent cooperative activation of Rho signals and MRTF-A, J. Biochem., 151, 145, 10.1093/jb/mvr121 · DOI
  11. Fan, 2007, Cell contact-dependent regulation of epithelial-myofibroblast transition via the rho-rho kinase-phospho-myosin pathway, Mol. Biol. Cell, 18, 1083, 10.1091/mbc.e06-07-0602 · DOI
  12. Medici, D. (2016). Endothelial-Mesenchymal Transition in Regenerative Medicine. Stem. Cells Int., 2016. · DOI
  13. Kokudo, 2008, Snail is required for TGFbeta-induced endothelial-mesenchymal transition of embryonic stem cell-derived endothelial cells, J. Cell. Sci., 121, 3317, 10.1242/jcs.028282 · DOI
  14. Lee, 2013, Snail as a potential target molecule in cardiac fibrosis: Paracrine action of endothelial cells on fibroblasts through snail and CTGF axis, Mol. Ther., 21, 1767, 10.1038/mt.2013.146 · DOI
  15. Zhang, 2016, Endothelial to mesenchymal transition contributes to arsenic-trioxide-induced cardiac fibrosis, Sci. Rep., 6, 33787, 10.1038/srep33787 · DOI
  16. Xu, 2015, Snail Is a Direct Target of Hypoxia-inducible Factor 1alpha (HIF1alpha) in Hypoxia-induced Endothelial to Mesenchymal Transition of Human Coronary Endothelial Cells, J. Biol. Chem., 290, 16653, 10.1074/jbc.M115.636944 · DOI
  17. Crider, 2011, Myocardin-related transcription factors A and B are key regulators of TGF-beta1-induced fibroblast to myofibroblast differentiation, J. Investig. Dermatol., 131, 2378, 10.1038/jid.2011.219 · DOI
  18. Morita, 2007, Reorganization of the actin cytoskeleton via transcriptional regulation of cytoskeletal/focal adhesion genes by myocardin-related transcription factors (MRTFs/MAL/MKLs), Exp. Cell Res., 313, 3432, 10.1016/j.yexcr.2007.07.008 · DOI
  19. Busche, 2008, Epithelial cell-cell contacts regulate SRF-mediated transcription via Rac-actin-MAL signalling, J. Cell. Sci., 121, 1025, 10.1242/jcs.014456 · DOI
  20. Morita, 2007, Dual roles of myocardin-related transcription factors in epithelial mesenchymal transition via slug induction and actin remodeling, J. Cell. Biol., 179, 1027, 10.1083/jcb.200708174 · DOI · Paper page
  21. Scharenberg, 2014, TGF-beta-induced differentiation into myofibroblasts involves specific regulation of two MKL1 isoforms, J. Cell. Sci., 127, 1079
  22. Masszi, 2010, Fate-determining mechanisms in epithelial-myofibroblast transition: Major inhibitory role for Smad3, J. Cell. Biol., 188, 383, 10.1083/jcb.200906155 · DOI
  23. Shiwen, X., Stratton, R., Nikitorowicz-Buniak, J., Ahmed-Abdi, B., Ponticos, M., Denton, C., Abraham, D., Takahashi, A., Suki, B., and Layne, M.D. (2015). A Role of Myocardin Related Transcription Factor-A (MRTF-A) in Scleroderma Related Fibrosis. PLoS ONE, 10. · DOI
  24. Ciszewski, 2017, The ILK-MMP9-MRTF axis is crucial for EndMT differentiation of endothelial cells in a tumor microenvironment, Biochim. Biophys. Acta Mol. Cell. Res., 1864, 2283, 10.1016/j.bbamcr.2017.09.004 · DOI
  25. Chen, 2015, Protective Effect of Spironolactone on Endothelial-to-Mesenchymal Transition in HUVECs via Notch Pathway, Cell. Physiol. Biochem., 36, 191, 10.1159/000374063 · DOI
  26. Geisberg, 2004, Quantitative sequential chromatin immunoprecipitation, a method for analyzing co-occupancy of proteins at genomic regions in vivo, Nucleic Acids Res., 32, e151, 10.1093/nar/gnh148 · DOI
  27. Medici, 2008, Snail and Slug promote epithelial-mesenchymal transition through beta-catenin-T-cell factor-4-dependent expression of transforming growth factor-beta3, Mol. Biol. Cell, 19, 4875, 10.1091/mbc.e08-05-0506 · DOI
  28. Wang, 2013, The Role of Snail in EMT and Tumorigenesis, Curr. Cancer Drug Targets, 13, 963, 10.2174/15680096113136660102 · DOI
  29. Nieto, 2016, Emt: 2016, Cell, 166, 21, 10.1016/j.cell.2016.06.028 · DOI · Paper page
  30. Medici, 2011, Transforming growth factor-beta2 promotes Snail-mediated endothelial-mesenchymal transition through convergence of Smad-dependent and Smad-independent signalling, Biochem. J., 437, 515, 10.1042/BJ20101500 · DOI
  31. Shirako, 2009, Cancer metastasis is accelerated through immunosuppression during Snail-induced EMT of cancer cells, Cancer Cell, 15, 195, 10.1016/j.ccr.2009.01.023 · DOI
  32. Zheng, 2015, Snail and Slug collaborate on EMT and tumor metastasis through miR-101-mediated EZH2 axis in oral tongue squamous cell carcinoma, Oncotarget, 6, 6797, 10.18632/oncotarget.3180 · DOI
  33. Nieto, 2005, The Snail genes as inducers of cell movement and survival: Implications in development and cancer, Development, 132, 3151, 10.1242/dev.01907 · DOI
  34. Nieto, 2002, The snail superfamily of zinc-finger transcription factors, Nat. Rev. Mol. Cell Biol., 3, 155, 10.1038/nrm757 · DOI · Paper page
  35. Lamouille, 2014, Molecular mechanisms of epithelial-mesenchymal transition, Nat. Rev. Mol. Cell Biol., 15, 178, 10.1038/nrm3758 · DOI · Paper page
  36. Seifert, 2017, Tightly controlled MRTF-A activity regulates epithelial differentiation during formation of mammary acini, Breast Cancer Res., 19, 68, 10.1186/s13058-017-0860-3 · DOI
  37. Katsura, 2016, MicroRNA-31 is a positive modulator of endothelial-mesenchymal transition and associated secretory phenotype induced by TGF-beta, Genes Cells, 21, 99, 10.1111/gtc.12323 · DOI
  38. Barbera, 2004, Regulation of Snail transcription during epithelial to mesenchymal transition of tumor cells, Oncogene, 23, 7345, 10.1038/sj.onc.1207990 · DOI
  39. Thuault, 2006, Transforming growth factor-beta employs HMGA2 to elicit epithelial-mesenchymal transition, J. Cell. Biol., 174, 175, 10.1083/jcb.200512110 · DOI
  40. Berx, 2005, Unraveling signalling cascades for the Snail family of transcription factors, Cell. Signal., 17, 535, 10.1016/j.cellsig.2004.10.011 · DOI
  41. Thuault, 2008, HMGA2 and Smads co-regulate SNAIL1 expression during induction of epithelial-to-mesenchymal transition, J. Biol. Chem., 283, 33437, 10.1074/jbc.M802016200 · DOI
  42. Zhou, 2004, Dual regulation of Snail by GSK-3beta-mediated phosphorylation in control of epithelial-mesenchymal transition, Nat. Cell Biol, 6, 931, 10.1038/ncb1173 · DOI · Paper page
  43. Wawro, 2017, Tubulin beta 3 and 4 are involved in the generation of early fibrotic stages, Cell. Signal., 38, 26, 10.1016/j.cellsig.2017.06.014 · DOI
  44. Azhar, 2009, Ligand-specific function of transforming growth factor beta in epithelial-mesenchymal transition in heart development, Dev. Dyn., 238, 431, 10.1002/dvdy.21854 · DOI
  45. Moonen, 2010, Endothelial progenitor cells give rise to pro-angiogenic smooth muscle-like progeny, Cardiovasc. Res., 86, 506, 10.1093/cvr/cvq012 · DOI
  46. Balcerczyk, 2016, Pharmacological inhibition of arginine and lysine methyltransferases induces nuclear abnormalities and suppresses angiogenesis in human endothelial cells, Biochem. Pharmacol., 121, 18, 10.1016/j.bcp.2016.09.013 · DOI
  47. Wawro, M.E., Sobierajska, K., Ciszewski, W.M., and Niewiarowska, J. (2019). Nonsteroidal Anti-Inflammatory Drugs Prevent Vincristine-Dependent Cancer-Associated Fibroblasts Formation. Int. J. Mol. Sci., 20. · DOI
  48. Sobierajska, 2019, Transforming Growth Factor-beta Receptor Internalization via Caveolae Is Regulated by Tubulin-beta2 and Tubulin-beta3 during Endothelial-Mesenchymal Transition, Am. J. Pathol., 189, 2531, 10.1016/j.ajpath.2019.08.004 · DOI
  49. Grayson, 1995, Synergistic interactions between heterologous upstream activation elements and specific TATA sequences in a muscle-specific promoter, Mol. Cell. Biol., 15, 1870, 10.1128/MCB.15.4.1870 · DOI
  50. Zarns, K., Desell, T., Nechaev, S., and Dhasarathy, A. (September, January 31). Searching the Human Genome for Snail and Slug With DNA@Home. Proceedings of the 11th IEEE International Conference eScience, Munich, Germany.

Cited by

Sorted by citations

Metadata

Authors
Sobierajska, K., Ciszewski, W. M., Macierzynska-Piotrowska, E., Klopocka, W., Przygodzka, P., Karakula, M., Pestka, K., Wawro, M. E., & Niewiarowska, J.
Affiliations
  • Medical University of Lodz (PL)
  • Department of Molecular Cell Mechanisms, Medical University of Lodz, 92-215 Lodz, Poland
  • Department of Biochemistry and Cell Biology, Cardinal Stefan Wyszynski University in Warsaw, 01-938 Warsaw, Poland
  • Institute for Medical Biology (PL)
Corresponding author
  • Sobierajska, Katarzyna
  • Niewiarowska, Jolanta
Venue
International Journal of Molecular Sciences
Publisher
MDPI AG
Published
2020-08-16
Volume
21
Issue
16
Pages
5875
ISSN
1422-0067 (ISSN-L)
OpenAlex
W3049627893
Cited by
21
References
4
Citations by year
2026: 4 · 2025: 2 · 2024: 4 · 2023: 5 · 2022: 2 · 2021: 4
FWCI
0.89
Type
journal article
Language
en
Open access
Locations
  • International Journal of Molecular Sciences (publishedVersion, cc-by)
  • PubMed Central (publishedVersion, cc-by)
  • PubMed (publishedVersion)
  • DOAJ (DOAJ: Directory of Open Access Journals) (submittedVersion, cc-by-sa)
Funders
Narodowe Centrum Badań i Rozwoju (MOMENTO Pol-Nor/209521/5/2013)
Topics
  • Life Sciences › Biochemistry, Genetics and Molecular Biology › Molecular Biology › TGF-β signaling in diseases
  • Health Sciences › Medicine › Oncology › Cancer Cells and Metastasis
  • Life Sciences › Biochemistry, Genetics and Molecular Biology › Molecular Biology › Kruppel-like factors research
Keywords
endothelial-to-mesenchymal transition, Snail transcription factor, MRTF, MRTF-A, MRTF-B, TGF-β1, TGF-beta2, metastasis, fibrosis
MeSH terms
Snail Family Transcription Factors, Cell Line, Humans, Promoter Regions, Genetic, Protein Binding, Transcription Factors, Transcriptional Activation, Endothelial Cells, Epithelial-Mesenchymal Transition

About these checks

Registry, retraction, Cites and statistics results are computed, not judged, with one exception: a printed reference that no index lists is read once by a model before it counts as a citation error. Claims are extracted by a model and kept only when their quote appears verbatim in the text; each cited source is then checked, with a model’s help, for whether it says what the claim relies on. Those verdicts can be wrong — read the claim’s quote and the cited source before relying on one.

Statistics and arithmetic are recomputed, not judged.

Confidence bands are shown only for fields calibrated on our annotated test set. None is calibrated yet, so no band is shown.

What counts as a claim ›How we measure confidence ›How we check this ›

Are you an author, or do you see a problem with this page? Request a review