

The DOI matches its Crossref record.
Assessment of Betulinic Acid Cytotoxicity and Mitochondrial Metabolism Impairment in a Human Melanoma Cell Line
Abstract
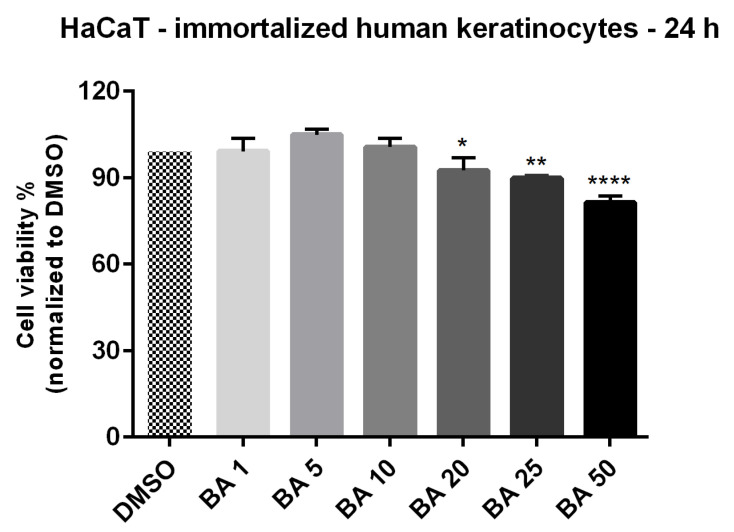
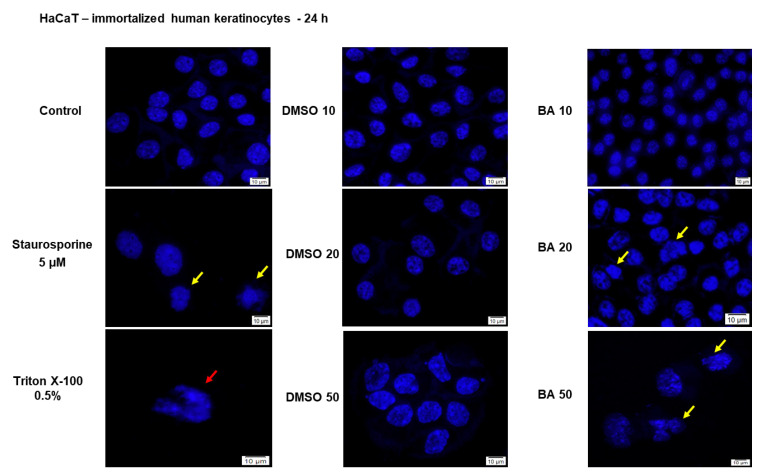
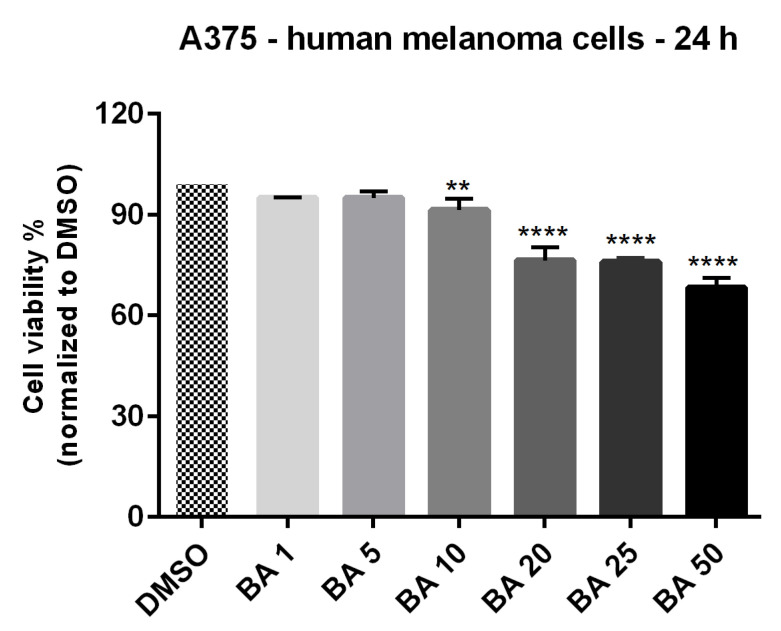
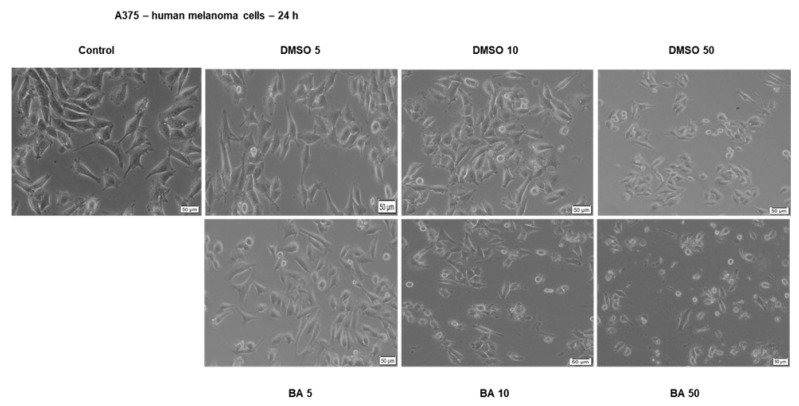
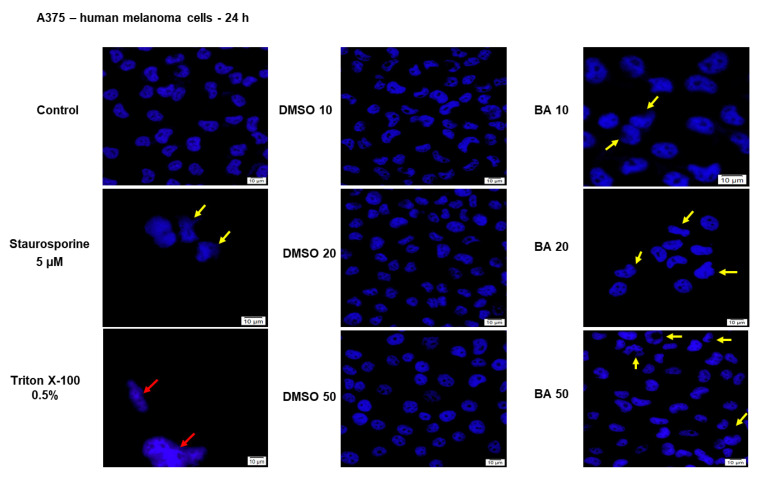
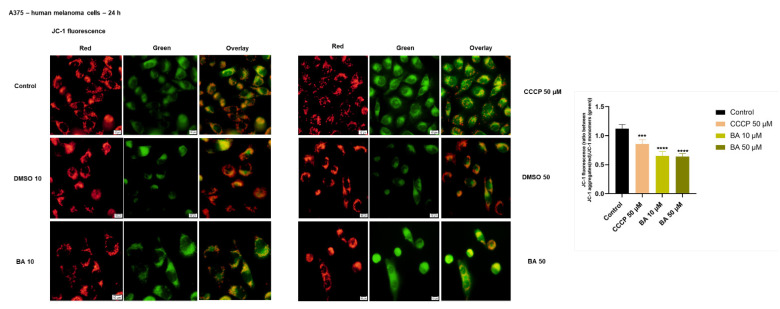
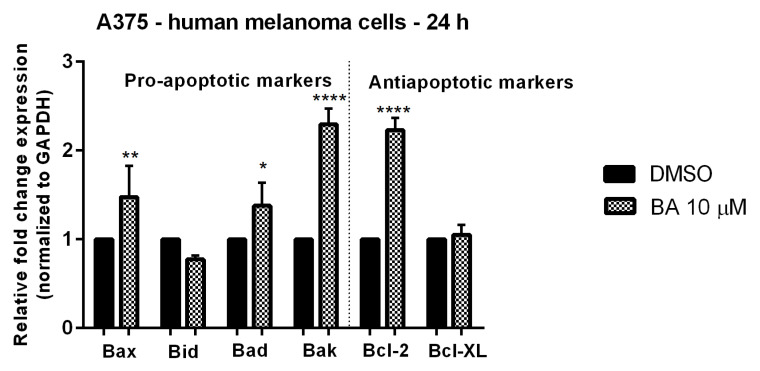
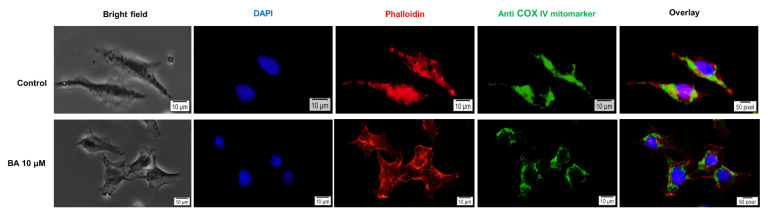
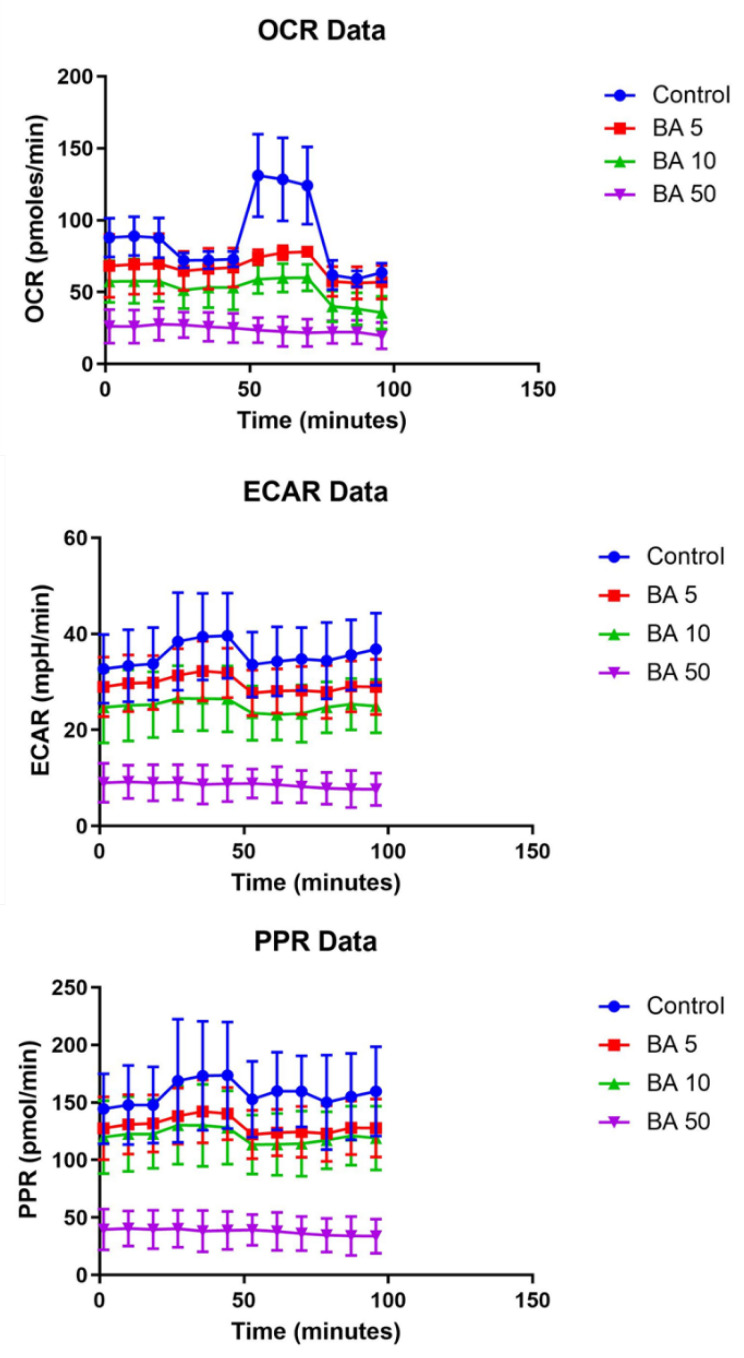
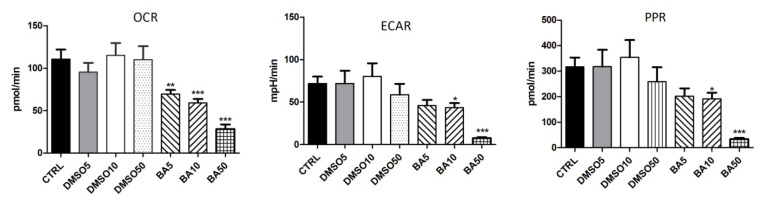
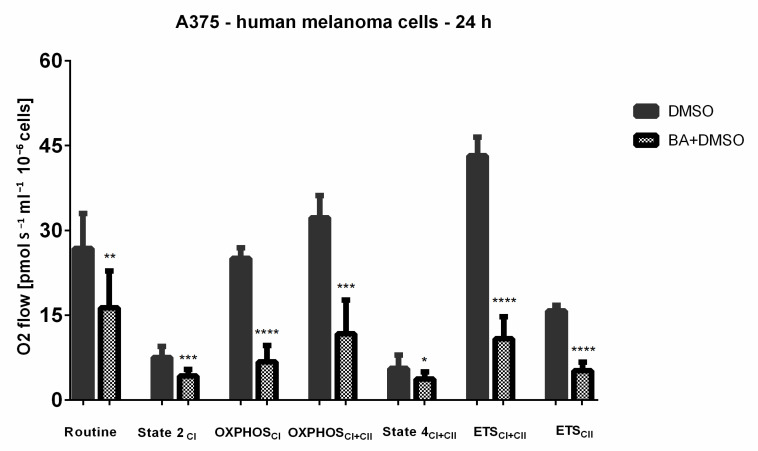
Melanoma represents one of the most aggressive and drug resistant skin cancers with poor prognosis in its advanced stages. Despite the increasing number of targeted therapies, novel approaches are needed to counteract both therapeutic resistance and the side effects of classic therapy. Betulinic acid (BA) is a bioactive phytocompound that has been reported to induce apoptosis in several types of cancers including melanomas; however, its effects on mitochondrial bioenergetics are less investigated. The present study performed in A375 human melanoma cells was aimed to characterize the effects of BA on mitochondrial bioenergetics and cellular behavior. BA demonstrated a dose-dependent inhibitory effect in both mitochondrial respiration and glycolysis in A375 melanoma cells and at sub-toxic concentrations (10 μM) induced mitochondrial dysfunction by eliciting a decrease in the mitochondrial membrane potential and changes in mitochondria morphology and localization. In addition, BA triggered a dose-dependent cytotoxic effect characterized by apoptotic features: morphological alterations (nuclear fragmentation, apoptotic bodies) and the upregulation of pro-apoptotic markers mRNA expression (Bax, Bad and Bak). BA represents a viable therapeutic option via a complex modulatory effect on mitochondrial metabolism that might be useful in advanced melanoma or as reliable strategy to counteract resistance to standard therapy.
Overview
The claims and statistics of this paper haven’t been checked yet.
Run the check — free, no account needed. It reads the open-access text and checks the sources it cites.
Integrity signals
Registry
Cites
Statistics
Figures
Verification
Claims the paper makes
The claims and statistics of this paper haven’t been checked yet.
Run the check — free, no account needed. It reads the open-access text and checks the sources it cites.
Claims other papers make about this one
Each is checked against this paper’s own text: does it say what the citing paper says it does?
In the citing paper
“The process is linked to an increase in proton leak across the inner mitochondrial membrane [55], leading to an increase of State 2 and State 4 [51].”
From Maceration, Soxhlet Extraction, and Steam Hydrodistillation of Anethum graveolens Seeds: Phytochemical Profiles and Cytotoxic Effects (2026) · cites this paper as [51]
In the citing paper
“Another observed effect that can also be linked to decreased OXPHOS, is the mitochondrial uncoupling-like effect [51].”
From Maceration, Soxhlet Extraction, and Steam Hydrodistillation of Anethum graveolens Seeds: Phytochemical Profiles and Cytotoxic Effects (2026) · cites this paper as [51]
In the citing paper
“The respective selectivity could be explained by different metabolic activity of the healthy cells compared to cancer cells [51].”
From Maceration, Soxhlet Extraction, and Steam Hydrodistillation of Anethum graveolens Seeds: Phytochemical Profiles and Cytotoxic Effects (2026) · cites this paper as [51]
Self-check
Percentages, sums and reported differences re-computed from the paper’s own numbers.
The self-check needs the paper’s full text.
Citations
Cites
No references could be resolved yet.
Research works printed but not linked: 65
- Prado, 2019, What’s New in Melanoma, Dermatol. Clin., 37, 159, 10.1016/j.det.2018.12.005 · DOI
- Gajos-Michniewicz, A., and Czyz, M. (2019). Role of miRNAs in Melanoma Metastasis. Cancers, 11. · DOI
- Coricovac, D., Dehelean, C., Moaca, E.A., Pinzaru, I., Bratu, T., Navolan, D., and Boruga, O. (2018). Cutaneous Melanoma-A Long Road from Experimental Models to Clinical Outcome: A Review. Int. J. Mol. Sci., 19. · DOI
- Wróbel, S., Przybyło, M., and Stępień, E. (2019). The Clinical Trial Landscape for Melanoma Therapies. J. Clin. Med., 8. · DOI
- Hosseini, 2017, Energy metabolism in skin cancers: A therapeutic perspective, Biochim. Biophys. Acta Bioenerg., 1858, 712, 10.1016/j.bbabio.2017.01.013 · DOI
- Srinivasan, 2017, Mitochondrial dysfunction and mitochondrial dynamics-The cancer connection, Biochim. Biophys. Acta Bioenerg., 1858, 602, 10.1016/j.bbabio.2017.01.004 · DOI
- Porporato, 2018, Mitochondrial metabolism and cancer, Cell Res., 28, 265, 10.1038/cr.2017.155 · DOI
- Avagliano, 2020, Metabolic Plasticity of Melanoma Cells and Their Crosstalk With Tumor Microenvironment, Front. Oncol., 10, 722, 10.3389/fonc.2020.00722 · DOI
- Lim, 2014, Targeting mitochondrial oxidative metabolism in melanoma causes metabolic compensation through glucose and glutamine uti-lization, Cancer Res., 74, 3535, 10.1158/0008-5472.CAN-13-2893-T · DOI
- Aminzadeh-Gohari, S., Weber, D.D., Catalano, L., Feichtinger, R.G., Kofler, B., and Lang, R. (2020). Targeting Mitochondria in Melanoma. Biomolecules, 10. · DOI
- Viale, 2015, Tumors and mitochondrial respiration: A neglected connection, Cancer Res., 75, 3685, 10.1158/0008-5472.CAN-15-0491 · DOI
- Theodosakis, 2014, Mitochondrial function in melanoma, Arch. Biochem. Biophys., 563, 56, 10.1016/j.abb.2014.06.028 · DOI
- Fulda, 2008, Betulinic acid for cancer treatment and prevention, Int. J. Mol. Sci., 9, 1096, 10.3390/ijms9061096 · DOI
- 2018, New Pharmacological Opportunities for Betulinic Acid, Planta Med., 84, 8, 10.1055/s-0043-123472 · DOI
- Sorriento, 2014, Targeting mitochondria as therapeutic strategy for metabolic disorders, Sci. World J., 2014, 604685, 10.1155/2014/604685 · DOI
- Gheorgheosu, 2014, Betulinic acid as a potent and complex antitumor phytochemical: A minireview, Anticancer Agents Med. Chem., 14, 936, 10.2174/1871520614666140223192148 · DOI
- Heiss, E.H., Kramer, M.P., Atanasov, A.G., Beres, H., Schachner, D., and Dirsch, V.M. (2014). Glycolytic switch in response to betulinic acid in non-cancer cells. PLoS ONE, 9. · DOI
- Tan, 2003, Betulinic acid-induced programmed cell death in human melanoma cells involves mitogen-activated protein kinase activation, Clin. Cancer Res., 9, 2866
- Zuco, 2002, Selective cytotoxicity of betulinic acid on tumor cell lines, but not on normal cells, Cancer Lett., 175, 17, 10.1016/S0304-3835(01)00718-2 · DOI
- Martins, 2017, Membrane damage by betulinic acid provides insights into cellular aging, Biochim. Biophys. Acta Gen. Subj., 1861, 3129, 10.1016/j.bbagen.2016.10.018 · DOI
- Surowiak, 2009, Betulinic acid exhibits stronger cytotoxic activity on the normal melanocyte NHEM-neo cell line than on drug-resistant and drug-sensitive MeWo melanoma cell lines, Mol. Med. Rep., 2, 543
- Nedopekina, 2017, Mitochondria-targeted betulinic and ursolic acid derivatives: Synthesis and anticancer activity, MedChemComm, 8, 1934, 10.1039/C7MD00248C · DOI
- Seca, A.M.L., and Pinto, D.C.G.A. (2018). Plant Secondary Metabolites as Anticancer Agents: Successes in Clinical Trials and Therapeutic Application. Int. J. Mol. Sci., 19. · DOI
- Dehelean, C.A., Marcovici, I., Soica, C., Mioc, M., Coricovac, D., Iurciuc, S., Cretu, O.M., and Pinzaru, I. (2021). Plant-Derived Anticancer Compounds as New Perspectives in Drug Discovery and Alternative Therapy. Molecules, 26. · DOI
- Ramsay, 2011, Mitochondrial metabolism inhibitors for cancer therapy, Pharm. Res., 28, 2731, 10.1007/s11095-011-0584-5 · DOI
- Vazquez, 2013, PGC1α expression defines a subset of human melanoma tumors with increased mitochondrial capacity and resistance to oxidative stress, Cancer Cell, 23, 287, 10.1016/j.ccr.2012.11.020 · DOI · Paper page
- Haq, 2013, Oncogenic BRAF regulates oxidative metabolism via PGC1α and MITF, Cancer Cell, 23, 302, 10.1016/j.ccr.2013.02.003 · DOI · Paper page
- Arozarena, 2017, Overcoming resistance to BRAF inhibitors, Ann. Transl. Med., 5, 387, 10.21037/atm.2017.06.09 · DOI
- Gopal, 2014, Inhibition of mTORC1/2 overcomes resistance to MAPK pathway inhibitors mediated by PGC1α and oxidative phosphorylation in melanoma, Cancer Res., 74, 7037, 10.1158/0008-5472.CAN-14-1392 · DOI
- Muntean, 2018, Modulation of Cancer Metabolism by Phytochemicals—A Brief Overview, Anticancer Agents Med. Chem., 18, 684, 10.2174/1871520617666171114102218 · DOI
- Sturza, 2018, Quercetin exerts an inhibitory effect on cellular bioenergetics of the B164A5 murine melanoma cell line, Mol. Cell. Biochem., 447, 103, 10.1007/s11010-018-3296-x · DOI
- Wang, 2020, Effects and mechanisms of fatty acid metabolism-mediated glycolysis regulated by betulinic acid-loaded nanoliposomes in colorectal cancer, Oncol. Rep., 44, 2595, 10.3892/or.2020.7787 · DOI
- Brand, 2011, Assessing mitochondrial dysfunction in cells, Biochem. J., 435, 297, 10.1042/BJ20110162 · DOI
- Weinberg, 2015, Targeting mitochondria metabolism for cancer therapy, Nat. Chem. Biol., 11, 9, 10.1038/nchembio.1712 · DOI
- Trotta, 2017, Disruption of mitochondrial electron transport chain function potentiates the pro-apoptotic effects of MAPK inhibition, J. Biol. Chem., 292, 11727, 10.1074/jbc.M117.786442 · DOI
- 2019, Resveratrol inhibits cancer cell proliferation by impairing oxidative phosphorylation and inducing oxidative stress, Toxicol. Appl. Pharmacol., 370, 65, 10.1016/j.taap.2019.03.008 · DOI
- Prestegarden, 2019, Inhibition of mitochondrial respiration prevents BRAF-mutant melanoma brain metastasis, Acta Neuropathol. Commun., 7, 55, 10.1186/s40478-019-0712-8 · DOI
- Baffy, 2017, Mitochondrial uncoupling in cancer cells: Liabilities and opportunities, Biochim. Biophys. Acta Bioenerg., 1858, 655, 10.1016/j.bbabio.2017.01.005 · DOI
- Brennan, 2006, Mitochondrial uncoupling, with low concentration FCCP, induces ROS-dependent cardioprotection independent of KATP channel activation, Cardiovasc. Res., 72, 313, 10.1016/j.cardiores.2006.07.019 · DOI · Paper page
- Lim, 2009, Uncoupling of oxidative phosphorylation by curcumin: Implication of its cellular mechanism of action, Biochem. Biophys. Res. Commun., 389, 187, 10.1016/j.bbrc.2009.08.121 · DOI
- Terada, 1990, Uncouplers of oxidative phosphorylation, Environ. Health Perspect., 87, 213, 10.1289/ehp.9087213 · DOI
- Pesta, 2012, High-resolution respirometry: OXPHOS protocols for human cells and permeabilized fibers from small biopsies of human muscle, Methods Mol. Biol., 810, 25, 10.1007/978-1-61779-382-0_3 · DOI
- Liebscher, 2016, In vitro anticancer activity of Betulinic acid and derivatives thereof on equine melanoma cell lines from grey horses and in vivo safety assessment of the compound NVX-207 in two horses, Chem. Biol. Interact., 246, 20, 10.1016/j.cbi.2016.01.002 · DOI
- Gheorgheosu, 2013, Betulinic acid suppresses NGAL-induced epithelial-to-mesenchymal transition in melanoma, Biol. Chem., 394, 773, 10.1515/hsz-2013-0106 · DOI
- Pisha, 1995, Discovery of betulinic acid as a selective inhibitor of human melanoma that functions by induction of apoptosis, Nat. Med., 1, 1046, 10.1038/nm1095-1046 · DOI
- Fulda, 1998, Activation of mitochondria and release of mitochondrial apoptogenic factors by betulinic acid, J. Biol. Chem., 273, 33942, 10.1074/jbc.273.51.33942 · DOI
- Anvekar, 2011, Born to be alive: A role for the BCL-2 family in melanoma tumor cell survival, apoptosis, and treatment, Front. Oncol., 1, 34, 10.3389/fonc.2011.00034 · DOI
- Brunelle, 2009, Control of mitochondrial apoptosis by the Bcl-2 family, J. Cell Sci., 122, 437, 10.1242/jcs.031682 · DOI
- Frederick, D.T., Fragomeni, R.A.S., Schalck, A., Ferreiro-Neira, I., Hoff, T., Cooper, Z.A., Haq, R., Panka, D.J., Kwong, L.N., and Davies, M.A. (2014). Clinical profiling of BCL-2 family members in the setting of BRAF inhibition offers a rationale for targeting de novo resistance using BH3 mimetics. PLoS ONE, 9. · DOI
- Kumar, 2018, Betulinic acid as apoptosis activator: Molecular mechanisms, mathematical modeling and chemical modifications, Life Sci., 209, 24, 10.1016/j.lfs.2018.07.056 · DOI
- Pandey, 2010, Betulinic acid suppresses STAT3 activation pathway through induction of protein tyrosine phosphatase SHP-1 in human multiple myeloma cells, Int. J. Cancer, 127, 282, 10.1002/ijc.25059 · DOI
- Xu, 2017, Betulinic acid induces apoptosis by regulating PI3K/Akt signaling and mitochondrial pathways in human cervical cancer cells, Int. J. Mol. Med., 40, 1669
- Wick, 1999, Betulinic acid-induced apoptosis in glioma cells: A sequential requirement for new protein synthesis, for-mation of reactive oxygen species, and caspase processing, J. Pharmacol. Exp. Ther., 289, 1306
- Fulda, 1997, Betulinic acid triggers CD95 (APO-1/Fas)- and p53-independent apoptosis via activation of caspases in neuroectodermal tumors, Cancer Res., 57, 4956
- Thurnher, 2003, Betulinic acid: A new cytotoxic com-pound against malignant head and neck cancer cells, Head Neck, 25, 732, 10.1002/hed.10231 · DOI
- Selzer, 2002, Betulinic acid-induced Mcl-1 expression in human melanoma—mode of action and functional significance, Mol. Med., 8, 877, 10.1007/BF03402094 · DOI
- Farcas, 2020, Controlled Synthesis and Characterization of Micrometric Single Crystalline Magnetite With Superparamagnetic Behavior and Cytocompatibility/Cytotoxicity Assessments, Front. Pharmacol., 11, 410, 10.3389/fphar.2020.00410 · DOI
- Maghiari, A.L., Coricovac, D., Pinzaru, I.A., Macașoi, I.G., Marcovici, I., Simu, S., Navolan, D., and Dehelean, C. (2020). High Concentrations of Aspartame Induce Pro-Angiogenic Effects in Ovo and Cytotoxic Effects in HT-29 Human Colorectal Carcinoma Cells. Nutrients, 12. · DOI
- Farcas, 2020, Thermosensitive Betulinic Acid-Loaded Magnetoliposomes: A Promising Antitumor Potential for Highly Aggressive Human Breast Adenocarcinoma Cells Under Hyperthermic Conditions, Int. J. Nanomed., 15, 8175, 10.2147/IJN.S269630 · DOI
- Pinzaru, I., Tanase, A., Enatescu, V., Coricovac, D., Bociort, F., Marcovici, I., Watz, C., Vlaia, L., Soica, C., and Dehelean, C. (2021). Proniosomal Gel for Topical Delivery of Rutin: Preparation, Physicochemical Characterization and In Vitro Toxicological Profile Using 3D Reconstructed Human Epidermis Tissue and 2D Cells. Antioxidants, 10. · DOI
- Sivandzade, 2019, Analysis of the Mitochondrial Membrane Potential Using the Cationic JC-1 Dye as a Sensitive Fluorescent Probe, Bio. Protoc., 9, e3128, 10.21769/BioProtoc.3128 · DOI · Paper page
- Duicu, 2015, Assessment of the effects of methylene blue on cellular bioenergetics in H9c2 cells, Rev. Chim., 66, 519
- Krumschnabel, 2015, High-Resolution Respirometry for Simultaneous Measurement of Oxygen and Hydrogen Peroxide Fluxes in Permeabilized Cells, Tissue Homogenate and Isolated Mitochondria, Biomolecules, 5, 1319, 10.3390/biom5031319 · DOI
- Hals, I.K., Bruerberg, S.G., Ma, Z., Scholz, H., Björklund, A., and Grill, V. (2015). Mitochondrial Respiration in Insulin-Producing β-Cells: General Characteristics and Adaptive Effects of Hypoxia. PLoS ONE, 10. · DOI
- Jang, 2017, Measurement of Mitochondrial Respiration and Motility in Acute Care: Sepsis, Trauma, and Poisoning, J. Intensive Care Med., 32, 86, 10.1177/0885066616658449 · DOI
Cited by
Goldiș, C., Racoviceanu, R., Negrea-Ghiulai, R., Mioc, A., Prodea, A., Atyim, E., Maksimovic, T., Lukinich-Gruia, A. T., Pricop, M.-A., & Șoica, C. (2026) · Molecules · doi:10.3390/molecules31183337
Self-citation
Metadata
- Authors
- Coricovac, D., Dehelean, C. A., Pinzaru, I., Mioc, A., Aburel, O.-M., Macasoi, I., Draghici, G. A., Petean, C., Soica, C., Boruga, M., Vlaicu, B., & Muntean, M. D.
- Venue
- International Journal of Molecular Sciences
- Publisher
- MDPI AG
- Published
- 2021-05-04
- Volume
- 22
- Issue
- 9
- Pages
- 4870
- ISSN
- 1422-0067
- PMC
- PMC8125295
- Cited by
- 56
- References
- 0
- Language
- en
- Funders
- Romanian National Authority for Scientific Research and Innovation, CNCS – UEFISCDI (PN-III-P1-1.1-PD-2016-1982)
- Romanian National Authority for Scientific Research and Innovation, CNCS –UEFISCDI (PN-III-P1-1.1-TE-2019-2134)
About these checks
Registry, retraction, Cites and statistics results are computed, not judged, with one exception: a printed reference that no index lists is read once by a model before it counts as a citation error. Claims are extracted by a model and kept only when their quote appears verbatim in the text; each cited source is then checked, with a model’s help, for whether it says what the claim relies on. Those verdicts can be wrong — read the claim’s quote and the cited source before relying on one.
Statistics and arithmetic are recomputed, not judged.
Confidence bands are shown only for fields calibrated on our annotated test set. None is calibrated yet, so no band is shown.
What counts as a claim ›How we measure confidence ›How we check this ›
Are you an author, or do you see a problem with this page? Request a review
How to cite
Cite CoChat for the checks on this page, and the paper for its own findings.
- This page
- CoChat. (2026). Citation check: Assessment of Betulinic Acid Cytotoxicity and Mitochondrial Metabolism Impairment in a Human Melanoma Cell Line. https://app.cochat.ai/papers/10.3390/ijms22094870
- The paper
- Coricovac, D., Dehelean, C. A., Pinzaru, I., Mioc, A., Aburel, O.-M., Macasoi, I., Draghici, G. A., Petean, C., Soica, C., Boruga, M., Vlaicu, B., & Muntean, M. D. (2021). Assessment of Betulinic Acid Cytotoxicity and Mitochondrial Metabolism Impairment in a Human Melanoma Cell Line. International Journal of Molecular Sciences. https://doi.org/10.3390/ijms22094870
Data sources
Bibliographic data: Semantic Scholar, OpenAlex, Crossref.
Contains information from the Semantic Scholar Academic Graph Datasets, made available under the ODC Attribution License (ODC-BY 1.0).
Semantic Scholar’s data is described in: Kinney, R., et al. (2023). The Semantic Scholar Open Data Platform. arXiv:2301.10140.
