

The DOI matches its Crossref record; 1 of the 1 references it cites were found in a registry or an index.
The Structural Flexibility of PR-10 Food Allergens
Abstract
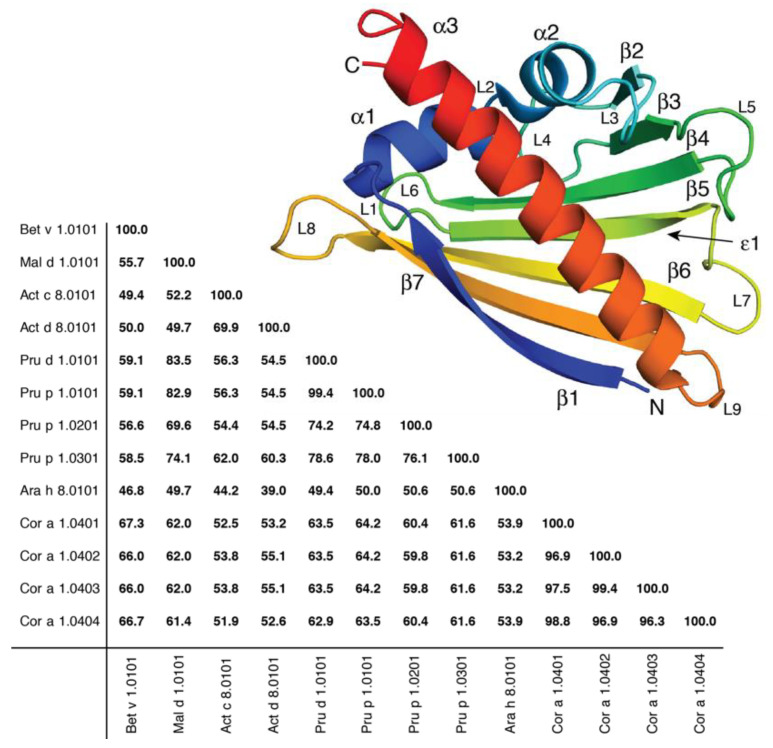
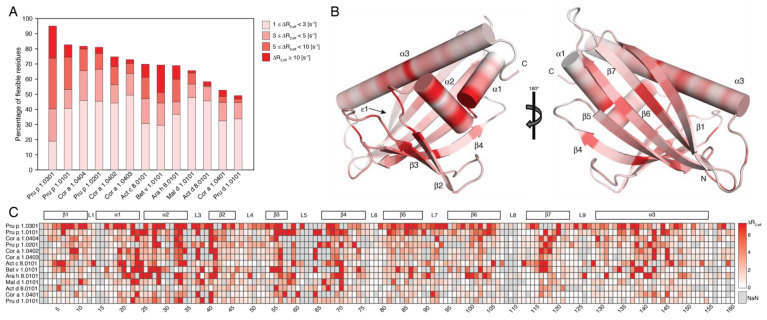
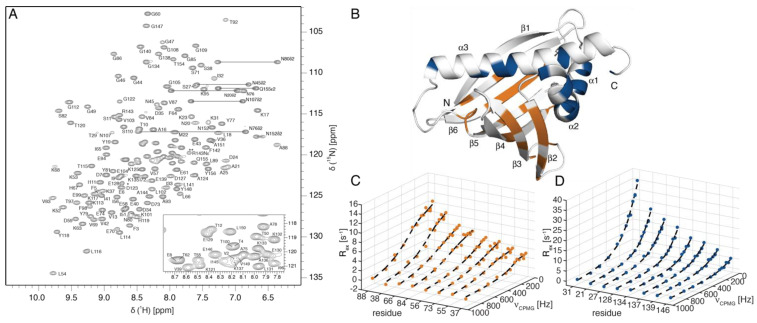
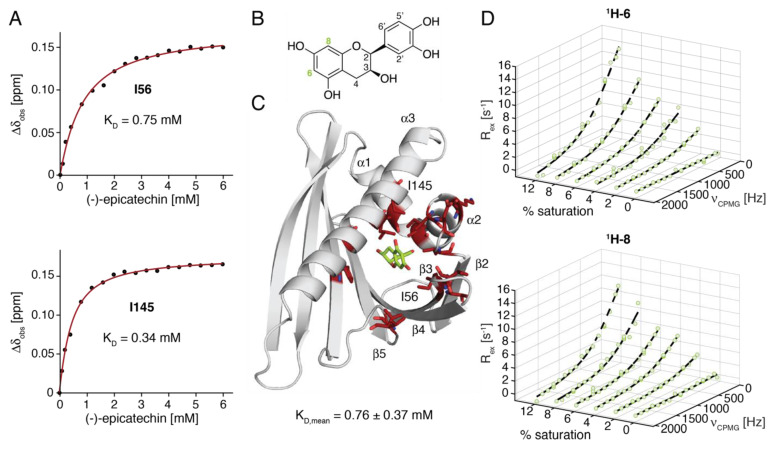
PR-10 proteins constitute a major cause of food allergic reactions. Birch-pollen-related food allergies are triggered by the immunologic cross-reactivity of IgE antibodies with structurally homologous PR-10 proteins that are present in birch pollen and various food sources. While the three-dimensional structures of PR-10 food allergens have been characterized in detail, only a few experimental studies have addressed the structural flexibility of these proteins. In this study, we analyze the millisecond-timescale structural flexibility of thirteen PR-10 proteins from prevalent plant food sources by NMR relaxation-dispersion spectroscopy, in a comparative manner. We show that all the allergens in this study have inherently flexible protein backbones in solution, yet the extent of the structural flexibility appears to be strikingly protein-specific (but not food-source-specific). Above-average flexibility is present in the two short helices, α1 and α2, which form a V-shaped support for the long C-terminal helix α3, and shape the internal ligand-binding cavity, which is characteristic for PR-10 proteins. An in-depth analysis of the NMR relaxation-dispersion data for the PR-10 allergen from peanut reveals the presence of at least two subglobal conformational transitions on the millisecond timescale, which may be related to the release of bound low-molecular-weight ligands from the internal cavity.
Overview
The claims and statistics of this paper haven’t been checked yet.
Run the check — free, no account needed. It reads the open-access text and checks the sources it cites.
Integrity signals
Registry
Cites
Statistics
Figures
Verification
Claims the paper makes
The claims and statistics of this paper haven’t been checked yet.
Run the check — free, no account needed. It reads the open-access text and checks the sources it cites.
Claims other papers make about this one
Each is checked against this paper’s own text: does it say what the citing paper says it does?
In the citing paper
“PR-10 proteins are characterized by their small molecular size (17-18 kDa) and structural features, including a hydrophobic cavity that binds small ligands [128,129].”
From Pollen–Food Allergy Syndrome: Allergens, Clinical Insights, Diagnostic and Therapeutic Challenges (2024) · cites this paper as [129]
In the citing paper
“Additionally, the lability of PR-10 proteins explains why cooked or processed forms of implicated foods are generally well-tolerated by most patients [129].”
From Pollen–Food Allergy Syndrome: Allergens, Clinical Insights, Diagnostic and Therapeutic Challenges (2024) · cites this paper as [129]
Self-check
Percentages, sums and reported differences re-computed from the paper’s own numbers.
The self-check needs the paper’s full text.
Citations
Cites
Common epitopes of birch pollen and apples—Studies by western and northern blot
Ebner, C., Birkner, T., Valenta, R., Rumpold, H., Breitenbach, M., Scheiner, O., & Kraft, D. (1991) · Journal of Allergy and Clinical Immunology · doi:10.1016/0091-6749(91)90152-e · Cited by 278
Research works printed but not linked: 50
- Mills, E.N.C., and Shewry, P.R. (2004). Plant Food Allergens, Blackwell Science. · DOI
- Pierpoint, 1994, Recommendations for naming plant pathogenesis-related proteins, Plant Mol. Biol. Rep., 12, 245, 10.1007/BF02668748 · DOI
- Rep, 2006, Significance of inducible defense-related proteins in infected plants, Annu. Rev. Phytopathol., 44, 135, 10.1146/annurev.phyto.44.070505.143425 · DOI
- Somssich, 1986, Rapid activation by fungal elicitor of genes encoding “pathogenesis-related” proteins in cultured parsley cells, Proc. Natl. Acad. Sci. USA, 83, 2427, 10.1073/pnas.83.8.2427 · DOI
- Fernandes, 2013, Structural and functional aspects of PR-10 proteins, FEBS J., 280, 1169, 10.1111/febs.12114 · DOI
- Ipsen, 1983, Isolation and immunochemical characterization of the major allergen of birch pollen (Betula verrucosa), J. Allergy Clin. Immunol., 72, 150, 10.1016/0091-6749(83)90523-7 · DOI
- Eriksson, 1982, Food hypersensitivity in patients with pollen allergy, Allergy, 37, 437, 10.1111/j.1398-9995.1982.tb02323.x · DOI
- Halmepuro, 1984, Cross-reactivity of IgE antibodies with allergens in birch pollen, fruits and vegetables, Int. Arch. Allergy Appl. Immunol., 74, 235, 10.1159/000233550 · DOI
- Ebner, 1995, Identification of allergens in fruits and vegetables: IgE cross-reactivities with the important birch pollen allergens Bet v 1 and Bet v 2 (birch profilin), J. Allergy Clin. Immunol., 95, 962, 10.1016/S0091-6749(95)70096-X · DOI
- Mari, 2005, The oral allergy syndrome: Improved diagnostic and treatment methods, Curr. Opin. Allergy Clin. Immunol., 5, 267, 10.1097/01.all.0000168793.27948.b0 · DOI
- Vogel, 2002, Severe oral allergy syndrome and anaphylactic reactions caused by a Bet v 1- related PR-10 protein in soybean, SAM22, J. Allergy Clin. Immunol., 110, 797, 10.1067/mai.2002.128946 · DOI
- Le, 2013, Anaphylactic versus mild reactions to hazelnut and apple in a birch-endemic area: Different sensitization profiles?, Int. Arch. Allergy Immunol., 160, 56, 10.1159/000339244 · DOI
- Zelniker, 2011, Birch pollen-related food allergy: Clinical aspects and the role of allergen-specific IgE and IgG4 antibodies, J. Allergy Clin. Immunol., 127, 616, 10.1016/j.jaci.2010.10.027 · DOI
- Eidelpes, 2021, Structure and zeatin binding of the peach allergen Pru p 1, J. Agric. Food Chem., 69, 8120, 10.1021/acs.jafc.1c01876 · DOI
- Morris, 2021, PR10/Bet v1-like proteins as novel contributors to plant biochemical diversity, ChemBioChem, 22, 264, 10.1002/cbic.202000354 · DOI
- Aglas, 2020, Ligand binding of PR-10 proteins with a particular focus on the Bet v 1 allergen family, Curr. Allergy Asthma Rep., 20, 25, 10.1007/s11882-020-00918-4 · DOI · Paper page
- Mogensen, 2002, The major birch allergen, Bet v 1, shows affinity for a broad spectrum of physiological ligands, J. Biol. Chem., 277, 23684, 10.1074/jbc.M202065200 · DOI
- Chruszcz, 2021, Allergens and their associated small molecule ligands-their dual role in sensitization, Allergy, 76, 2367, 10.1111/all.14861 · DOI
- Soh, 2019, Multiple roles of Bet v 1 ligands in allergen stabilization and modulation of endosomal protease activity, Allergy, 74, 2382, 10.1111/all.13948 · DOI
- Kamenik, 2021, Inverse relation between structural flexibility and IgE reactivity of Cor a 1 hazelnut allergens, Sci. Rep., 11, 4173, 10.1038/s41598-021-83705-z · DOI
- Grutsch, S., Fuchs, J.E., Ahammer, L., Kamenik, A.S., Liedl, K.R., and Tollinger, M. (2017). Conformational flexibility differentiates naturally occurring Bet v 1 isoforms. Int. J. Mol. Sci., 18. · DOI
- Grutsch, 2014, Ligand binding modulates the structural dynamics and compactness of the major birch pollen allergen, Biophys. J., 107, 2972, 10.1016/j.bpj.2014.10.062 · DOI
- Moraes, 2018, Structural basis for cross-reactivity and conformation fluctuation of the major beech pollen allergen Fag s 1, Sci. Rep., 8, 10512, 10.1038/s41598-018-28358-1 · DOI
- Hagemans, 2015, A script to highlight hydrophobicity and charge on protein surfaces, Front. Mol. Biosci., 2, 56, 10.3389/fmolb.2015.00056 · DOI
- Holm, 2011, Epitope grafting, re-creating a conformational Bet v 1 antibody epitope on the surface of the homologous apple allergen Mal d 1, J. Biol. Chem., 286, 17569, 10.1074/jbc.M110.194878 · DOI
- Roulias, 2014, Differences in the intrinsic immunogenicity and allergenicity of Bet v 1 and related food allergens revealed by site-directed mutagenesis, Allergy, 69, 208, 10.1111/all.12306 · DOI
- Schmalz, 2022, Isotype-specific binding patterns of serum antibodies to multiple conformational epitopes of Bet v 1, J. Allergy Clin. Immunol., 149, 1786, 10.1016/j.jaci.2021.10.026 · DOI
- Mittermaier, 2009, Observing biological dynamics at atomic resolution using NMR, Trends Biochem. Sci., 34, 601, 10.1016/j.tibs.2009.07.004 · DOI
- Hurlburt, 2013, Structure and function of the peanut panallergen Ara h 8, J. Biol. Chem., 288, 36890, 10.1074/jbc.M113.517797 · DOI
- Zeindl, 2020, NMR resonance assignments of the four isoforms of the hazelnut allergen Cor a 1.04, Biomol. NMR Assign., 14, 45, 10.1007/s12104-019-09918-6 · DOI
- Baldwin, 2014, An exact solution for R2,eff in CPMG experiments in the case of two site chemical exchange, J. Magn. Reson., 244, 114, 10.1016/j.jmr.2014.02.023 · DOI
- Fielding, 2005, Determination of protein-ligand binding affinity by NMR: Observations from serum albumin model systems, Magn. Reson. Chem., 43, 463, 10.1002/mrc.1574 · DOI
- Moschen, 2016, Measurement of ligand-target residence times by (1)H relaxation dispersion NMR spectroscopy, J. Med. Chem., 59, 10788, 10.1021/acs.jmedchem.6b01110 · DOI
- Kofler, 2012, Crystallographically mapped ligand binding differs in high and low IgE binding isoforms of birch pollen allergen bet v 1, J. Mol. Biol., 422, 109, 10.1016/j.jmb.2012.05.016 · DOI
- Kaczmarska, 2020, Structural bases for the allergenicity of Fra a 1.02 in strawberry fruits, J. Agric. Food Chem., 68, 10951, 10.1021/acs.jafc.9b05714 · DOI
- Casanal, 2013, The strawberry pathogenesis-related 10 (PR-10) Fra a proteins control flavonoid biosynthesis by binding to metabolic intermediates, J. Biol. Chem., 288, 35322, 10.1074/jbc.M113.501528 · DOI
- Pomes, 2020, Structural aspects of the allergen-antibody interaction, Front. Immunol., 11, 2067, 10.3389/fimmu.2020.02067 · DOI
- Ahammer, 2017, Structure of the major apple allergen Mal d 1, J. Agric. Food Chem., 65, 1606, 10.1021/acs.jafc.6b05752 · DOI
- Focke, 2004, Non-anaphylactic surface-exposed peptides of the major birch pollen allergen, Bet v 1, for preventive vaccination, Clin. Exp. Allergy, 34, 1525, 10.1111/j.1365-2222.2004.02081.x · DOI
- Zeindl, 2021, NMR resonance assignments of the PR-10 allergens Act c 8 and Act d 8 from golden and green kiwifruit, Biomol. NMR Assign., 15, 367, 10.1007/s12104-021-10031-w · DOI
- Ahammer, 2016, NMR resonance assignments of the major apple allergen Mal d 1, Biomol. NMR Assign., 10, 287, 10.1007/s12104-016-9685-8 · DOI
- Trimmel, 2019, NMR resonance assignments of the pathogenesis-related peach allergen Pru p 1.0101, Biomol. NMR Assign., 13, 127, 10.1007/s12104-018-9864-x · DOI
- Tollinger, 2001, Slow dynamics in folded and unfolded states of an SH3 domain, J. Am. Chem. Soc., 123, 11341, 10.1021/ja011300z · DOI
- Hansen, 2008, An improved 15N relaxation dispersion experiment for the measurement of millisecond time-scale dynamics in proteins, J. Phys. Chem. B, 112, 5898, 10.1021/jp074793o · DOI
- Delaglio, 1995, NMRPipe: A multidimensional spectral processing system based on UNIX pipes, J. Biomol. NMR, 6, 277, 10.1007/BF00197809 · DOI
- Williamson, 2013, Using chemical shift perturbation to characterise ligand binding, Prog. Nucl. Magn. Reson. Spectrosc., 73, 1, 10.1016/j.pnmrs.2013.02.001 · DOI
- Shen, 2010, De novo structure generation using chemical shifts for proteins with high-sequence identity but different folds, Protein Sci., 19, 349, 10.1002/pro.303 · DOI
- Shen, 2008, Consistent blind protein structure generation from NMR chemical shift data, Proc. Natl. Acad. Sci. USA, 105, 4685, 10.1073/pnas.0800256105 · DOI · Paper page
- Shen, 2009, De novo protein structure generation from incomplete chemical shift assignments, J. Biomol. NMR, 43, 63, 10.1007/s10858-008-9288-5 · DOI
- Sammut, C., and Webb, G.I. (2010). K-Means Clustering. Encyclopedia of Machine Learning, Springer. · DOI
Cited by
Sorted by citations
Pollen–Food Allergy Syndrome: Allergens, Clinical Insights, Diagnostic and Therapeutic Challenges
Haidar, L., Bănărescu, C. F., Uța, C., Moldovan, S. I., Zimbru, E.-L., Zimbru, R.-I., Ciurariu, E., Georgescu, M., & Panaitescu, C. (2024) · Applied Sciences · doi:10.3390/app15010066 · Cited by 21
Metadata
- Authors
- Führer, S., Unterhauser, J., Zeindl, R., Eidelpes, R., Fernández-Quintero, M. L., Liedl, K. R., & Tollinger, M.
- Venue
- International Journal of Molecular Sciences
- Publisher
- MDPI AG
- Published
- 2022-07-26
- Volume
- 23
- Issue
- 15
- Pages
- 8252
- ISSN
- 1422-0067
- PMC
- PMC9330593
- Cited by
- 24
- References
- 1
- Language
- en
- Funders
- Austrian Science Fund FWF (P26849 to M.T., P30737 to K.R.L., 858017)
- Austrian Research Promotion Agency FFG (P26849 to M.T., P30737 to K.R.L., 858017)
About these checks
Registry, retraction, Cites and statistics results are computed, not judged, with one exception: a printed reference that no index lists is read once by a model before it counts as a citation error. Claims are extracted by a model and kept only when their quote appears verbatim in the text; each cited source is then checked, with a model’s help, for whether it says what the claim relies on. Those verdicts can be wrong — read the claim’s quote and the cited source before relying on one.
Statistics and arithmetic are recomputed, not judged.
Confidence bands are shown only for fields calibrated on our annotated test set. None is calibrated yet, so no band is shown.
What counts as a claim ›How we measure confidence ›How we check this ›
Are you an author, or do you see a problem with this page? Request a review
How to cite
Cite CoChat for the checks on this page, and the paper for its own findings.
- This page
- CoChat. (2026). Citation check: The Structural Flexibility of PR-10 Food Allergens. https://app.cochat.ai/papers/10.3390/ijms23158252
- The paper
- Führer, S., Unterhauser, J., Zeindl, R., Eidelpes, R., Fernández-Quintero, M. L., Liedl, K. R., & Tollinger, M. (2022). The Structural Flexibility of PR-10 Food Allergens. International Journal of Molecular Sciences. https://doi.org/10.3390/ijms23158252
