

The DOI matches its Crossref record; 67 of the 67 references it cites were found in a registry or an index.
The Magnetosome Protein, Mms6 from Magnetospirillum magneticum Strain AMB-1, Is a Lipid-Activated Ferric Reductase
Open accessPublished version of a preprint
Abstract
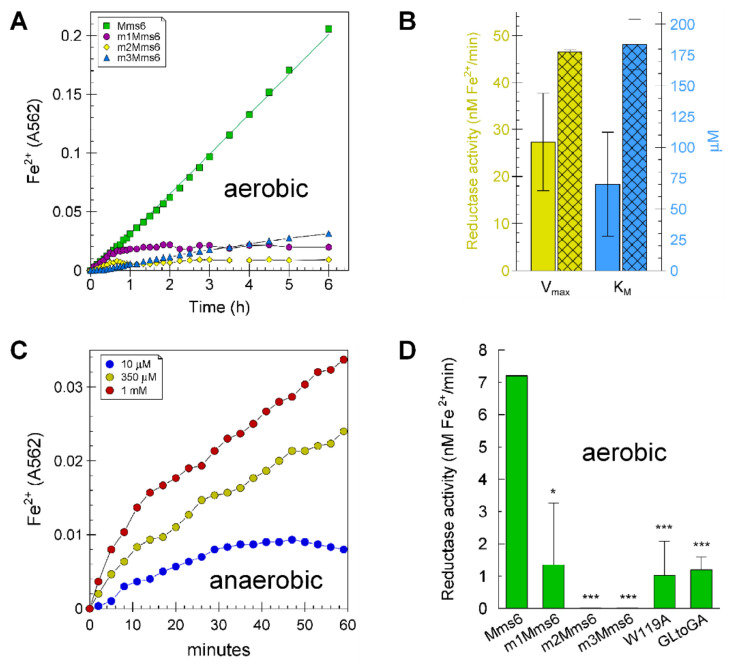
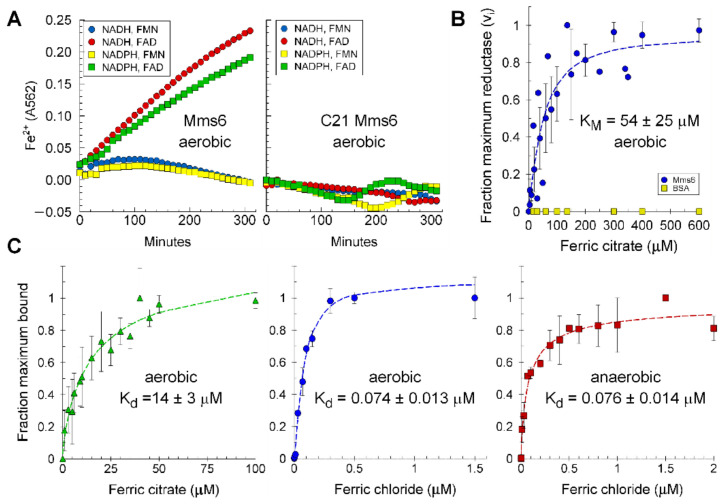
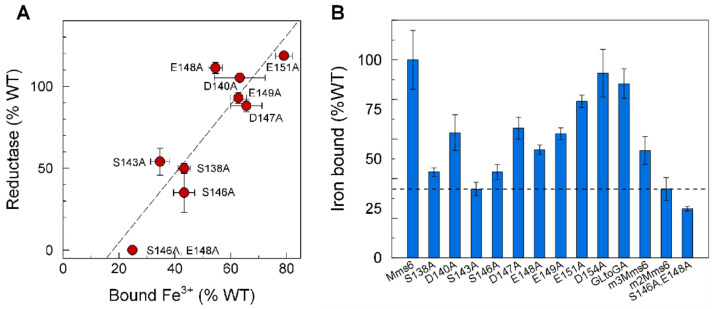
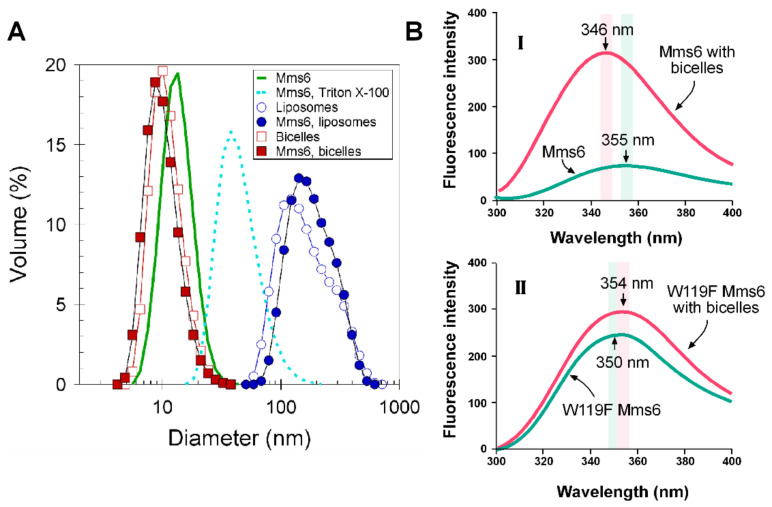
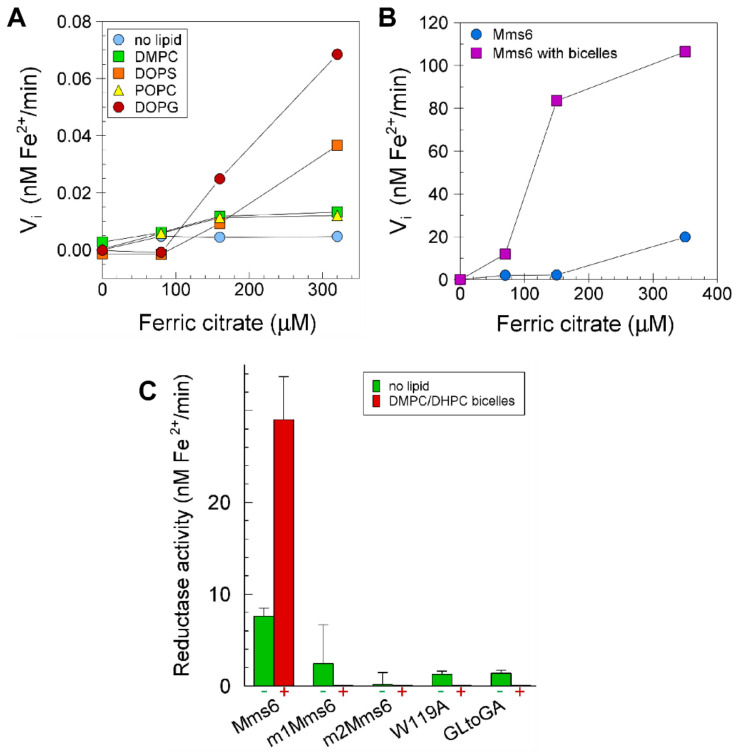
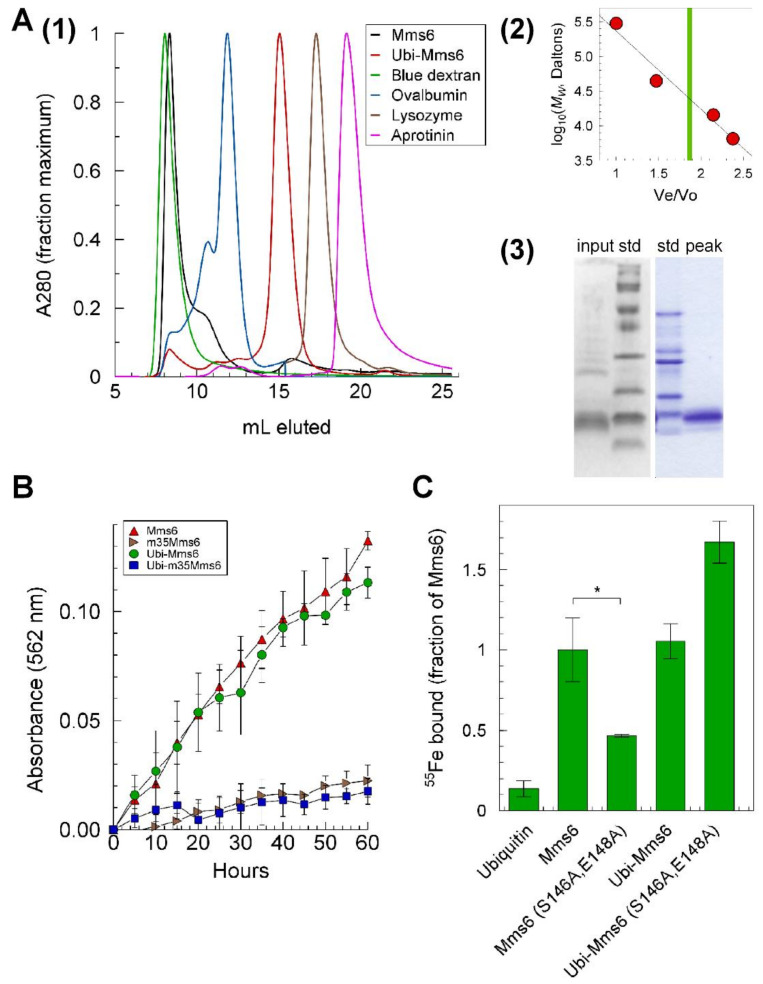
Magnetosomes of magnetotactic bacteria consist of magnetic nanocrystals with defined morphologies enclosed in vesicles originated from cytoplasmic membrane invaginations. Although many proteins are involved in creating magnetosomes, a single magnetosome protein, Mms6 from Magnetospirillum magneticum strain AMB-1, can direct the crystallization of magnetite nanoparticles in vitro. The in vivo role of Mms6 in magnetosome formation is debated, and the observation that Mms6 binds Fe3+ more tightly than Fe2+ raises the question of how, in a magnetosome environment dominated by Fe3+, Mms6 promotes the crystallization of magnetite, which contains both Fe3+ and Fe2+. Here we show that Mms6 is a ferric reductase that reduces Fe3+ to Fe2+ using NADH and FAD as electron donor and cofactor, respectively. Reductase activity is elevated when Mms6 is integrated into either liposomes or bicelles. Analysis of Mms6 mutants suggests that the C-terminal domain binds iron and the N-terminal domain contains the catalytic site. Although Mms6 forms multimers that involve C-terminal and N-terminal domain interactions, a fusion protein with ubiquitin remains a monomer and displays reductase activity, which suggests that the catalytic site is fully in the monomer. However, the quaternary structure of Mms6 appears to alter the iron binding characteristics of the C-terminal domain. These results are consistent with a hypothesis that Mms6, a membrane protein, promotes the formation of magnetite in vivo by a mechanism that involves reducing iron.
Overview
The claims and statistics of this paper haven’t been checked yet.
Run the check — free, no account needed. It reads the open-access text and checks the sources it cites.
Integrity signals
Registry
Cites
Statistics
Figures
Verification
Claims the paper makes
The claims and statistics of this paper haven’t been checked yet.
Run the check — free, no account needed. It reads the open-access text and checks the sources it cites.
Self-check
Percentages, sums and reported differences re-computed from the paper’s own numbers.
The self-check needs the paper’s full text.
Citations
Cites
Highly accurate protein structure prediction with AlphaFold
Jumper, J., Evans, R., Pritzel, A., Green, T., Figurnov, M., Ronneberger, O., Tunyasuvunakool, K., Bates, R., Žídek, A., Potapenko, A., et al. (2021) · Nature · doi:10.1038/s41586-021-03819-2 · Cited by 43,764
SWISS-MODEL: homology modelling of protein structures and complexes
Waterhouse, A., Bertoni, M., Bienert, S., Studer, G., Tauriello, G., Gumienny, R., Heer, F. T., de Beer, T. A. P., Rempfer, C., Bordoli, L., et al. (2018) · Nucleic Acids Research · doi:10.1093/nar/gky427 · Cited by 13,067
Varadi, M., Anyango, S., Deshpande, M., Nair, S., Natassia, C., Yordanova, G., Yuan, D., Stroe, O., Wood, G., Laydon, A., et al. (2022) · Nucleic Acids Research · doi:10.1093/nar/gkab1061 · Cited by 7,850
Ferrozine---a new spectrophotometric reagent for iron
Stookey, L. L. (1970) · Analytical Chemistry · doi:10.1021/ac60289a016 · Cited by 4,661
TM-align: a protein structure alignment algorithm based on the TM-score
Zhang, Y. (2005) · Nucleic Acids Research · doi:10.1093/nar/gki524 · Cited by 3,774
I-TASSER server: new development for protein structure and function predictions
Yang, J., & Zhang, Y. (2015) · Nucleic Acids Research · doi:10.1093/nar/gkv342 · Cited by 2,552
CASTp 3.0: computed atlas of surface topography of proteins
Tian, W., Chen, C., Lei, X., Zhao, J., & Liang, J. (2018) · Nucleic Acids Research · doi:10.1093/nar/gky473 · Cited by 2,389
Blakemore, R. P. (1975) · Science · doi:10.1126/science.170679 · Cited by 1,764
CASTp: Computed Atlas of Surface Topography of proteins
Binkowski, T. A. (2003) · Nucleic Acids Research · doi:10.1093/nar/gkg512 · Cited by 1,693
Average protein density is a molecular‐weight‐dependent function
Fischer, H., Polikarpov, I., & Craievich, A. F. (2004) · Protein Science · doi:10.1110/ps.04688204 · Cited by 697
Nucleation and growth of magnetite from solution
Baumgartner, J., Dey, A., Bomans, P. H. H., Le Coadou, C., Fratzl, P., Sommerdijk, N. A. J. M., & Faivre, D. (2013) · Nature Materials · doi:10.1038/nmat3558 · Cited by 673
Colorimetric ferrozine-based assay for the quantitation of iron in cultured cells
Riemer, J., Hoepken, H. H., Czerwinska, H., Robinson, S. R., & Dringen, R. (2004) · Analytical Biochemistry · doi:10.1016/j.ab.2004.03.049 · Cited by 563
Blakemore, R. P. (1982) · Annual Review of Microbiology · doi:10.1146/annurev.mi.36.100182.001245 · Cited by 563
Arakaki, A., Webb, J. M., & Matsunaga, T. (2003) · Journal of Biological Chemistry · doi:10.1074/jbc.m211729200 · Cited by 373
A G-quadruplex–containing RNA activates fluorescence in a GFP-like fluorophore
Huang, H., Suslov, N. B., Li, N.-S., Shelke, S. A., Evans, M. E., Koldobskaya, Y., Rice, P. A., & Piccirilli, J. A. (2014) · Nature Chemical Biology · doi:10.1038/nchembio.1561 · Cited by 349
Amemiya, Y., Arakaki, A., Staniland, S. S., Tanaka, T., & Matsunaga, T. (2007) · Biomaterials · doi:10.1016/j.biomaterials.2007.07.051 · Cited by 252
Fe3O4 precipitation in magnetotactic bacteria
Frankel, R. B., Papaefthymiou, G. C., Blakemore, R. P., & O'Brien, W. (1983) · Biochimica et Biophysica Acta (BBA) - Molecular Cell Research · doi:10.1016/0167-4889(83)90038-1 · Cited by 209
MMS6 Protein Regulates Crystal Morphology during Nano-sized Magnetite Biomineralization in Vivo
Tanaka, M., Mazuyama, E., Arakaki, A., & Matsunaga, T. (2010) · Journal of Biological Chemistry · doi:10.1074/jbc.m110.183434 · Cited by 194
Revisiting the mechanistic pathways for bacterial mediated synthesis of noble metal nanoparticles
Ali, J., Ali, N., Wang, L., Waseem, H., & Pan, G. (2019) · Journal of Microbiological Methods · doi:10.1016/j.mimet.2019.02.010 · Cited by 194
Self-citationProtein‐Mediated Synthesis of Uniform Superparamagnetic Magnetite Nanocrystals
Prozorov, T., Mallapragada, S. K., Narasimhan, B., Wang, L., Palo, P. E., Nilsen‐Hamilton, M., Williams, T. J., Bazylinski, D. A., Prozorov, R., & Canfield, P. C. (2007) · Advanced Functional Materials · doi:10.1002/adfm.200600448 · Cited by 167
Self-citationSelection and Identification of a DNA Aptamer Targeted to Vibrio parahemolyticus
Duan, N., Wu, S., Chen, X., Huang, Y., & Wang, Z. (2012) · Journal of Agricultural and Food Chemistry · doi:10.1021/jf300395z · Cited by 146
Lohße, A., Borg, S., Raschdorf, O., Kolinko, I., Tompa, É., Pósfai, M., Faivre, D., Baumgartner, J., & Schüler, D. (2014) · Journal of Bacteriology · doi:10.1128/jb.01716-14 · Cited by 130
Bioinspired synthesis of magnetite nanoparticles
Mirabello, G., Lenders, J. J. M., & Sommerdijk, N. A. J. M. (2016) · Chemical Society Reviews · doi:10.1039/c6cs00432f · Cited by 129
Fdez-Gubieda, M. L., Muela, A., Alonso, J. A., Garcı́a-Prieto, A., Olivi, L., Fernández‐Pacheco, R., & Barandiaran, J. M. (2013) · ACS Nano · doi:10.1021/nn3059983 · Cited by 126
Poget, S. F., & Girvin, M. E. (2007) · Biochimica et Biophysica Acta (BBA) - Biomembranes · doi:10.1016/j.bbamem.2007.09.006 · Cited by 123
Rapid magnetosome formation shown by real-time x-ray magnetic circular dichroism
Staniland, S. S., Ward, B., Harrison, A., van der Laan, G., & Telling, N. D. (2007) · Proceedings of the National Academy of Sciences · doi:10.1073/pnas.0704879104 · Cited by 111
Zhang, X., Krause, K., Xénarios, I., Soldati, T., & Boeckmann, B. (2013) · PLoS ONE · doi:10.1371/journal.pone.0058126 · Cited by 105
Reduction and mobilization of iron by a NAD(P)H: flavin oxidoreductase from Escherichia coli
Covès, J., & Fontecave, M. (1993) · European Journal of Biochemistry · doi:10.1111/j.1432-1033.1993.tb17591.x · Cited by 105
Ferric iron reductases and their contribution to unicellular ferrous iron uptake
Cain, T. J., & Smith, A. T. (2021) · Journal of Inorganic Biochemistry · doi:10.1016/j.jinorgbio.2021.111407 · Cited by 96
Wang, L., Prozorov, T., Palo, P. E., Liu, X., Vaknin, D., Prozorov, R., Mallapragada, S. K., & Nilsen‐Hamilton, M. (2011) · Biomacromolecules · doi:10.1021/bm201278u · Cited by 88
Self-citationChen, H., Sun, J., Wang, Z., Zhou, Y., Lou, Z., Chen, B., Wang, P., Guo, Z., Tang, H. R., Ma, J., et al. (2018) · ACS Applied Materials & Interfaces · doi:10.1021/acsami.8b17427 · Cited by 85
Mazoch, J., Tesařı́k, R., Sedláček, V., Kučera, I., & Tuřánek, J. (2004) · European Journal of Biochemistry · doi:10.1046/j.1432-1033.2003.03957.x · Cited by 82
Lipid Concentration and Molar Ratio Boundaries for the Use of Isotropic Bicelles
Beaugrand, M., Arnold, A. A., Hénin, J., Warschawski, D. E., Williamson, P. T. F., & Marcotte, I. (2014) · Langmuir · doi:10.1021/la5004353 · Cited by 76
Arakaki, A., Yamagishi, A., Fukuyo, A., Tanaka, M., & Matsunaga, T. (2014) · Molecular Microbiology · doi:10.1111/mmi.12683 · Cited by 74
Ferric reductase activity in Azotobacter vinelandii and its inhibition by Zn2+
Huyer, M., & Page, W. J. (1989) · Journal of Bacteriology · doi:10.1128/jb.171.7.4031-4037.1989 · Cited by 68
Kaufmann, F., & Lovley, D. R. (2001) · Journal of Bacteriology · doi:10.1128/jb.183.15.4468-4476.2001 · Cited by 61
Vadas, A., Monbouquette, H. G., Johnson, E., & Schröder, I. (1999) · Journal of Biological Chemistry · doi:10.1074/jbc.274.51.36715 · Cited by 61
Lohße, A., Kolinko, I., Raschdorf, O., Uebe, R., Borg, S., Brachmann, A., Plitzko, J. M., Müller, R., Zhang, Y., & Schüler, D. (2016) · Applied and Environmental Microbiology · doi:10.1128/aem.03860-15 · Cited by 60
Supramolecular SNARE assembly precedes hemifusion in SNARE-mediated membrane fusion
Lu, X., Zhang, Y., & Shin, Y. (2008) · Nature Structural & Molecular Biology · doi:10.1038/nsmb.1433 · Cited by 58
Noguchi, Y., Fujiwara, T., Yoshimatsu, K., & Fukumori, Y. (1999) · Journal of Bacteriology · doi:10.1128/jb.181.7.2142-2147.1999 · Cited by 53
Ferric reductases of Legionella pneumophila
Poch, M. A. L., & Johnson, W. (1993) · BioMetals · doi:10.1007/bf00140111 · Cited by 49
A Compass To Boost Navigation: Cell Biology of Bacterial Magnetotaxis
Müller, F. D., Schüler, D., & Pfeiffer, D. (2020) · Journal of Bacteriology · doi:10.1128/jb.00398-20 · Cited by 48
Ferric iron reductase of Rhodopseudomonas sphaeroides
Moody, M. D., & Dailey, H. A. (1985) · Journal of Bacteriology · doi:10.1128/jb.163.3.1120-1125.1985 · Cited by 47
Ferredoxin-NADP + Reductase from Pseudomonas putida Functions as a Ferric Reductase
Yeom, J., Jeon, C. O., Madsen, E. L., & Park, W. (2008) · Journal of Bacteriology · doi:10.1128/jb.01473-08 · Cited by 47
Rawlings, A. E., Bramble, J. P., Hounslow, A. M., Williamson, M. P., Monnington, A. E., Cooke, D. J., & Staniland, S. S. (2016) · Chemistry - A European Journal · doi:10.1002/chem.201600322 · Cited by 46
Gaines, C. G., Lodge, J., Arceneaux, J. E. L., & Byers, B. R. (1981) · Journal of Bacteriology · doi:10.1128/jb.148.2.527-533.1981 · Cited by 42
Magnetosome dynamics in magnetotactic bacteria
Ofer, S., Nowik, I., Bauminger, E. R., Papaefthymiou, G. C., Frankel, R. B., & Blakemore, R. P. (1984) · Biophysical Journal · doi:10.1016/s0006-3495(84)83998-3 · Cited by 42
Shen, C., Menon, R., Das, D., Bansal, N., Nahar, N., Guduru, N., Jaegle, S., Peckham, J., & Reshetnyak, Y. K. (2008) · Proteins Structure Function and Bioinformatics · doi:10.1002/prot.21857 · Cited by 41
Soluble and membrane-bound ferrisiderophore reductases of Escherichia coli K-12
Fischer, E., Strehlow, B., Hartz, D., & Braun, V. (1990) · Archives of Microbiology · doi:10.1007/bf00249001 · Cited by 39
Hasan, N., & Nester, E. W. (1978) · Journal of Biological Chemistry · doi:10.1016/s0021-9258(17)34645-8 · Cited by 38
Bird, S. M., Rawlings, A. E., Galloway, J. M., & Staniland, S. S. (2016) · RSC Advances · doi:10.1039/c5ra16469a · Cited by 38
Taking a hard line with biotemplating: cobalt-doped magnetite magnetic nanoparticle arrays
Bird, S. M., Galloway, J. M., Rawlings, A. E., Bramble, J. P., & Staniland, S. S. (2015) · Nanoscale · doi:10.1039/c5nr00651a · Cited by 35
Wang, W., Bu, W., Wang, L., Palo, P. E., Mallapragada, S. K., Nilsen‐Hamilton, M., & Vaknin, D. (2012) · Langmuir · doi:10.1021/la205074n · Cited by 30
Self-citationPrecipitation of Fe3O4 in magnetotactic bacteria
Frankel, R. B., & Blakemore, R. P. (1984) · Philosophical transactions of the Royal Society of London. Series B, Biological sciences · doi:10.1098/rstb.1984.0047 · Cited by 30
Integrated Self-Assembly of the Mms6 Magnetosome Protein to Form an Iron-Responsive Structure
Feng, S., Wang, L., Palo, P. E., Liu, X., Mallapragada, S. K., & Nilsen‐Hamilton, M. (2013) · International Journal of Molecular Sciences · doi:10.3390/ijms140714594 · Cited by 29
Self-citationA protein-protein interaction in magnetosomes: TPR protein MamA interacts with an Mms6 protein
Nguyen, H. V., Suzuki, E., Oestreicher, Z., Minamide, H., Endoh, H., Fukumori, Y., & Taoka, A. (2016) · Biochemistry and Biophysics Reports · doi:10.1016/j.bbrep.2016.05.010 · Cited by 26
Zwiener, T., Dziuba, M. V., Mickoleit, F., Rückert, C., Busche, T., Kalinowski, J., Uebe, R., & Schüler, D. (2021) · Microbial Cell Factories · doi:10.1186/s12934-021-01517-2 · Cited by 25
Wan, J., Browne, P. J., Hershey, D. M., Montabana, E. A., Iavarone, A. T., Downing, K. H., & Komeili, A. (2022) · Proceedings of the National Academy of Sciences · doi:10.1073/pnas.2111745119 · Cited by 25
Tuning properties of biomimetic magnetic nanoparticles by combining magnetosome associated proteins
Peigneux, A., Jabalera, Y., Vivas, M. A. F., Casares, S., Azuaga, A. I., & Jiménez-López, C. (2019) · Scientific Reports · doi:10.1038/s41598-019-45219-7 · Cited by 23
Reduction of iron(III) byEscherichia coli K12: Lack of involvement of the respiratory chains
Williams, H. D., & Poole, R. K. (1987) · Current Microbiology · doi:10.1007/bf01577588 · Cited by 21
A biomimetic magnetosome: Formation of iron oxide within carboxylic acid terminated polymersomes
Bain, J., Legge, C. J., Beattie, D. L., Sahota, A., Dirks, C., Lovett, J. R., & Staniland, S. S. (2019) · Nanoscale · doi:10.1039/c9nr00498j · Cited by 21
A Novel Ferric Reductase Purified from Magnetospirillum gryphiswaldense MSR-1
Xia, M., Jiang, W. Z., Lei, Y., & Li, Y. (2007) · Current Microbiology · doi:10.1007/s00284-007-0023-3 · Cited by 20
Niu, W., Zhang, Y., Liu, J., Wen, T., Miao, T., Basit, A., & Jiang, W. Z. (2020) · Free Radical Biology and Medicine · doi:10.1016/j.freeradbiomed.2020.10.015 · Cited by 20
Mori, J. F., Lu, S., Händel, M., Totsche, K. U., Neu, T. R., Iancu, V. V., Tarcea, N., Popp, J., & Küsel, K. (2015) · Microbiology · doi:10.1099/mic.0.000205 · Cited by 17
Ferric Reductase Activity of the ArsH Protein from Acidithiobacillus ferrooxidans
Mo, H. (2011) · Journal of Microbiology and Biotechnology · doi:10.4014/jmb.1101.01020 · Cited by 16
Investigating the ferric ion binding site of magnetite biomineralisation protein Mms6
Rawlings, A. E., Liravi, P., Corbett, S., Holehouse, A. S., & Staniland, S. S. (2020) · PLoS ONE · doi:10.1371/journal.pone.0228708 · Cited by 16
Magnetospirillum gryphiswaldense
Schüler, D., Monteil, C. L., & Lefèvre, C. T. (2020) · Trends in Microbiology · doi:10.1016/j.tim.2020.06.001 · Cited by 16
Metadata
- Authors
- Singappuli-Arachchige, D., Feng, S., Wang, L., Palo, P. E., Shobade, S. O., Thomas, M., & Nilsen-Hamilton, M.
- Affiliations
- Ames Laboratory, U.S. Department of Energy, Ames, IA 50011, USA
- United States Department of Energy (US)
- Venue
- International Journal of Molecular Sciences
- Publisher
- MDPI AG
- Published
- 2022-09-07
- Volume
- 23
- Issue
- 18
- Pages
- 10305
- ISSN
- 1422-0067 (ISSN-L)
- PMC
- PMC9499114
- OpenAlex
- W4295011505
- Cited by
- 8
- References
- 67
- Citations by year
- 2026: 1 · 2025: 2 · 2024: 4 · 2023: 1
- FWCI
- 0.57
- Type
- journal article
- Language
- en
- Open access
- gold
- doi.org
- Licence
- Locations
- International Journal of Molecular Sciences (publishedVersion, cc-by)
- Preprints.org (acceptedVersion, cc-by)
- PubMed Central (publishedVersion, cc-by)
- PubMed (publishedVersion)
- DOAJ (DOAJ: Directory of Open Access Journals) (submittedVersion, cc-by-sa)
- OSTI OAI (U.S. Department of Energy Office of Scientific and Technical Information) (submittedVersion)
- Funders
- U.S. Department of Energy, Office of Basic Energy Science, Division of Materials Sciences and Engineering (DE-AC02-07CH11358)
- Aptalogic Inc. (DE-AC02-07CH11358)
- U.S. Department of Energy by Iowa State University (DE-AC02-07CH11358)
- Topics
- Physical Sciences › Earth and Planetary Sciences › Geophysics › Geomagnetism and Paleomagnetism Studies
- Physical Sciences › Materials Science › Materials Chemistry › Magnetic Properties and Synthesis of Ferrites
- Life Sciences › Biochemistry, Genetics and Molecular Biology › Biochemistry › Metalloenzymes and iron-sulfur proteins
- Keywords
- magnetosomes, Magnetospirillum magneticum AMB-1, ferric reductase, magnetite crystallization, magnetotactic bacteria, iron binding, C-terminal domain, protein oligomerization, ubiquitin fusion protein
- MeSH terms
- Bacterial Proteins, Flavin-Adenine Dinucleotide, Iron, Lipids, Liposomes, Membrane Proteins, NAD, Ubiquitins, FMN Reductase, Magnetospirillum, Ferrosoferric Oxide, Magnetosomes
About these checks
Registry, retraction, Cites and statistics results are computed, not judged, with one exception: a printed reference that no index lists is read once by a model before it counts as a citation error. Claims are extracted by a model and kept only when their quote appears verbatim in the text; each cited source is then checked, with a model’s help, for whether it says what the claim relies on. Those verdicts can be wrong — read the claim’s quote and the cited source before relying on one.
Statistics and arithmetic are recomputed, not judged.
Confidence bands are shown only for fields calibrated on our annotated test set. None is calibrated yet, so no band is shown.
What counts as a claim ›How we measure confidence ›How we check this ›
Are you an author, or do you see a problem with this page? Request a review
Data sources
Bibliographic data: Semantic Scholar, OpenAlex, Crossref.
Contains information from the Semantic Scholar Academic Graph Datasets, made available under the ODC Attribution License (ODC-BY 1.0).
Semantic Scholar’s data is described in: Kinney, R., et al. (2023). The Semantic Scholar Open Data Platform. arXiv:2301.10140.
