

Developing an Interpretable Machine Learning Model to Predict in-Hospital Mortality in Sepsis Patients: A Retrospective Temporal Validation Study
Open accessThe DOI matches its Crossref record; 44 of the 45 references it cites were found in a registry or an index, and 1 are not checked yet.
Abstract
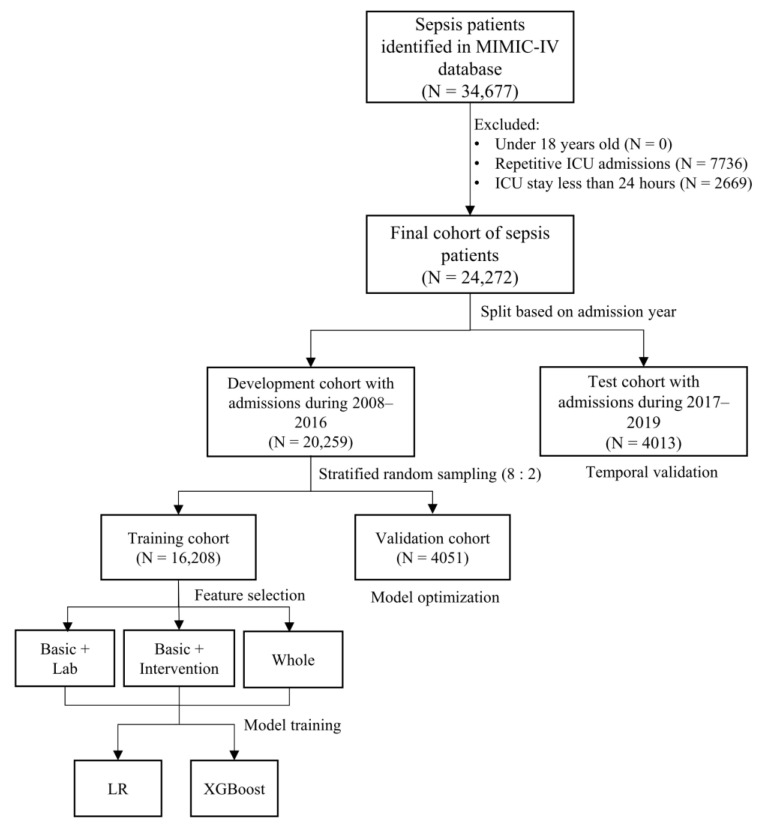
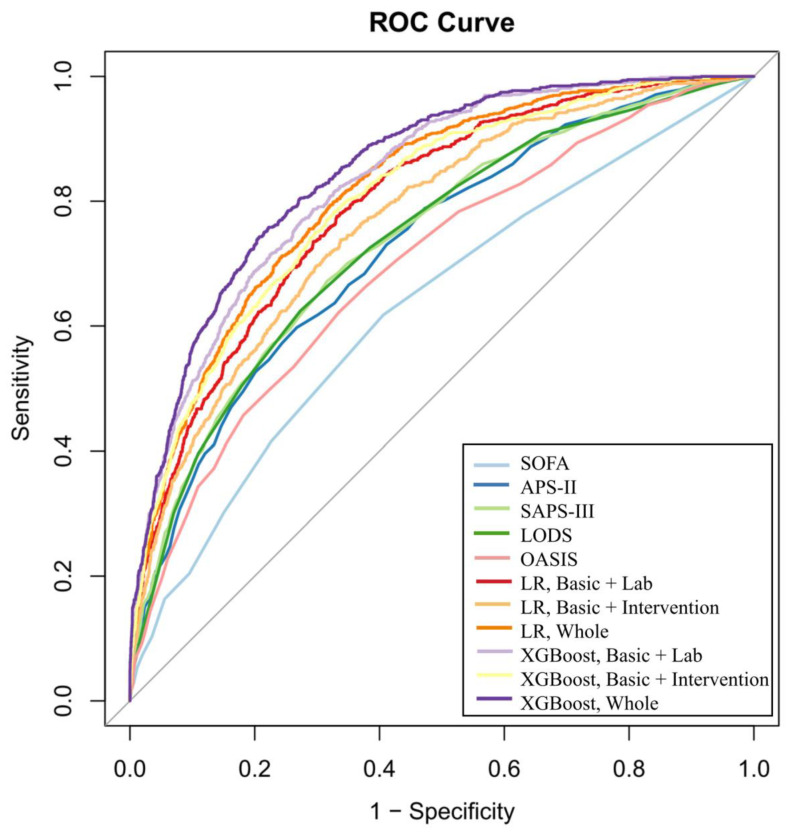
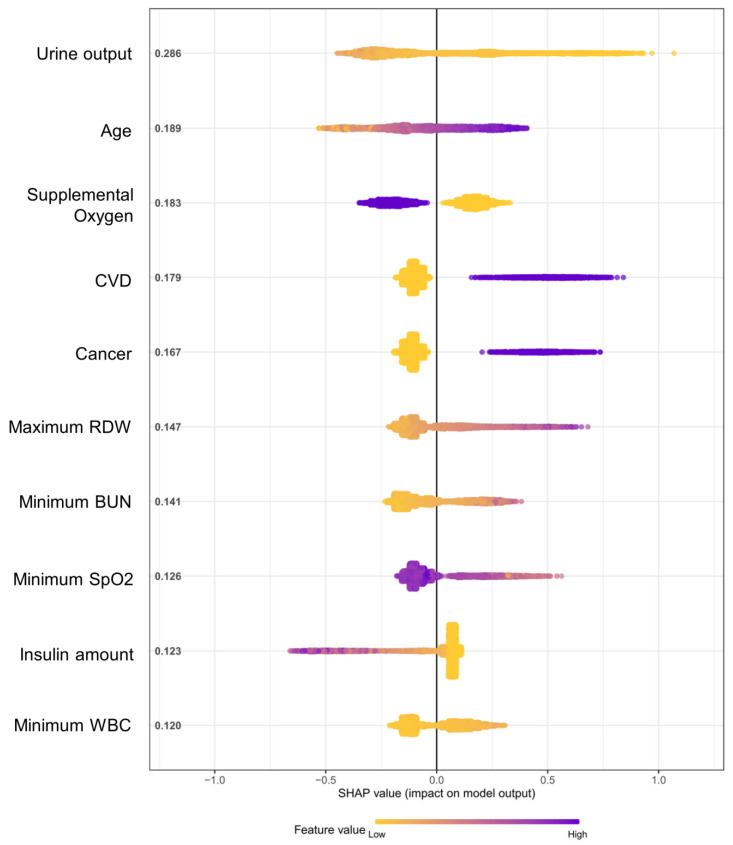
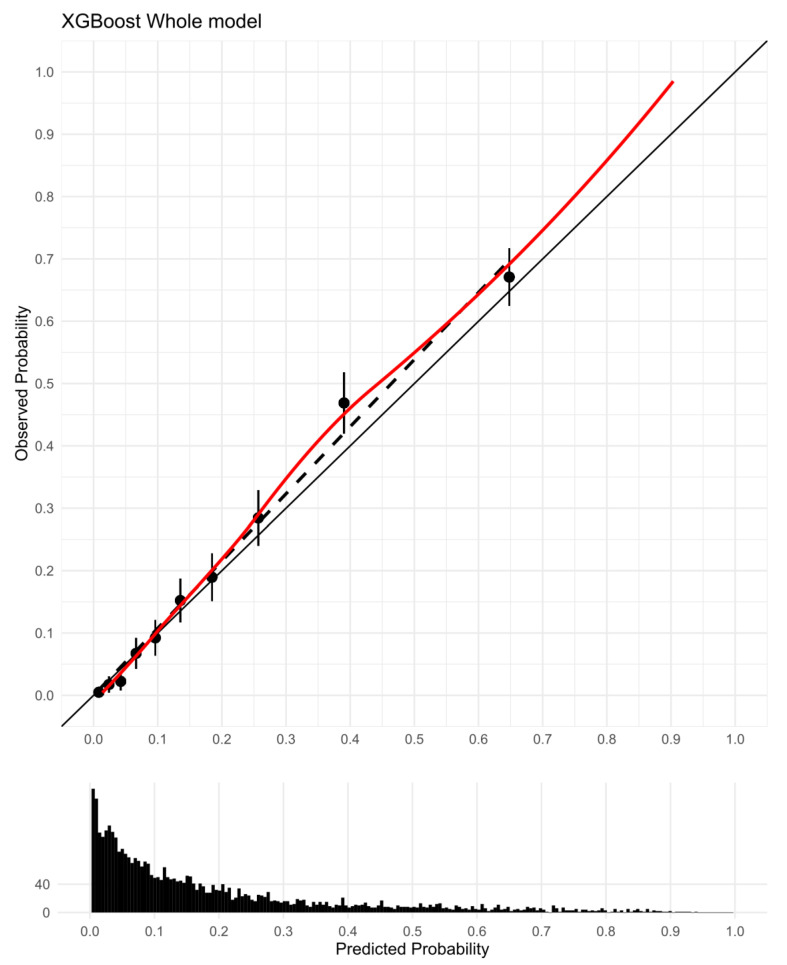
Background: Risk stratification plays an essential role in the decision making for sepsis management, as existing approaches can hardly satisfy the need to assess this heterogeneous population. We aimed to develop and validate a machine learning model to predict in-hospital mortality in critically ill patients with sepsis. Methods: Adult patients fulfilling the definition of Sepsis-3 were included at a large tertiary medical center. Relevant clinical features were extracted within the first 24 h in ICU, re-classified into different genres, and utilized for model development under three strategies: “Basic + Lab”, “Basic + Intervention”, and “Whole” feature sets. Extreme gradient boosting (XGBoost) was compared with logistic regression (LR) and established severity scores. Temporal validation was conducted using admissions from 2017 to 2019. Results: The final cohort included 24,272 patients, of which 4013 patients formed the test cohort for temporal validation. The trained and fine-tuned XGBoost model with the whole feature set showed the best discriminatory ability in the test cohort with AUROC as 0.85, significantly higher than the XGBoost “Basic + Lab” model (0.83), the LR “Whole” model (0.82), SOFA (0.63), SAPS-II (0.73), and LODS score (0.74). The performance in varying subgroups remained robust, and predictors, such as increased urine output and supplemental oxygen therapy, were crucially correlated with improved survival when interpretability was explored. Conclusions: We developed and validated a novel XGBoost-based model and demonstrated significantly improved performance to LR and other scores in predicting the mortality risks of sepsis patients in the hospital using features in the first 24 h.
Overview
The claims and statistics of this paper haven’t been checked yet.
Free: it reads the open-access text and checks the first 5 claims that cite a source we can check. Create a free account to check every claim.
Integrity signals
Registry
Cites
Statistics
Figures
Verification
Claims the paper makes
The claims and statistics of this paper haven’t been checked yet.
Free: it reads the open-access text and checks the first 5 claims that cite a source we can check. Create a free account to check every claim.
Claims other papers make about this one
Each is checked against this paper’s own text: does it say what the citing paper says it does?
The source backs part of the claim, not all of it — or backs it for a different population, condition or comparison.
In the citing paper
“These interpretability strategies enabled the identification of key physiological variables driving model predictions, such as respiratory rate (RR), Glasgow Coma Scale, mean arterial pressure (MAP), lactate, creatinine, heart rate (HR), blood urea nitrogen (BUN), body temperature, platelet count, and urine output [7, 12–18, 22, 24, 25, 39].”
From Explainable AI for critical care: a systematic review of interpretable models for sepsis and ICU mortality prediction (2026) · cites this paper as [15]
Experimental — accuracy not yet measuredThe cited source says what the claim attributes to it.
In the citing paper
“Most published studies rely on retrospective data and are often based on a single institution or dataset [12–17].”
From Explainable AI for critical care: a systematic review of interpretable models for sepsis and ICU mortality prediction (2026) · cites this paper as [15]
The cited source says what the claim attributes to it.
In the citing paper
“Interpretability methods were widely applied across these studies, with SHAP emerging as the most frequently used technique [12, 13, 15, 16, 18, 19, 22, 24, 39].”
From Explainable AI for critical care: a systematic review of interpretable models for sepsis and ICU mortality prediction (2026) · cites this paper as [15]
The cited source says what the claim attributes to it.
In the citing paper
“Only a limited number of studies conducted external or temporal validation ([7, 15, 18, 22, 24]), and very few models have been prospectively implemented in real clinical environments.”
From Explainable AI for critical care: a systematic review of interpretable models for sepsis and ICU mortality prediction (2026) · cites this paper as [15]
Self-check
Percentages, sums and reported differences re-computed from the paper’s own numbers.
The self-check needs the paper’s full text.
Citations
Cites
XGBoost: A Scalable Tree Boosting System
Chen, T., & Guestrin, C. (2016) · Proceedings of the 22nd ACM SIGKDD International Conference on Knowledge Discovery and Data Mining · doi:10.1145/2939672.2939785 · Cited by 54,569 · cited 1×
“XGBoost is a decision-tree-based algorithm, where weak learners are ensembled iteratively into a strong predictor when the loss function is minimized through gradient boosting [40].”
BackgroundThe third international consensus definitions for sepsis and septic shock (Sepsis-3).
Singer, M., Deutschman, C. S., Seymour, C. W., Shankar-Hari, M., Annane, D., Bauer, M., Bellomo, R., Bernard, G. R., Chiche, J.-D., Coopersmith, C. M., et al. (2016) · JAMA · doi:10.1001/jama.2016.0287 · Cited by 28,250 · cited 3×
“For instance, Sequential Organ Failure Assessment (SOFA) score was initially created based on expert consensus [1].”
BackgroundMethodInfluentialGoldberger, A. L., Amaral, L. A. N., Glass, L., Hausdorff, J. M., Ivanov, P. C., Mark, R. G., Mietus, J. E., Moody, G. B., Peng, C.-K., & Stanley, H. E. (2000) · Circulation · doi:10.1161/01.cir.101.23.e215 · Cited by 14,809
pROC: an open-source package for R and S+ to analyze and compare ROC curves
Robin, X., Turck, N., Hainard, A., Tiberti, N., Lisacek, F., Sanchez, J.-C., & Müller, M. (2011) · BMC Bioinformatics · doi:10.1186/1471-2105-12-77 · Cited by 13,697
Vincent, J. L., Moreno, R., Takala, J., Willatts, S., De Mendonça, A., Bruining, H., Reinhart, C. K., Suter, P. M., & Thijs, L. G. (1996) · Intensive Care Medicine · doi:10.1007/bf01709751 · Cited by 11,674 · cited 1×
“Additionally, Simplified Acute Physiology Score (SAPS)-II [22], APS-III [23], Logistic Organ Dysfunction Score (LODS) [24], Oxford Acute Severity of Illness Score (OASIS) [25], and SOFA score [26] acted as benchmarks for evaluating the performance of the new scoring tool.”
MethodMIMIC-III, a freely accessible critical care database
Johnson, A. E. W., Pollard, T. J., Shen, L., Lehman, L.-W. H., Feng, M., Ghassemi, M., Moody, B., Szolovits, P., Anthony Celi, L., & Mark, R. G. (2016) · Scientific Data · doi:10.1038/sdata.2016.35 · Cited by 8,141 · cited 1×
“The Institutional Review Board of the BIDMC and Massachusetts Institute of Technology approved the research use of the MIMIC database [21].”
MethodRudd, K. E., Johnson, S. C., Agesa, K. M., Shackelford, K. A., Tsoi, D., Kievlan, D. R., Colombara, D. V., Ikuta, K. S., Kissoon, N., Finfer, S., et al. (2020) · The Lancet · doi:10.1016/s0140-6736(19)32989-7 · Cited by 7,971
Le Gall, J.-R. (1993) · JAMA: The Journal of the American Medical Association · doi:10.1001/jama.270.24.2957 · Cited by 7,773 · cited 1×
“Additionally, Simplified Acute Physiology Score (SAPS)-II [22], APS-III [23], Logistic Organ Dysfunction Score (LODS) [24], Oxford Acute Severity of Illness Score (OASIS) [25], and SOFA score [26] acted as benchmarks for evaluating the performance of the new scoring tool.”
Method(2010) · University of Twente Research Information · Cited by 6,037
The APACHE III Prognostic System
Knaus, W. A., Wagner, D. P., Draper, E. A., Zimmerman, J. E., Bergner, M., Bastos, P. G., Sirio, C. A., Murphy, D. J., Lotring, T., Damiano, A., et al. (1991) · Chest · doi:10.1378/chest.100.6.1619 · Cited by 3,439 · cited 3×
“Models AUROC AUROC 95% CI Cut-Offs Se Sp Accuracy PPV NPV DOR Training cohort (N = 16,208) XGBoost, Basic + Lab 0.97 [0.964, 0.971] 0.23 0.89 0.92 0.92 0.66 0.98 95.12 XGBoost, Basic + Intervention 0.90 [0.892, 0.905] 0.15 0.86 0.78 0.79 0.40 0.97 21.56 XGBoost, Whole 0.95 [0.942, 0.950] 0.18 0.90 0.85 0.86 0.51 0.98…”
MethodInfluential
Research works printed but not linked: 1
- 2016, Imputation with the R Package VIM, J. Stat. Softw., 74, 1
Cited by
Liu, F., Yao, J. J., Liu, C., & Shou, S. (2023) · BMC Surgery · doi:10.1186/s12893-023-02151-y · Cited by 46
“A retrospective temporal validation study suggested an interpretable machine learning model performed significantly better than LR and outperformed conventional severity scores in predicting in-hospital mortality among sepsis patients and varying subgroups [31].”
MethodSARIDAŞ, A., & Cetinkaya, R. (2025) · Diagnostics · doi:10.3390/diagnostics15081026 · Cited by 45
“Prior studies have shown that XGBoost effectively models complex clinical datasets and achieves strong discriminative performance in sepsis-related mortality prediction [15,16].”
AI Advances in ICU with an Emphasis on Sepsis Prediction: An Overview
Stylianides, C., Nicolaou, A., Sulaiman, W. A., Alexandropoulou, C.-A., Panagiotopoulos, I., Karathanasopoulou, K., Dimitrakopoulos, G., Kleanthous, S., Politi, E., Ntalaperas, D., et al. (2025) · Machine Learning and Knowledge Extraction · doi:10.3390/make7010006 · Cited by 28
“For sepsis mortality prediction models, built-in feature importance [113,240–242], SHAP [240,241,243–246], LIME [127,245,247], Break Down [241], Ceteris Paribus [241], and INVASE [242] are the explainable AI techniques used in literature.”
Zhuang, J., Huang, H., Jiang, S., Liang, J., Liu, Y., & Yu, X. (2023) · BMC Medical Informatics and Decision Making · doi:10.1186/s12911-023-02279-0 · Cited by 28
“Several studies have already developed ML-based risk assessment models for patients with sepsis in the ICU settings [21–23], such as Extreme Gradient Boosting (XGBoost), stepwise logistic regression, stochastic gradient boosting, and random forest (RF).”
BackgroundMethodInfluentialMiao, J., Zuo, C., Cao, H., Gu, Z., Huang, Y., Song, Y., & Wang, F. (2023) · Journal of the Neurological Sciences · doi:10.1016/j.jns.2023.122849 · Cited by 20
Metadata
- Authors
- Li, S., Dou, R., Song, X., Lui, K., Xu, J., Guo, Z., Hu, X., Guan, X., & Cai, C.
- Affiliations
- The First Affiliated Hospital, Sun Yat-sen University (CN)
- Rice University (US)
- Corresponding author
- Cai, Changjie
- Venue
- Journal of Clinical Medicine
- Publisher
- MDPI AG
- Published
- 2023-01-24
- Volume
- 12
- Issue
- 3
- Pages
- 915
- ISSN
- 2077-0383 (ISSN-L)
- PMC
- PMC9917524
- OpenAlex
- W4317933350
- Cited by
- 25
- References
- 43
- Citations by year
- 2026: 9 · 2025: 7 · 2024: 5 · 2023: 4
- FWCI
- 4.99
- Type
- journal article
- Language
- en
- Open access
- gold
- doi.org
- Licence
- Locations
- Journal of Clinical Medicine (publishedVersion, cc-by)
- PubMed Central (publishedVersion, cc-by)
- PubMed (publishedVersion)
- Funders
- Massachusetts Institute of Technology
- Topics
- Health Sciences › Medicine › Critical Care and Intensive Care Medicine › Sepsis Diagnosis and Treatment
- Physical Sciences › Computer Science › Artificial Intelligence › Machine Learning in Healthcare
- Health Sciences › Medicine › Endocrinology, Diabetes and Metabolism › Hyperglycemia and glycemic control in critically ill and hospitalized patients
- Keywords
- sepsis, in-hospital mortality prediction, model interpretability, XGBoost, risk stratification, Sepsis-3, severity scoring, SOFA score, SAPS II, urine output, supplemental oxygen, critically ill patients, temporal validation
About these checks
Registry, retraction, Cites and statistics results are computed, not judged, with one exception: a printed reference that no index lists is read once by a model before it counts as a citation error. Claims are extracted by a model and kept only when their quote appears verbatim in the text; each cited source is then checked, with a model’s help, for whether it says what the claim relies on. Those verdicts can be wrong — read the claim’s quote and the cited source before relying on one.
Statistics and arithmetic are recomputed, not judged.
Confidence bands are shown only for fields calibrated on our annotated test set. None is calibrated yet, so no band is shown.
What counts as a claim ›How we measure confidence ›How we check this ›
Are you an author, or do you see a problem with this page? Request a review
How to cite
Cite CoChat for the checks on this page, and the paper for its own findings.
- This page
- CoChat. (2026). Citation check: Developing an Interpretable Machine Learning Model to Predict in-Hospital Mortality in Sepsis Patients: A Retrospective Temporal Validation Study. https://app.cochat.ai/papers/10.3390/jcm12030915
- The paper
- Li, S., Dou, R., Song, X., Lui, K., Xu, J., Guo, Z., Hu, X., Guan, X., & Cai, C. (2023). Developing an Interpretable Machine Learning Model to Predict in-Hospital Mortality in Sepsis Patients: A Retrospective Temporal Validation Study. Journal of Clinical Medicine. https://doi.org/10.3390/jcm12030915
Data sources
Bibliographic data: Semantic Scholar, OpenAlex, Crossref.
Contains information from the Semantic Scholar Academic Graph Datasets, made available under the ODC Attribution License (ODC-BY 1.0).
Semantic Scholar’s data is described in: Kinney, R., et al. (2023). The Semantic Scholar Open Data Platform. arXiv:2301.10140.
