Student or educator? Sign up with your school email and get 6 months of Pro free.
Cited by 32Microbial Natural Products and BiosynthesisMycotoxins in Agriculture and FoodPlant Pathogens and Fungal Diseases

The DOI matches its Crossref record; 110 of the 110 references it cites were found in a registry or an index.

Bioinformatic Analysis of Secondary Metabolite Biosynthetic Potential in Pathogenic Fusarium

Open access
Lin, Chao, Feng, Xi-long, Liu, Yu, Li, Zhao-chen, Li, Xiu-Zhang, Qi, Jianzhao·2023·Journal of Fungi

Published version of a preprint

Abstract

Fusarium species are among the filamentous fungi with the most pronounced impact on agricultural production and human health. The mycotoxins produced by pathogenic Fusarium not only attack various plants including crops, causing various plant diseases that lead to reduced yields and even death, but also penetrate into the food chain of humans and animals to cause food poisoning and consequent health hazards. Although sporadic studies have revealed some of the biosynthetic pathways of Fusarium toxins, they are insufficient to satisfy the need for a comprehensive understanding of Fusarium toxin production. In this study, we focused on 35 serious pathogenic Fusarium species with available genomes and systematically analyzed the ubiquity of the distribution of identified Fusarium- and non-Fusarium-derived fungal toxin biosynthesis gene clusters (BGCs) in these species through the mining of core genes and the comparative analysis of corresponding BGCs. Additionally, novel sesterterpene synthases and PKS_NRPS clusters were discovered and analyzed. This work is the first to systematically analyze the distribution of related mycotoxin biosynthesis in pathogenic Fusarium species. These findings enhance the knowledge of mycotoxin production and provide a theoretical grounding for the prevention of fungal toxin production using biotechnological approaches.

Overview

The claims and statistics of this paper haven’t been checked yet.

Run the check — free, no account needed. It reads the open-access text and checks the sources it cites.

A few free checks a day · papers already verified open instantly · results are public

Integrity signals

Registry

Crossref · 10.3390/jof9080850

Cites

110 of 110 references verified0 citation errors · 0 not checkable

Statistics

Figures
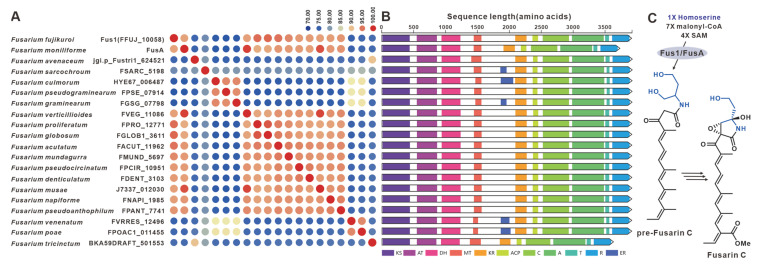
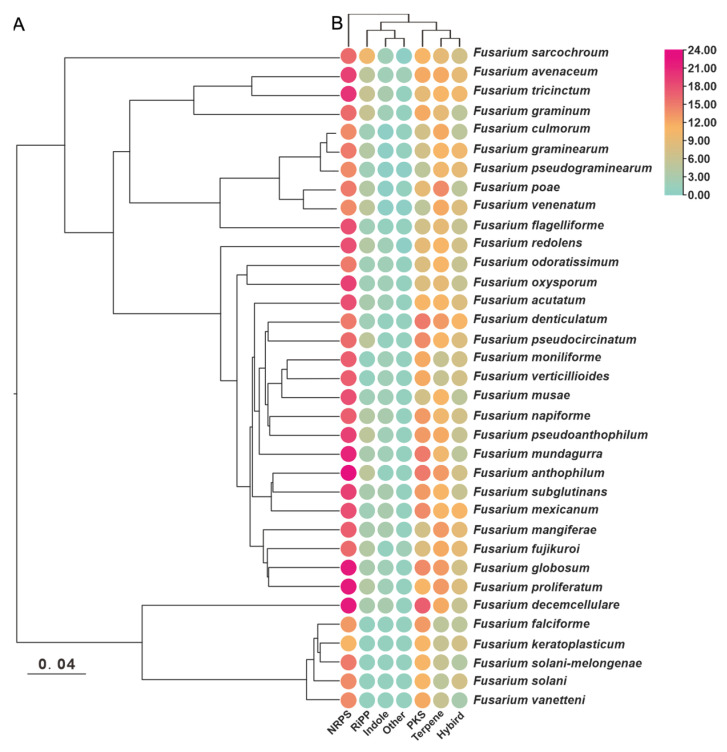
Figure 1 Distribution of six different types of gene clusters in 35 pathogenic Fusarium species. (A) Evolutionary relationships of the 35 pathogenic Fusarium species were constructed based on orthologous single-copy genes. (B) The BGC types were counted to visualize based on antiSMASH predictions.
Figure 1 Distribution of six different types of gene clusters in 35 pathogenic Fusarium species. (A) Evolutionary relationships of the 35 pathogenic Fusarium species were constructed based on orthologous single-copy genes. (B) The BGC types were counted to visualize based on antiSMASH predictions.CC BY · PubMed Central
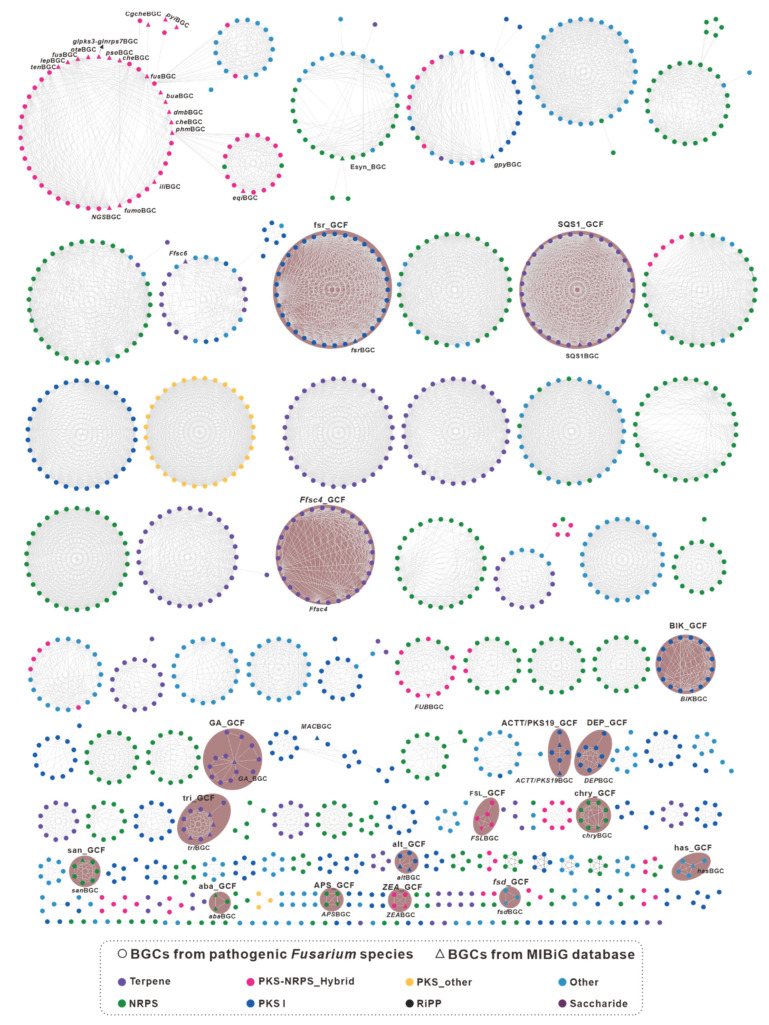
Figure 2 GCF network of the 1733 predicted biosynthetic gene clusters (BGCs) from 35 pathogenic Fusarium species calculated by the BiG-SCAPE pipeline and visualized with Cytoscape. The hollow triangles represent the BGCs from the MIBIG database, whose names are labeled near the corresponding hollow triangles. The network with a shaded background represents the identifiable GCFs.
Figure 2 GCF network of the 1733 predicted biosynthetic gene clusters (BGCs) from 35 pathogenic Fusarium species calculated by the BiG-SCAPE pipeline and visualized with Cytoscape. The hollow triangles represent the BGCs from the MIBIG database, whose names are labeled near the corresponding hollow triangles. The network with a shaded background represents the identifiable GCFs.CC BY · PubMed Central
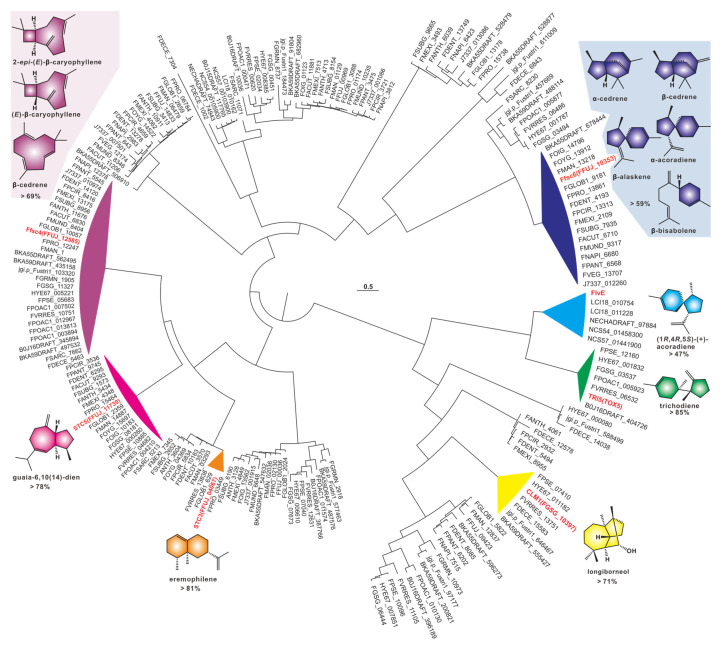
Figure 3 Cluster analysis of 209 sesquiterpene sequences. The identified sequences are marked in red, and groups containing identified sequences are highlighted with a colored background. The fill color of products of identified sequences corresponds to the background color of the group in which they are located.
Figure 3 Cluster analysis of 209 sesquiterpene sequences. The identified sequences are marked in red, and groups containing identified sequences are highlighted with a colored background. The fill color of products of identified sequences corresponds to the background color of the group in which they are located.CC BY · PubMed Central
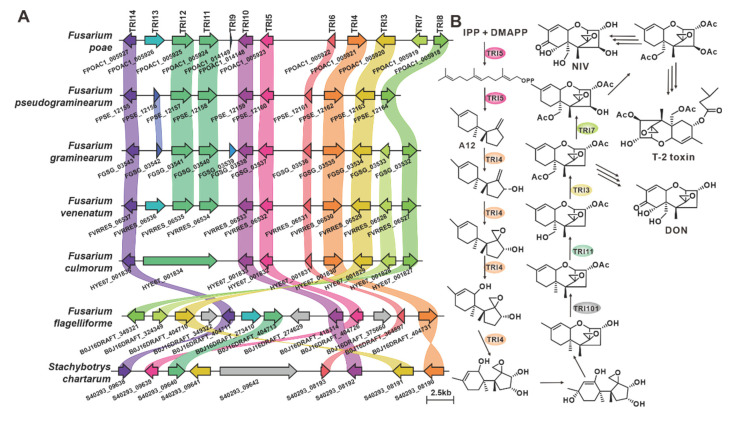
Figure 4 Biosynthesis of trichodiene-type analogues in pathogenic Fusarium species. (A) Comparison of triBGCs from different species: homologous genes are connected by a band of the same color. (B) Biosynthetic pathways of trichodiene-like toxins: Tri5 indicates trichodiene synthase; Tri4 and Tri11 indicate cytochrome P450 monooxygenases; Tri6 indicates regulatory protein; Tri3, Tri7 and Tri101 indicate acetyltransferases.
Figure 4 Biosynthesis of trichodiene-type analogues in pathogenic Fusarium species. (A) Comparison of triBGCs from different species: homologous genes are connected by a band of the same color. (B) Biosynthetic pathways of trichodiene-like toxins: Tri5 indicates trichodiene synthase; Tri4 and Tri11 indicate cytochrome P450 monooxygenases; Tri6 indicates regulatory protein; Tri3, Tri7 and Tri101 indicate acetyltransferases.CC BY · PubMed Central
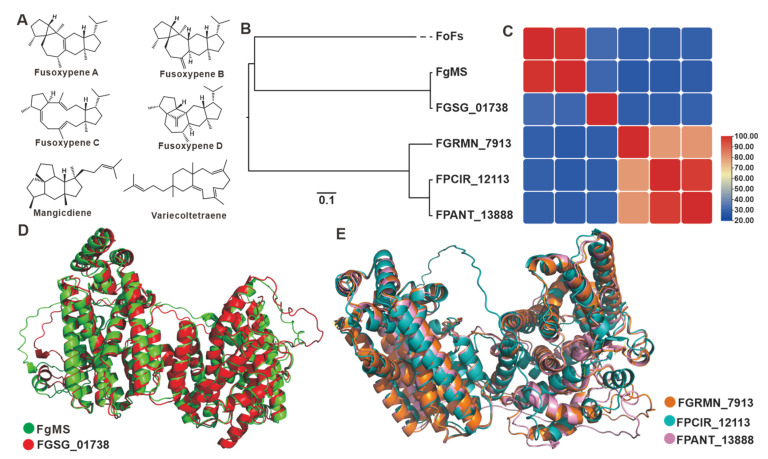
Figure 5 Fusarium-derived sesterterpenoids and sesterterpene synthases. (A) Structures of representative sesterterpenoids from Fusarium species. (B) Clustering analysis of chimeric sesterterpene cyclases. (C) Amino acid sequence identity analysis of chimeric sesterterpene cyclases. (D) Structural comparison of the predicted three-dimensional structures of FgMS and FGSG_01378. (E) Structural comparison of the predicted three-dimensional structures of FGRMN_7913, FPCIR_12113 and FPANT_13888.
Figure 5 Fusarium-derived sesterterpenoids and sesterterpene synthases. (A) Structures of representative sesterterpenoids from Fusarium species. (B) Clustering analysis of chimeric sesterterpene cyclases. (C) Amino acid sequence identity analysis of chimeric sesterterpene cyclases. (D) Structural comparison of the predicted three-dimensional structures of FgMS and FGSG_01378. (E) Structural comparison of the predicted three-dimensional structures of FGRMN_7913, FPCIR_12113 and FPANT_13888.CC BY · PubMed Central
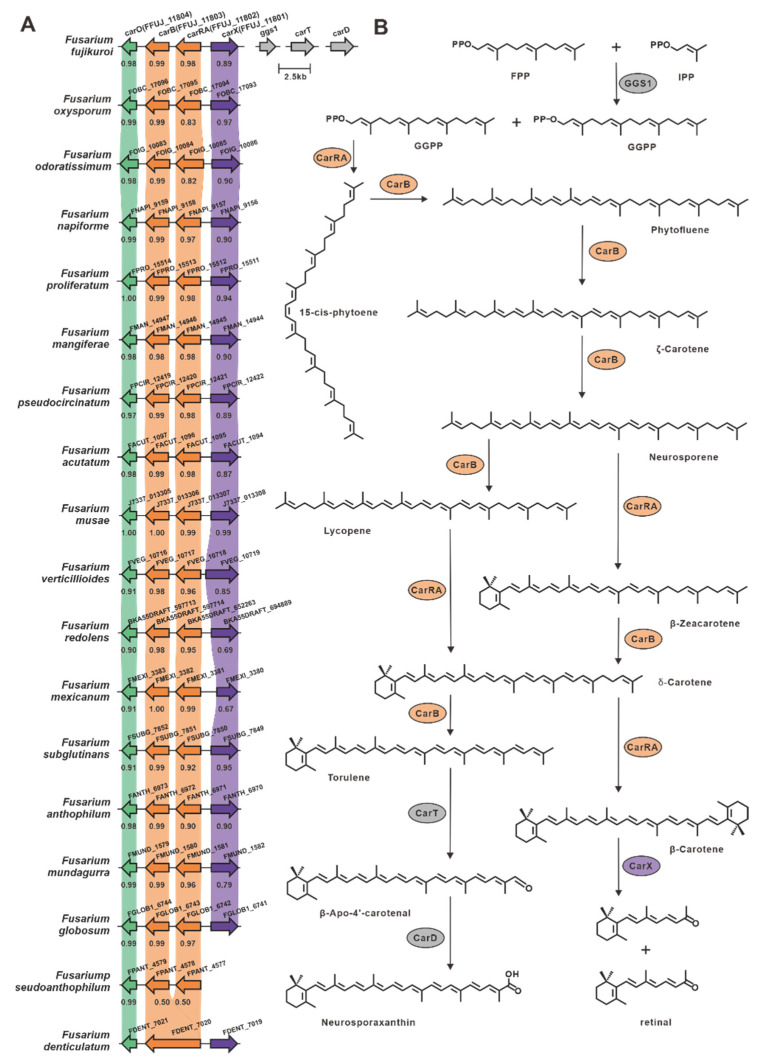
Figure 6 Biosynthesis of carotenoids in Fusarium species. (A) Comparison of carBGCs from different Fusarium species: homologous genes are connected by a band of the same color, and the identity value between the two homologous proteins is shown below the previous gene. (B) Biosynthetic pathways of carotenoids: CarRA indicates bifunctional phytoene synthase/carotene cyclase; CarB indicates phytotene desaturase; CarT indicates cleaving oxygenase; CarD indicates aldehyde dehydrogenase; and CarX indicates oxygenase.
Figure 6 Biosynthesis of carotenoids in Fusarium species. (A) Comparison of carBGCs from different Fusarium species: homologous genes are connected by a band of the same color, and the identity value between the two homologous proteins is shown below the previous gene. (B) Biosynthetic pathways of carotenoids: CarRA indicates bifunctional phytoene synthase/carotene cyclase; CarB indicates phytotene desaturase; CarT indicates cleaving oxygenase; CarD indicates aldehyde dehydrogenase; and CarX indicates oxygenase.CC BY · PubMed Central
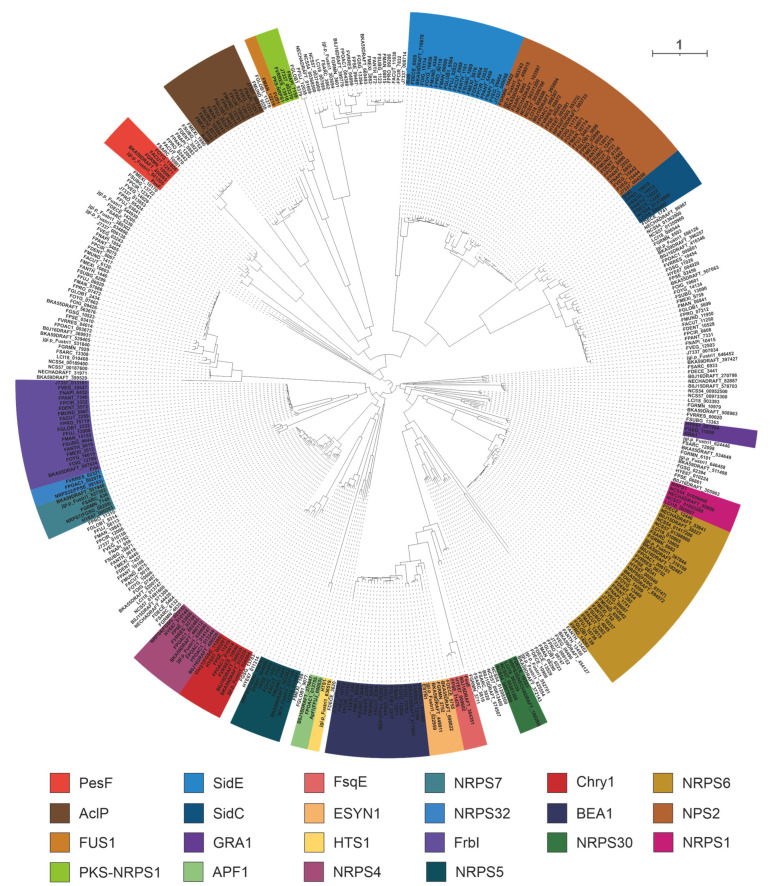
Figure 7 Clustering analysis of NRPSs based on evolutionary trees. Different colored shaded backgrounds represent different clusters, and these clusters with shaded backgrounds contain identified NRPSs.
Figure 7 Clustering analysis of NRPSs based on evolutionary trees. Different colored shaded backgrounds represent different clusters, and these clusters with shaded backgrounds contain identified NRPSs.CC BY · PubMed Central
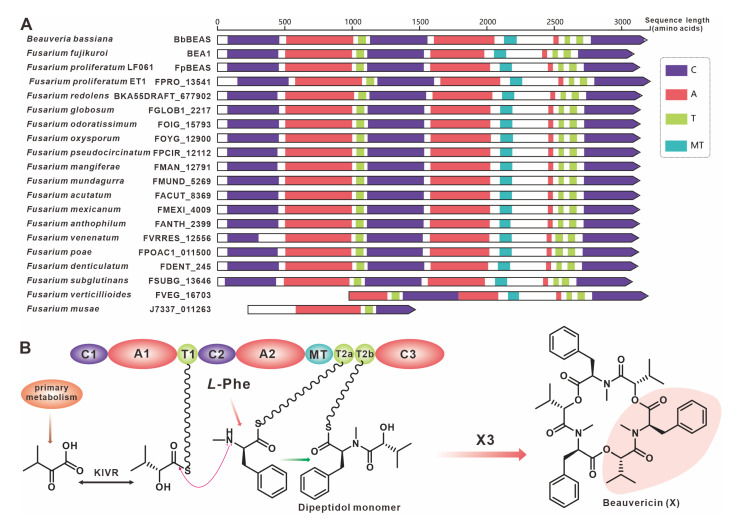
Figure 8 Beauvericin biosynthesis. (A) Domain comparison of BbBEAs for the biosynthesis of beauvericin: different colored regions represent different domains. (B) Model of the biosynthesis of beauvericin.
Figure 8 Beauvericin biosynthesis. (A) Domain comparison of BbBEAs for the biosynthesis of beauvericin: different colored regions represent different domains. (B) Model of the biosynthesis of beauvericin.CC BY · PubMed Central
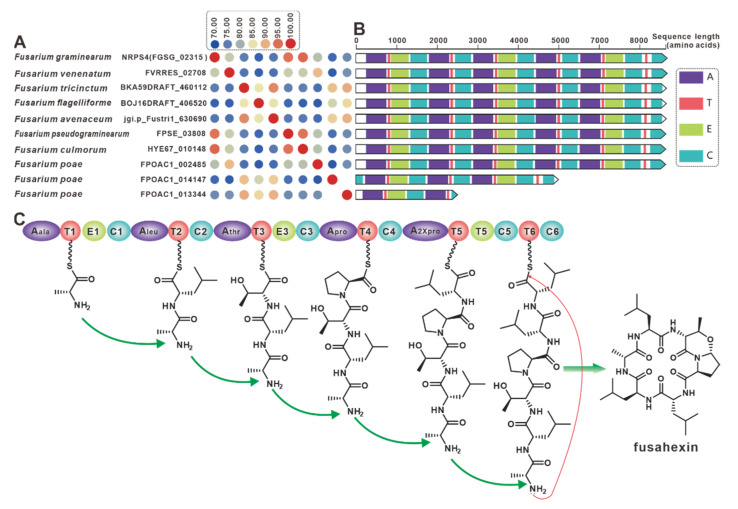
Figure 9 Fusahexin biosynthesis. (A) Comparison of the amino acid sequence identity of NRPS4 and its homologues. (B) Domain comparison of core genes for the biosynthesis of fusahexin: and different colored regions represent different domains. (C) Model of the biosynthesis of fusahexin.
Figure 9 Fusahexin biosynthesis. (A) Comparison of the amino acid sequence identity of NRPS4 and its homologues. (B) Domain comparison of core genes for the biosynthesis of fusahexin: and different colored regions represent different domains. (C) Model of the biosynthesis of fusahexin.CC BY · PubMed Central
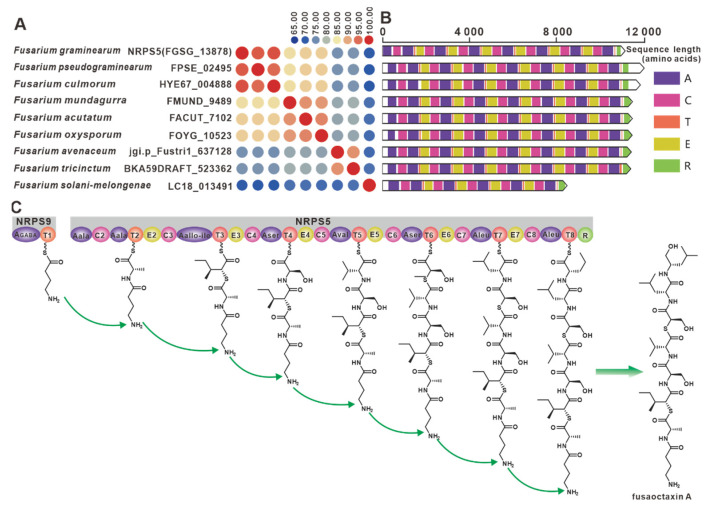
Figure 10 Fusaoctaxin A biosynthesis. (A) Comparison of the amino acid sequence identity of nrps9 and its homologues. (B) Domain comparison of NRPS9 for the biosynthesis of fusaoctaxin A: different colored regions represent different domains. (C) Model of the biosynthesis of fusaoctaxin A.
Figure 10 Fusaoctaxin A biosynthesis. (A) Comparison of the amino acid sequence identity of nrps9 and its homologues. (B) Domain comparison of NRPS9 for the biosynthesis of fusaoctaxin A: different colored regions represent different domains. (C) Model of the biosynthesis of fusaoctaxin A.CC BY · PubMed Central
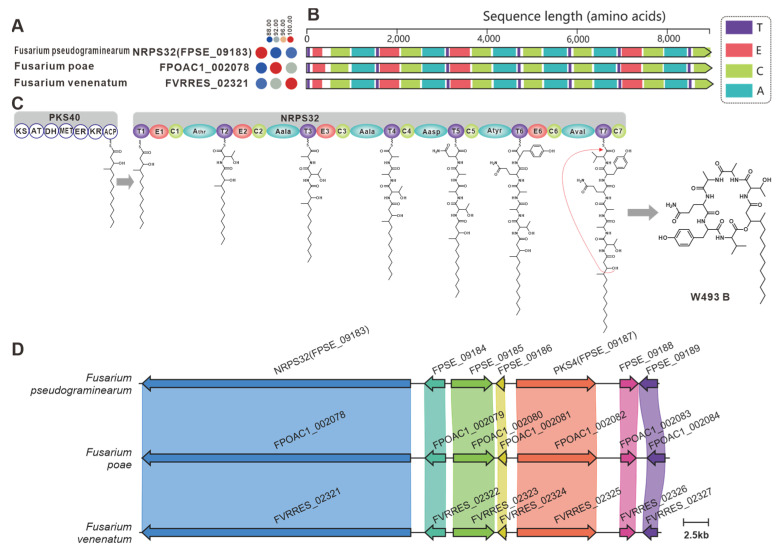
Figure 11 W493 B biosynthesis. (A) Comparison of the amino acid sequence identity of NRPS32 and its homologues. (B) Domain comparison of NRPS32 for the biosynthesis of W493 B: different colored regions represent different domains. (C) PKS40 and NRPS32 collaborative model of the biosynthesis of W493 B. (D) Comparison of the BGC for W493 B and two putative BGCs: homologous genes are connected by a band of the same color.
Figure 11 W493 B biosynthesis. (A) Comparison of the amino acid sequence identity of NRPS32 and its homologues. (B) Domain comparison of NRPS32 for the biosynthesis of W493 B: different colored regions represent different domains. (C) PKS40 and NRPS32 collaborative model of the biosynthesis of W493 B. (D) Comparison of the BGC for W493 B and two putative BGCs: homologous genes are connected by a band of the same color.CC BY · PubMed Central
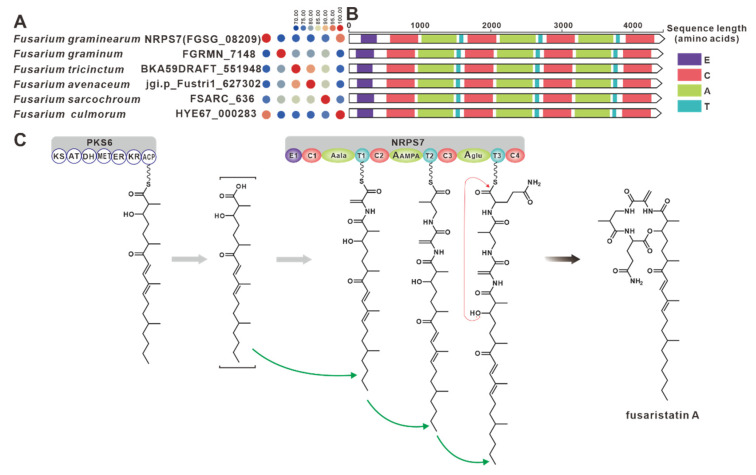
Figure 12 Fusaristatin A biosynthesis. (A) Comparison of the amino acid sequence identity of NRPS7 and its homologues. (B) Domain comparison of NRPS7 for the biosynthesis of fusaristatin A: different colored regions represent different structural domains. (C) PKS6 and NRPS7 collaborative model of the biosynthesis of fusaristatin A.
Figure 12 Fusaristatin A biosynthesis. (A) Comparison of the amino acid sequence identity of NRPS7 and its homologues. (B) Domain comparison of NRPS7 for the biosynthesis of fusaristatin A: different colored regions represent different structural domains. (C) PKS6 and NRPS7 collaborative model of the biosynthesis of fusaristatin A.CC BY · PubMed Central
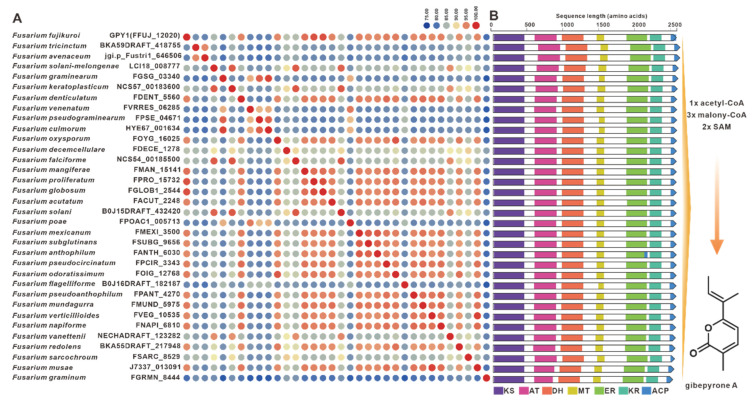
Figure 13 Gibepyrone A biosynthesis. (A) Comparison of the amino acid sequence identity of GPY1 and its homologues. (B) Domain comparison of GPY1 for the biosynthesis of gibepyrone A: different colored regions represent different domains.
Figure 13 Gibepyrone A biosynthesis. (A) Comparison of the amino acid sequence identity of GPY1 and its homologues. (B) Domain comparison of GPY1 for the biosynthesis of gibepyrone A: different colored regions represent different domains.CC BY · PubMed Central
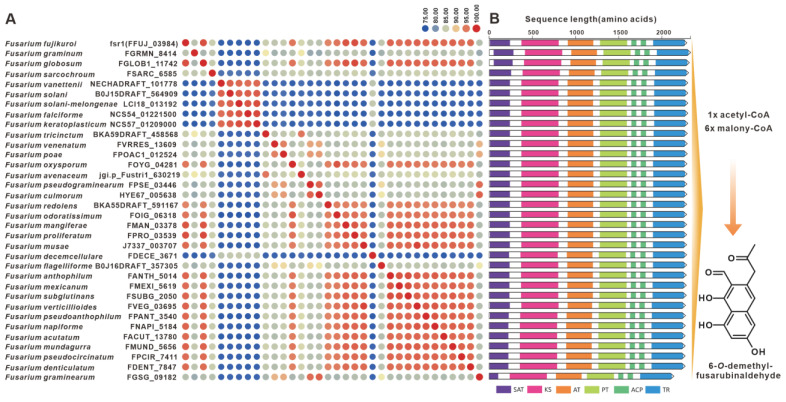
Figure 14 6-O-methylfusarubin biosynthesis. (A) Comparison of the amino acid sequence identity of Fsr1 and its homologues. (B) Domain comparison of Fsr1 for the biosynthesis of 6-O-methylfusarubinfusarubin: different colored regions represent different domains.
Figure 14 6-O-methylfusarubin biosynthesis. (A) Comparison of the amino acid sequence identity of Fsr1 and its homologues. (B) Domain comparison of Fsr1 for the biosynthesis of 6-O-methylfusarubinfusarubin: different colored regions represent different domains.CC BY · PubMed Central
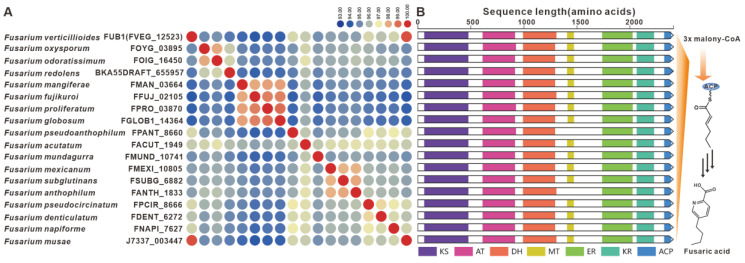
Figure 15 Fusaric acid biosynthesis. (A) Comparison of the amino acid sequence identity of FUB1 and its homologues. (B) Domain comparison of FUB1 for the biosynthesis of fusaric acid: different colored regions represent different domains.
Figure 15 Fusaric acid biosynthesis. (A) Comparison of the amino acid sequence identity of FUB1 and its homologues. (B) Domain comparison of FUB1 for the biosynthesis of fusaric acid: different colored regions represent different domains.CC BY · PubMed Central
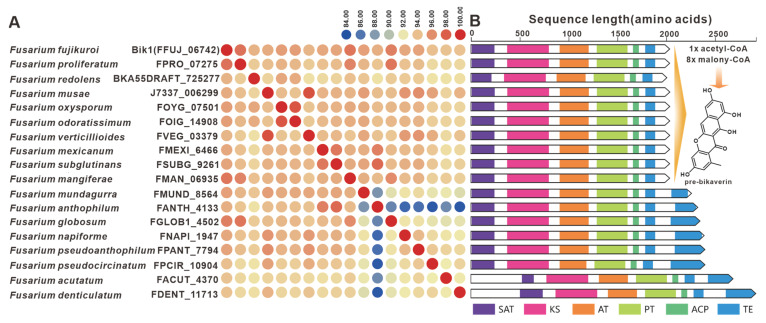
Figure 16 Pre-bikaverin biosynthesis. (A) Comparison of the amino acid sequence identity of Bik1 and its homologues. (B) Domain comparison of Bik1 for the biosynthesis of pre-bikaverin: different colored regions represent different domains.
Figure 16 Pre-bikaverin biosynthesis. (A) Comparison of the amino acid sequence identity of Bik1 and its homologues. (B) Domain comparison of Bik1 for the biosynthesis of pre-bikaverin: different colored regions represent different domains.CC BY · PubMed Central
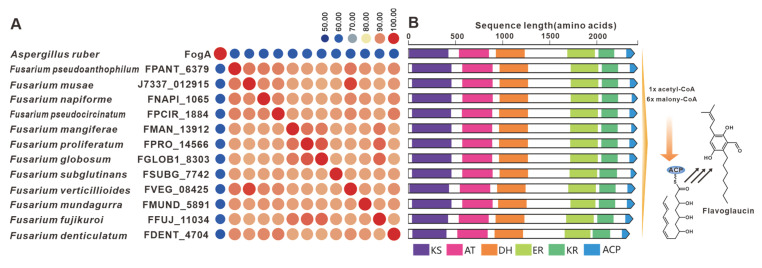
Figure 17 Flavoglaucin biosynthesis. (A) Comparison of the amino acid sequence identity of FogA and its homologues. (B) Domain comparison of FogA and its homologues. different colored regions represent different domains.
Figure 17 Flavoglaucin biosynthesis. (A) Comparison of the amino acid sequence identity of FogA and its homologues. (B) Domain comparison of FogA and its homologues. different colored regions represent different domains.CC BY · PubMed Central
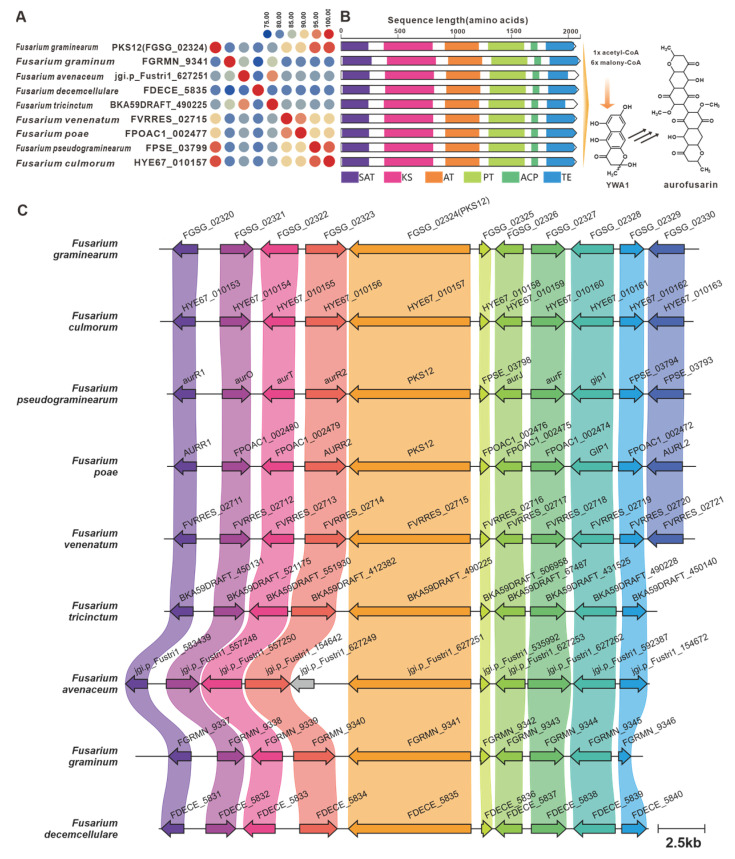
Figure 18 Aurofusarin biosynthesis. (A) Comparison of the amino acid sequence identity of PKS12 and its homologues. (B) Domain comparison of PKS12 and its homologues: different colored regions represent different domains. (C) Comparison of the BGC for aurofusarin and its similar BGCs: homologous genes are connected by a band of the same color.
Figure 18 Aurofusarin biosynthesis. (A) Comparison of the amino acid sequence identity of PKS12 and its homologues. (B) Domain comparison of PKS12 and its homologues: different colored regions represent different domains. (C) Comparison of the BGC for aurofusarin and its similar BGCs: homologous genes are connected by a band of the same color.CC BY · PubMed Central
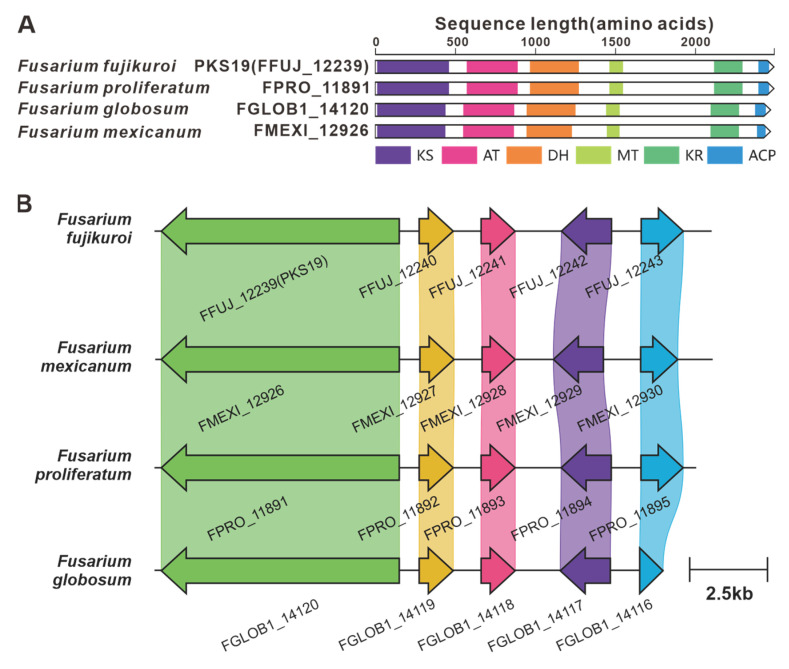
Figure 19 Fujikurin biosynthesis. (A) Comparison of the amino acid sequence identity of PKS19 and its homologues: different colored regions represent different domains. (B) Comparison of the BGC for fujikurin and its similar BGCs: homologous genes are connected by a band of the same color.
Figure 19 Fujikurin biosynthesis. (A) Comparison of the amino acid sequence identity of PKS19 and its homologues: different colored regions represent different domains. (B) Comparison of the BGC for fujikurin and its similar BGCs: homologous genes are connected by a band of the same color.CC BY · PubMed Central
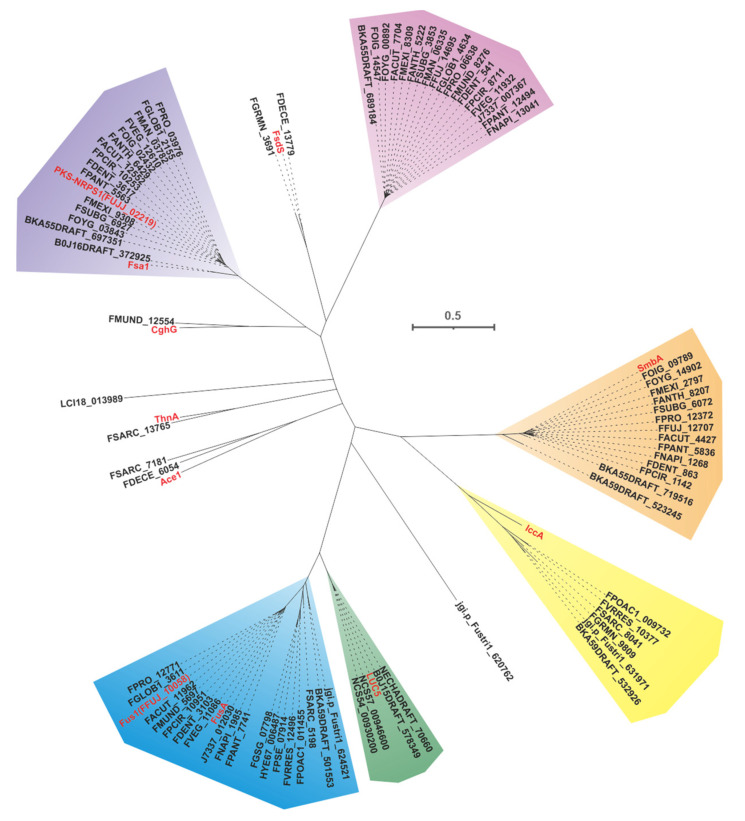
Figure 20 Evolutionary tree-based cluster analysis for PKS-NRPSs. Different colored shaded backgrounds represent different clusters, and red entries represent identified PKS-NRPSs.
Figure 20 Evolutionary tree-based cluster analysis for PKS-NRPSs. Different colored shaded backgrounds represent different clusters, and red entries represent identified PKS-NRPSs.CC BY · PubMed Central
Figure 21 Fusarin C biosynthesis. (A) Comparison of the amino acid sequence identity of Fus1, FusA and their homologues. (B) Domain comparison of Fus1, FusA and their homologues: homologous genes are connected by a band of the same color. (C) The biosynthetic pathway for Fusarin C.
Figure 21 Fusarin C biosynthesis. (A) Comparison of the amino acid sequence identity of Fus1, FusA and their homologues. (B) Domain comparison of Fus1, FusA and their homologues: homologous genes are connected by a band of the same color. (C) The biosynthetic pathway for Fusarin C.CC BY · PubMed Central
Figure 22 Lucilactaene biosynthesis. (A) Comparison of the amino acid sequence identity of Luc5 and its homologues. (B) Domain comparison of Luc5 and its homologues: homologous genes are connected by a band of the same color. (C) The biosynthetic pathway for lucilactaene.
Figure 22 Lucilactaene biosynthesis. (A) Comparison of the amino acid sequence identity of Luc5 and its homologues. (B) Domain comparison of Luc5 and its homologues: homologous genes are connected by a band of the same color. (C) The biosynthetic pathway for lucilactaene.CC BY · PubMed Central
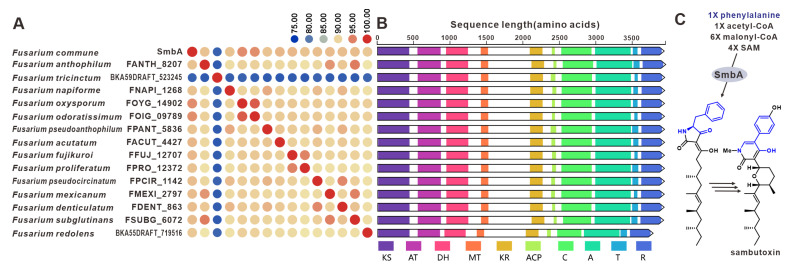
Figure 23 Sambutoxin biosynthesis. (A) Comparison of the amino acid sequence identity of SmbA and its homologues: homologous genes are connected by a band of the same color. (B) Domain comparison of SmbA and its homologues. (C) The biosynthetic pathway for mycotoxin.
Figure 23 Sambutoxin biosynthesis. (A) Comparison of the amino acid sequence identity of SmbA and its homologues: homologous genes are connected by a band of the same color. (B) Domain comparison of SmbA and its homologues. (C) The biosynthetic pathway for mycotoxin.CC BY · PubMed Central
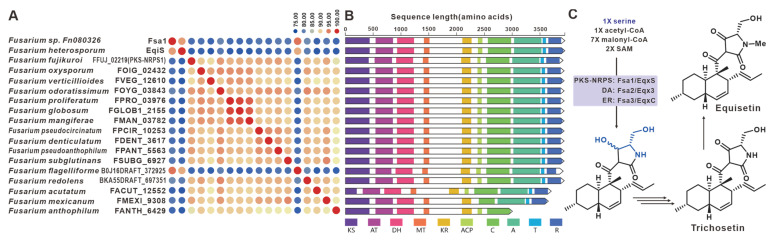
Figure 24 Equisetin compound biosynthesis. (A) Comparison of the amino acid sequence identity of Fsa1, EqiS, FFUJ_02219 and their homologues. (B) Domain comparison of Fsa1, EqiS, FFUJ_02219 and their homologues: homologous genes are connected by a band of the same color. (C) The biosynthetic pathway for equisetin compounds.
Figure 24 Equisetin compound biosynthesis. (A) Comparison of the amino acid sequence identity of Fsa1, EqiS, FFUJ_02219 and their homologues. (B) Domain comparison of Fsa1, EqiS, FFUJ_02219 and their homologues: homologous genes are connected by a band of the same color. (C) The biosynthetic pathway for equisetin compounds.CC BY · PubMed Central
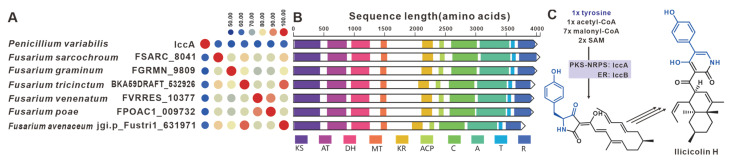
Figure 25 Ilicicolin H compound biosynthesis. (A) Comparison of the amino acid sequence identity of IccA and its homologues. (B) Domain comparison of IccA and its homologues: homologous genes are connected by a band of the same color. (C) The biosynthetic pathway for ilicicolin H.
Figure 25 Ilicicolin H compound biosynthesis. (A) Comparison of the amino acid sequence identity of IccA and its homologues. (B) Domain comparison of IccA and its homologues: homologous genes are connected by a band of the same color. (C) The biosynthetic pathway for ilicicolin H.CC BY · PubMed Central

Verification

Claims the paper makes

The claims and statistics of this paper haven’t been checked yet.

Run the check — free, no account needed. It reads the open-access text and checks the sources it cites.

A few free checks a day · papers already verified open instantly · results are public

Self-check

Percentages, sums and reported differences re-computed from the paper’s own numbers.

The self-check needs the paper’s full text.

Citations

Cites

Show all 110 references

Metadata

Authors
Lin, C., Feng, X.-L., Liu, Y., Li, Z.-C., Li, X.-Z., & Qi, J.
Affiliations
  • Northwest A&F University (CN)
  • Shaanxi Key Laboratory of Natural Products & Chemical Biology, College of Chemistry & Pharmacy, Northwest A&F University, Yangling, Xianyang 712100, China
  • State Key Laboratory of Plateau Ecology and Agriculture, Qinghai Academy of Animal and Veterinary Sciences, Qinghai University, Xining 810016, China
Corresponding author
Qi, Jianzhao
Venue
Journal of Fungi
Publisher
MDPI AG
Published
2023-08-15
Volume
9
Issue
8
Pages
850
ISSN
2309-608X (ISSN-L)
OpenAlex
W4385840277
Cited by
32
References
110
Citations by year
2026: 8 · 2025: 16 · 2024: 6 · 2023: 2
FWCI
4.98
Type
journal article
Language
en
Open access
Locations
  • Journal of Fungi (publishedVersion, cc-by)
  • Preprints.org (acceptedVersion, cc-by)
  • PubMed Central (publishedVersion, cc-by)
  • PubMed (publishedVersion)
  • DOAJ (DOAJ: Directory of Open Access Journals) (submittedVersion, cc-by-sa)
Funders
Key R&D Projects in Shaanxi Province of China (2023-YBSF-164)
Topics
  • Life Sciences › Immunology and Microbiology › Applied Microbiology and Biotechnology › Microbial Natural Products and Biosynthesis
  • Life Sciences › Agricultural and Biological Sciences › Plant Science › Mycotoxins in Agriculture and Food
  • Life Sciences › Agricultural and Biological Sciences › Plant Science › Plant Pathogens and Fungal Diseases
Keywords
Fusarium, mycotoxin biosynthesis, biosynthetic gene clusters, secondary metabolites, fungal toxin production, comparative genomics, plant pathogens, food poisoning

About these checks

Registry, retraction, Cites and statistics results are computed, not judged, with one exception: a printed reference that no index lists is read once by a model before it counts as a citation error. Claims are extracted by a model and kept only when their quote appears verbatim in the text; each cited source is then checked, with a model’s help, for whether it says what the claim relies on. Those verdicts can be wrong — read the claim’s quote and the cited source before relying on one.

Statistics and arithmetic are recomputed, not judged.

Confidence bands are shown only for fields calibrated on our annotated test set. None is calibrated yet, so no band is shown.

What counts as a claim ›How we measure confidence ›How we check this ›

Are you an author, or do you see a problem with this page? Request a review

How to cite

Cite CoChat for the checks on this page, and the paper for its own findings.

This page
CoChat. (2026). Citation check: Bioinformatic Analysis of Secondary Metabolite Biosynthetic Potential in Pathogenic Fusarium. https://app.cochat.ai/papers/10.3390/jof9080850
The paper
Lin, C., Feng, X.-L., Liu, Y., Li, Z.-C., Li, X.-Z., & Qi, J. (2023). Bioinformatic Analysis of Secondary Metabolite Biosynthetic Potential in Pathogenic Fusarium. Journal of Fungi. https://doi.org/10.3390/jof9080850

Data sources

Bibliographic data: Semantic Scholar, OpenAlex, Crossref.

Contains information from the Semantic Scholar Academic Graph Datasets, made available under the ODC Attribution License (ODC-BY 1.0).

Semantic Scholar’s data is described in: Kinney, R., et al. (2023). The Semantic Scholar Open Data Platform. arXiv:2301.10140.