

The DOI matches its Crossref record; 300 of the 301 references it cites were found in a registry or an index.
Fabrications and Applications of Stimulus-Responsive Polymer Films and Patterns on Surfaces: A Review
Open accessAbstract
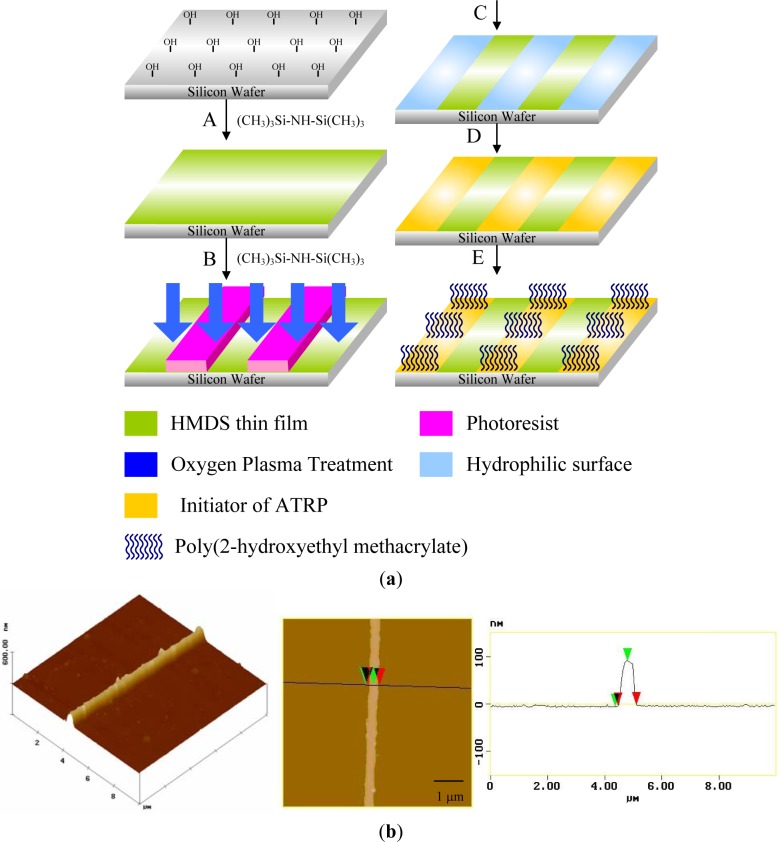
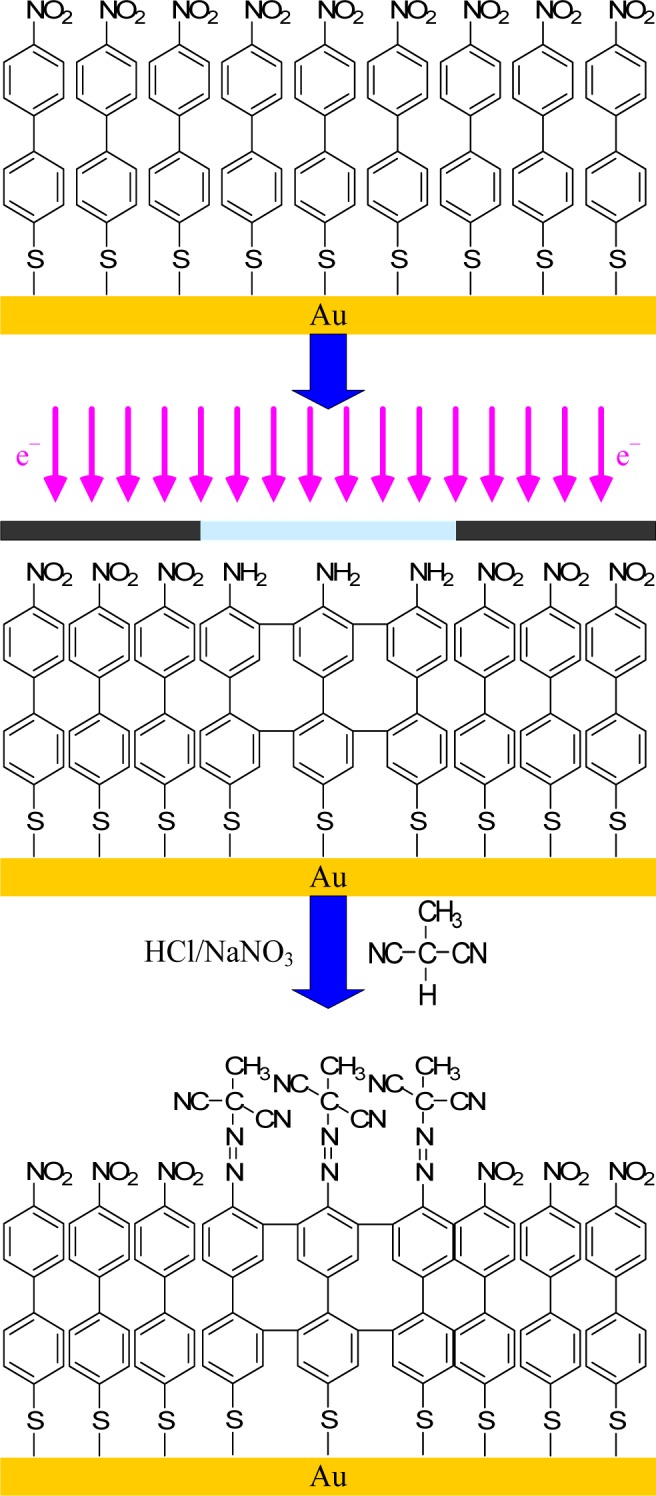
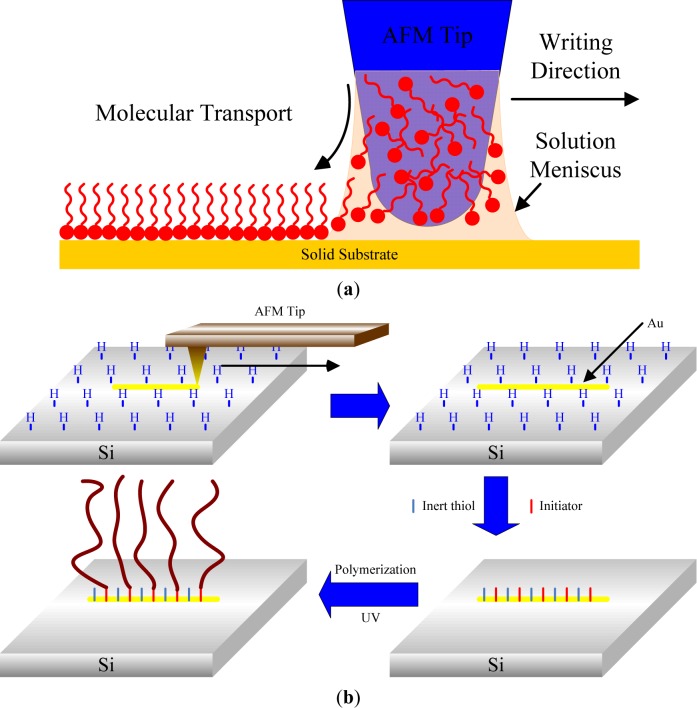
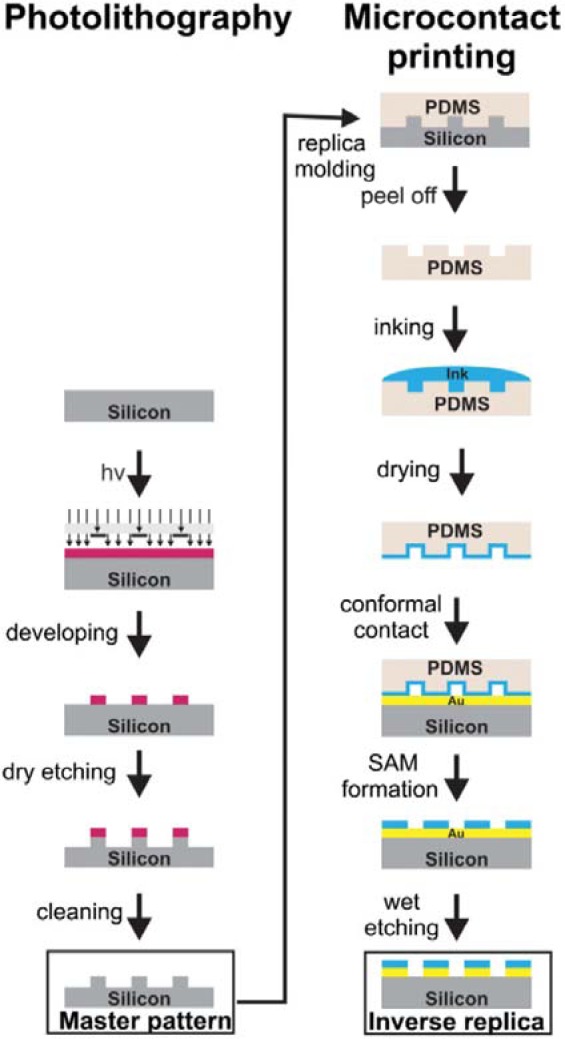
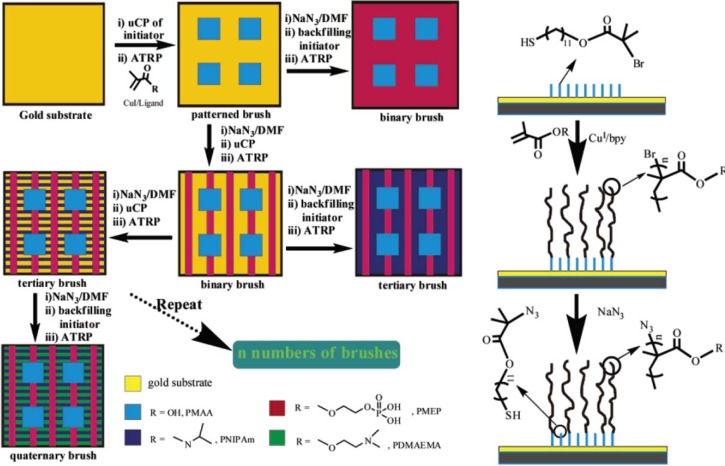
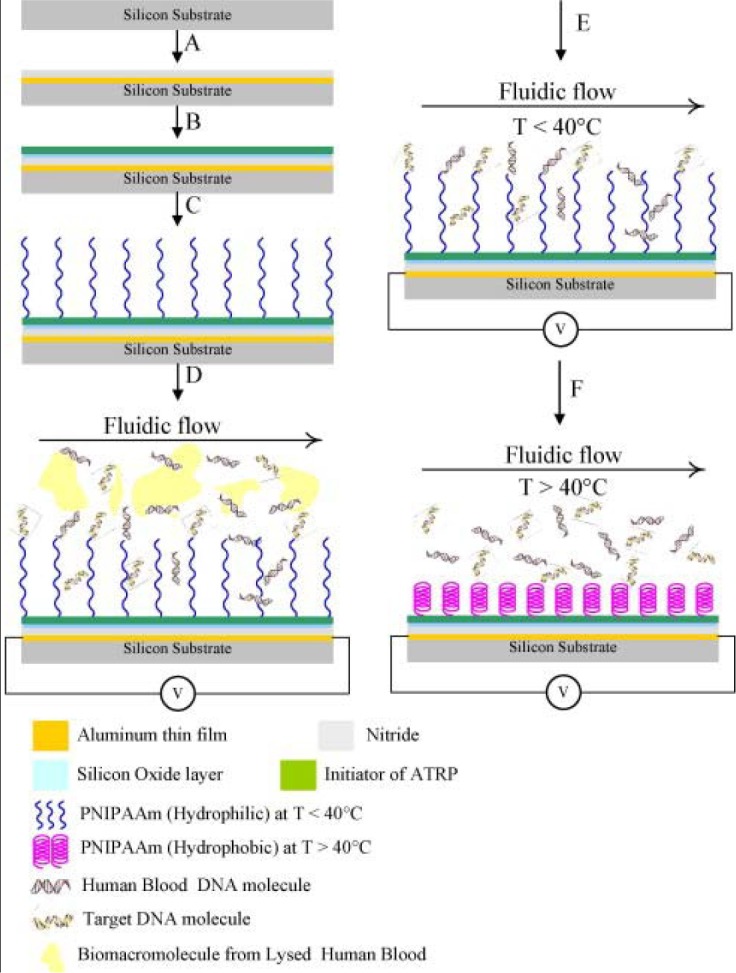
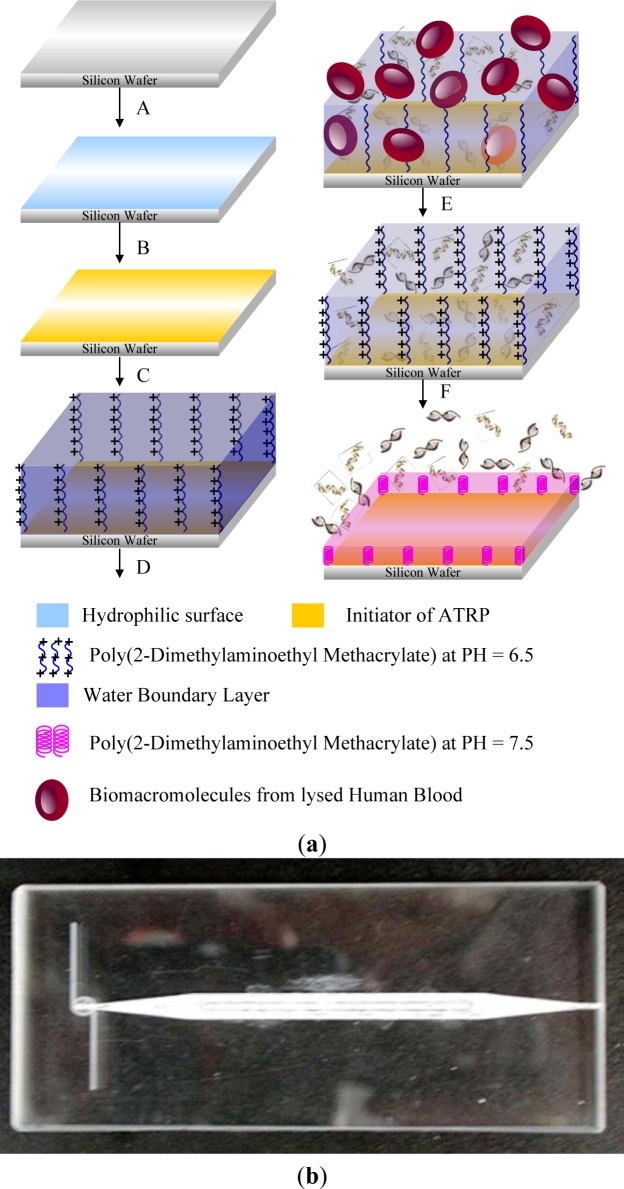
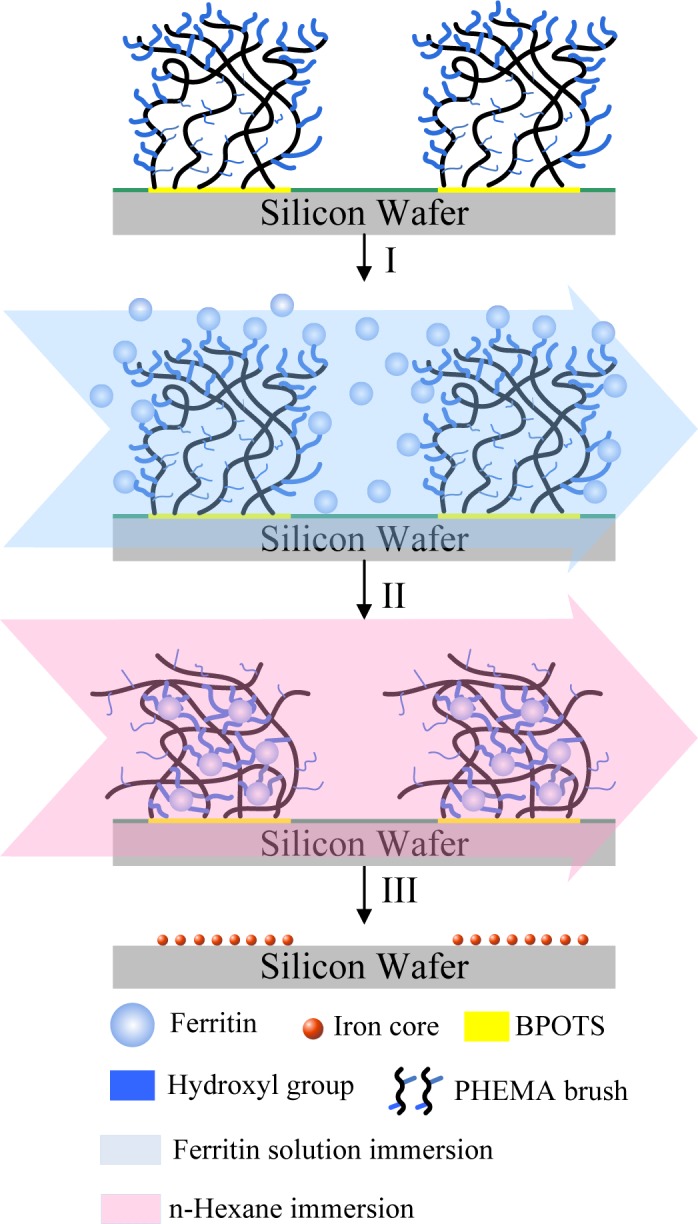
In the past two decades, we have witnessed significant progress in developing high performance stimuli-responsive polymeric materials. This review focuses on recent developments in the preparation and application of patterned stimuli-responsive polymers, including thermoresponsive layers, pH/ionic-responsive hydrogels, photo-responsive film, magnetically-responsive composites, electroactive composites, and solvent-responsive composites. Many important new applications for stimuli-responsive polymers lie in the field of nano- and micro-fabrication, where stimuli-responsive polymers are being established as important manipulation tools. Some techniques have been developed to selectively position organic molecules and then to obtain well-defined patterned substrates at the micrometer or submicrometer scale. Methods for patterning of stimuli-responsive hydrogels, including photolithography, electron beam lithography, scanning probe writing, and printing techniques (microcontact printing, ink-jet printing) were surveyed. We also surveyed the applications of nanostructured stimuli-responsive hydrogels, such as biotechnology (biological interfaces and purification of biomacromoles), switchable wettability, sensors (optical sensors, biosensors, chemical sensors), and actuators.
Overview
The claims and statistics of this paper haven’t been checked yet.
Run the check — free, no account needed. It reads the open-access text and checks the sources it cites.
Integrity signals
Registry
Cites
Statistics
Figures
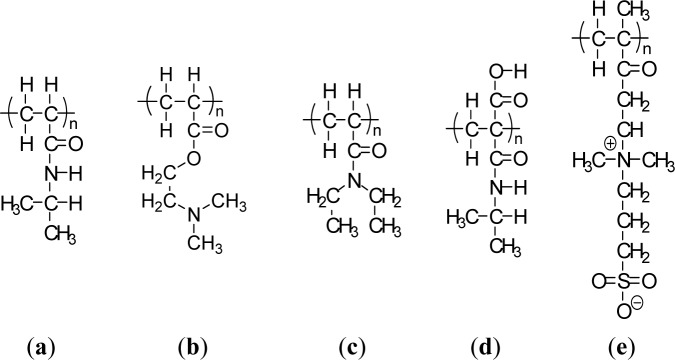
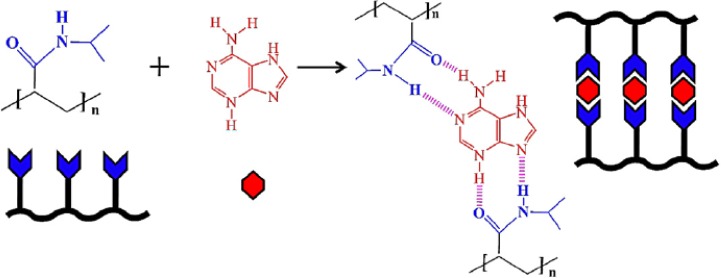
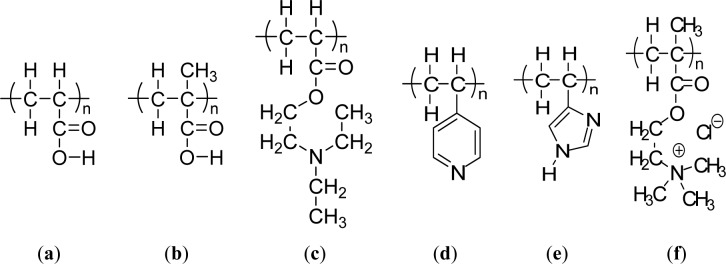
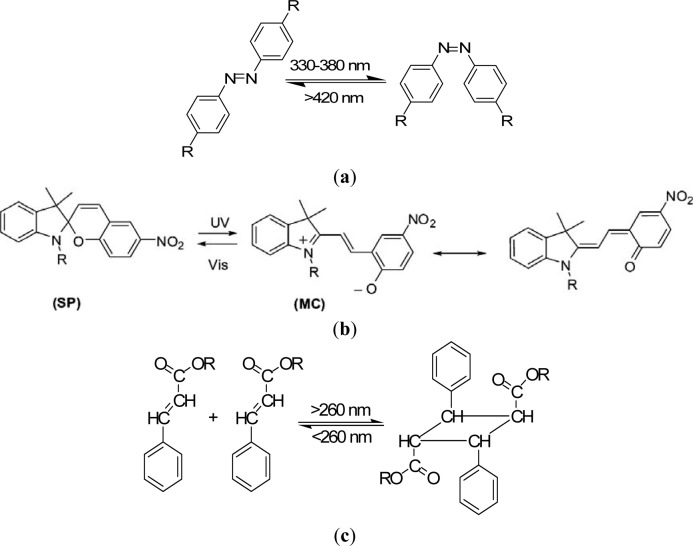
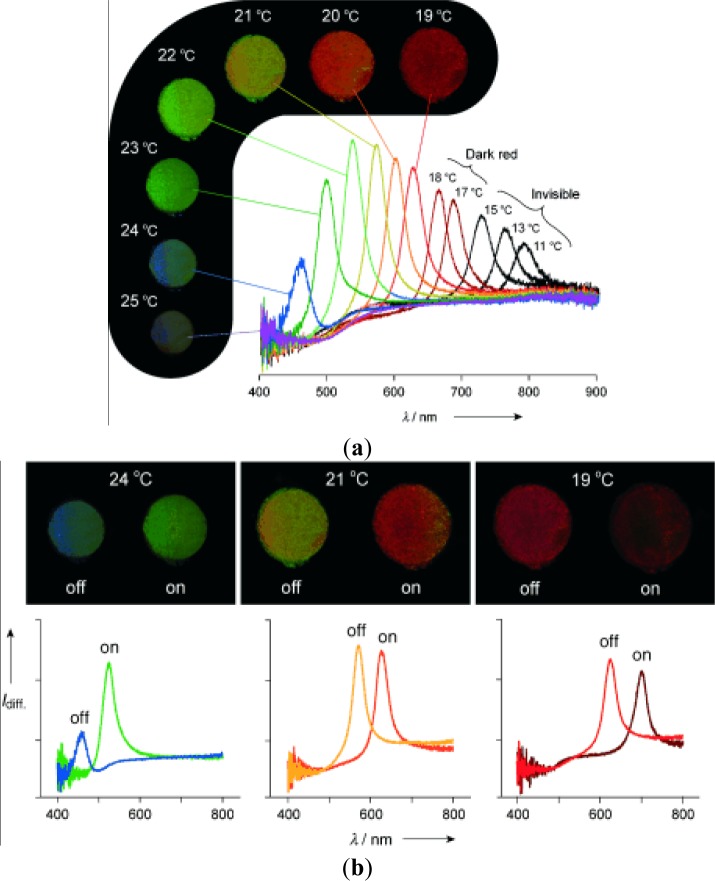
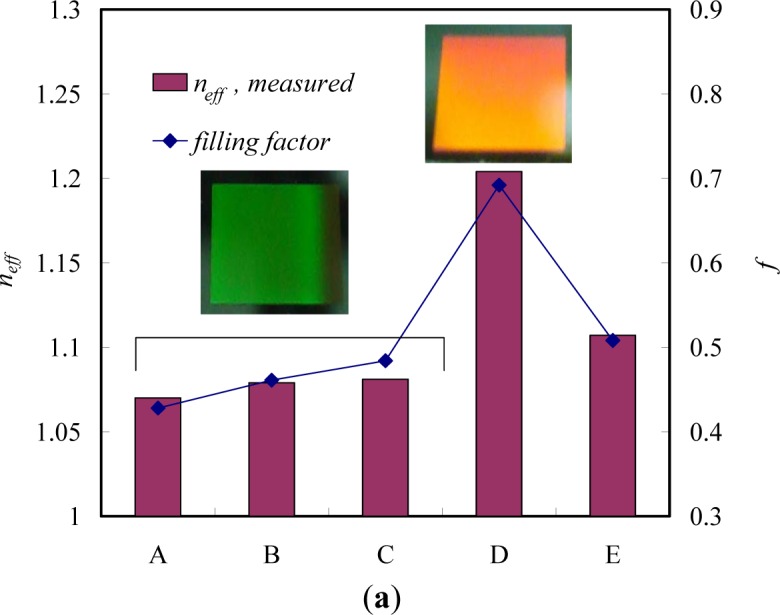
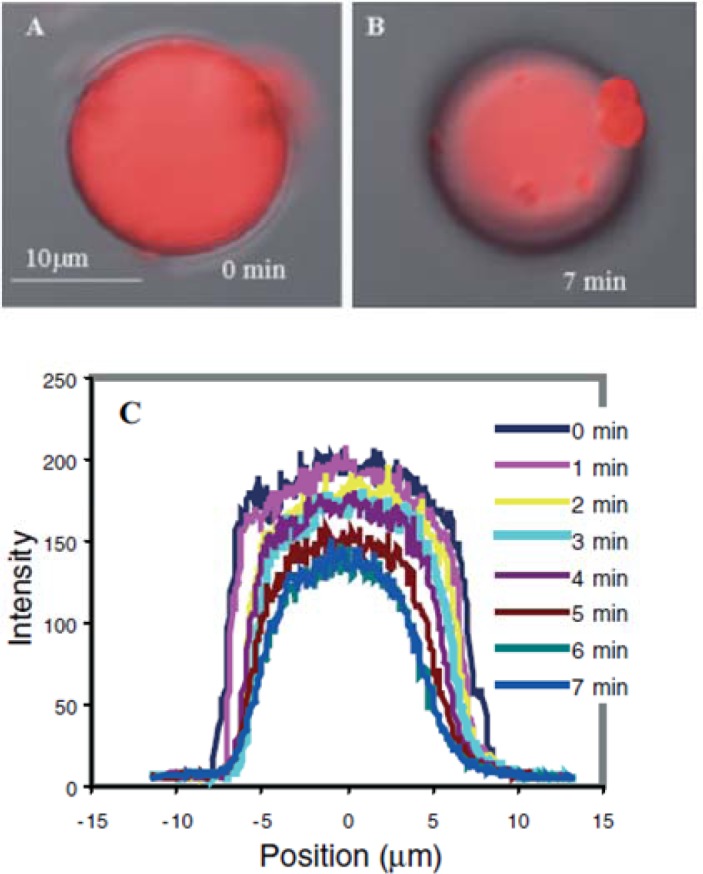
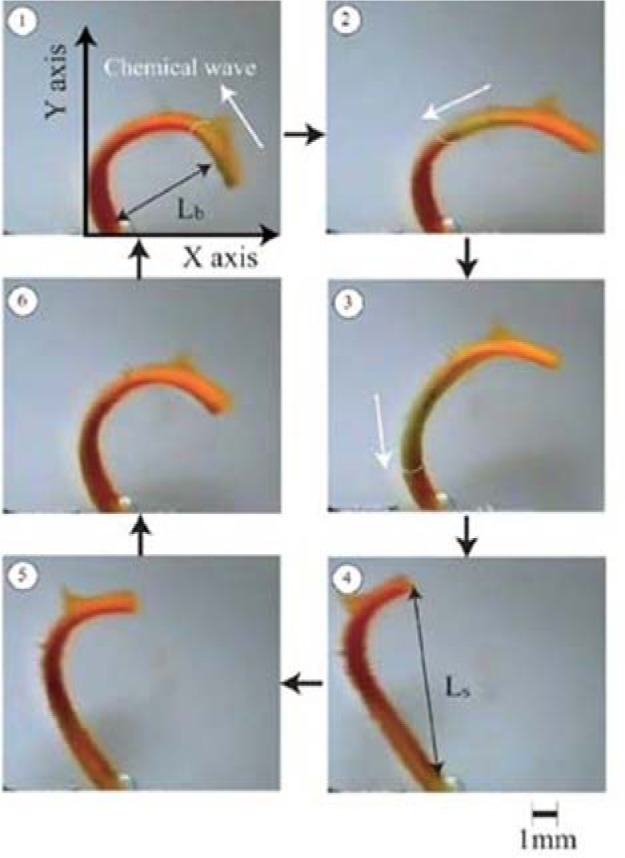
Verification
Claims the paper makes
The claims and statistics of this paper haven’t been checked yet.
Run the check — free, no account needed. It reads the open-access text and checks the sources it cites.
Claims other papers make about this one
Each is checked against this paper’s own text: does it say what the citing paper says it does?
The source backs part of the claim, not all of it — or backs it for a different population, condition or comparison.
In the citing paper
“Moreover, the chemical configuration of stimuli-responsive nanomicelles may be changed intensely reacting to pH, temperature, light, ultrasound, and enzyme deprivation (Figure 6) [131,132].”
From Recent Advances in Nanomicelles Delivery Systems. (2020) · cites this paper as [131]
Experimental — accuracy not yet measured
Self-check
Percentages, sums and reported differences re-computed from the paper’s own numbers.
The self-check needs the paper’s full text.
Citations
Cites
Poly(N-isopropylacrylamide): experiment, theory and application
Schild, H. G. (1992) · Progress in Polymer Science · doi:10.1016/0079-6700(92)90023-r · Cited by 5,162
Feng, Q., Wu, J., Chen, G., Cui, F. Z., Kim, T.-G., & Kim, J. O. (2000) · Journal of Biomedical Materials Research · doi:10.1002/1097-4636(20001215)52:4 · Cited by 4,032
Self-citationEnvironment-sensitive hydrogels for drug delivery
Qiu, Y., & Park, K. (2001) · Advanced Drug Delivery Reviews · doi:10.1016/s0169-409x(01)00203-4 · Cited by 3,972
Solution Properties of Poly(N-isopropylacrylamide)
Heskins, M., & Guillet, J. E. (1968) · Journal of Macromolecular Science Part A - Chemistry · doi:10.1080/10601326808051910 · Cited by 3,163
Piner, R. D., Zhu, J. S., Xu, F., Hong, S., & Mirkin, C. A. (1999) · Science · doi:10.1126/science.283.5402.661 · Cited by 3,058
Functional hydrogel structures for autonomous flow control inside microfluidic channels
Beebe, D. J., Moore, J. S., Bauer, J. M., Yu, Q., Liu, R. H., Devadoss, C., & Jo, B.-H. (2000) · Nature · doi:10.1038/35007047 · Cited by 1,972
Concentration Wave Propagation in Two-dimensional Liquid-phase Self-oscillating System
ZAIKIN, A. N., & Zhabotinsky, A. M. (1970) · Nature · doi:10.1038/225535b0 · Cited by 1,912
Temperature-sensitive aqueous microgels
Pelton, R. H. (2000) · Advances in Colloid and Interface Science · doi:10.1016/s0001-8686(99)00023-8 · Cited by 1,899
The development of microgels/nanogels for drug delivery applications
Oh, J. K., Drumright, R., Siegwart, D. J., & Matyjaszewski, K. A. (2008) · Progress in Polymer Science · doi:10.1016/j.progpolymsci.2008.01.002 · Cited by 1,623
Comb-type grafted hydrogels with rapid deswelling response to temperature changes
Yoshida, R., Uchida, K., Kaneko, Y., Sakai, K., Kikuchi, A., Sakurai, Y., & Okano, T. (1995) · Nature · doi:10.1038/374240a0 · Cited by 1,257
Research works printed but not linked: 2
- Bedard, 2007, Optically induced encapsulation, Macromol. Rapid Commun, 28, 1517
- Wan, 2012, Interfacial supramolecular chemistry for stimuli-responsive functional surfaces, Prog. Chem, 24, 1
Cited by
Sorted by citations
Soft Actuators for Small-Scale Robotics
Hines, L., Petersen, K., Lum, G. Z., & Sitti, M. (2017) · Advanced Materials · doi:10.1002/adma.201603483 · Cited by 1,337
Lee, Y., Song, W. J., & Sun, J. (2020) · Materials Today Physics · doi:10.1016/j.mtphys.2020.100258 · Cited by 523
Field responsive materials: photo-, electro-, magnetic- and ultrasound-sensitive polymers
Manouras, T., & Vamvakaki, M. (2016) · Polymer Chemistry · doi:10.1039/c6py01455k · Cited by 330
Thermoresponsive poly(2-oxazoline)s, polypeptoids, and polypeptides
Hoogenboom, R., & Schlaad, H. (2016) · Polymer Chemistry · doi:10.1039/c6py01320a · Cited by 303
Tavassoli, H., Alhosseini, S. N., Tay, A. K. P., Chan, P. P. Y., Oh, S. K. W., & Warkiani, M. E. (2018) · Biomaterials · doi:10.1016/j.biomaterials.2018.07.016 · Cited by 180
Recent Advances in Nanomicelles Delivery Systems.
Tawfik, S. M., Azizov, S., Elmasry, M. R., Sharipov, M., & Lee, Y.-I. (2020) · Nanomaterials · doi:10.3390/nano11010070 · Cited by 156
“Moreover, the chemical configuration of stimuliresponsive nanomicelles may be changed intensely reacting to pH, temperature, light, ultrasound, and enzyme deprivation (Figure 6) [131,132].”
BackgroundStimuli-sensitive layer-by-layer (LbL) self-assembly systems: Targeting and biosensory applications
Deshmukh, P. K., Ramani, K. P., Singh, S. S., Tekade, A. R., Chatap, V. K., Patil, G. B., & Bari, S. B. (2013) · Journal of Controlled Release · doi:10.1016/j.jconrel.2012.12.033 · Cited by 150
Design of thiol- and light-sensitive degradable hydrogels using Michael-type addition reactions
Kharkar, P. M., Kiick, K. L., & Kloxin, A. M. (2015) · Polymer Chemistry · doi:10.1039/c5py00750j · Cited by 137
Directed Motility of Hygroresponsive Biomimetic Actuators
Zhang, L., Chizhik, S. A., Wen, Y., & Naumov, P. (2015) · Advanced Functional Materials · doi:10.1002/adfm.201503922 · Cited by 120
Smart composite hydrogel with pH-, ionic strength- and temperature-induced actuation
Shang, J., & Théato, P. (2018) · Soft Matter · doi:10.1039/c8sm01728j · Cited by 115
To what extent do polymeric stabilizers affect nanoparticles characteristics?
Madkour, M., Bumajdad, A., & Al-Sagheer, F. A. (2019) · Advances in Colloid and Interface Science · doi:10.1016/j.cis.2019.05.004 · Cited by 111
Stimuli-Responsive Polysaccharide Hydrogels for Biomedical Applications: a Review
Gholamali, I. (2019) · Regenerative Engineering and Translational Medicine · doi:10.1007/s40883-019-00134-1 · Cited by 96
Zhang, Z., Sèbe, G., Wang, X., & Tam, K. C. (2017) · Carbohydrate Polymers · doi:10.1016/j.carbpol.2017.10.094 · Cited by 93
Novel levan and pNIPA temperature sensitive hydrogels for 5-ASA controlled release
Osman, A., Öner, E. T., & Eroğlu, M. S. (2017) · Carbohydrate Polymers · doi:10.1016/j.carbpol.2017.01.097 · Cited by 92
Magnetoelectric micromachines with wirelessly controlled navigation and functionality
Chen, X., Shamsudhin, N., Hoop, M., Pieters, R., Siringil, E. C., Sakar, M. S., Nelson, B. J., & Pané, S. (2015) · Materials Horizons · doi:10.1039/c5mh00259a · Cited by 82
Seidi, F., Salimi, H., Shamsabadi, A. A., & Shabanian, M. (2017) · Progress in Polymer Science · doi:10.1016/j.progpolymsci.2017.07.006 · Cited by 74
Rittikulsittichai, S., Kolhatkar, A. G., Sarangi, S., Vorontsova, M. A., Vekilov, P. G., Brazdeikis, A., & Lee, T. R. (2016) · Nanoscale · doi:10.1039/c5nr09235c · Cited by 69
Trigger Chemistries for Better Industrial Formulations
Wang, H.-C., Zhang, Y., Casey, C. M. P., Zimmerman, S. C., Cheng, J., Moore, J. S., Harris, K., & Katz, J. S. (2015) · ACS Applied Materials & Interfaces · doi:10.1021/acsami.5b00485 · Cited by 68
Amoli‐Diva, M., Sadighi‐Bonabi, R., & Pourghazi, K. (2017) · Materials Science and Engineering C · doi:10.1016/j.msec.2017.03.038 · Cited by 68
Tuning the gelation of thermoresponsive gels
Constantinou, A. P., & Georgiou, T. K. (2016) · European Polymer Journal · doi:10.1016/j.eurpolymj.2016.02.014 · Cited by 65
Femtosecond laser direct writing of functional stimulus-responsive structures and applications
Zhang, Y., Wu, D. Q., Zhang, Y., Bian, Y., Wang, C., Li, J., Chu, J., & Hu, Y. (2023) · International Journal of Extreme Manufacturing · doi:10.1088/2631-7990/acf798 · Cited by 63
Taylor, J. M., Luan, H., Lewis, J. A., Rogers, J. A., Nuzzo, R. G., & Braun, P. V. (2022) · Advanced Materials · doi:10.1002/adma.202108391 · Cited by 59
Surface Engineering with Polymer Brush Photolithography
Fromel, M., Li, M., & Pester, C. W. (2020) · Macromolecular Rapid Communications · doi:10.1002/marc.202000177 · Cited by 58
Li, L., Zeng, Y., Chen, M., & Liu, G. (2022) · Polymers · doi:10.3390/polym14163278 · Cited by 59
Shapeable Material Technologies for 3D Self‐Assembly of Mesoscale Electronics
Karnaushenko, D., Kang, T. H., & Schmidt, O. G. (2019) · Advanced Materials Technologies · doi:10.1002/admt.201800692 · Cited by 56
A multi-responsive bidirectional bending actuator based on polypyrrole and agar nanocomposites
Wang, T., Li, M., Zhang, H., Sun, Y., & Dong, B. (2018) · Journal of Materials Chemistry C · doi:10.1039/c8tc00747k · Cited by 51
Solvent triggered shape morphism of 4D printed hydrogels
Parimita, S., Kumar, A., Hariharan, K., & Ghosh, P. (2022) · Journal of Manufacturing Processes · doi:10.1016/j.jmapro.2022.11.065 · Cited by 49
Hsieh, S., Reddy, P., Chang, C., Kumar, A., Wu, W.-C., & Lin, H. (2016) · Polymers · doi:10.3390/polym8060238 · Cited by 49
Self-citationFabrication and applications of stimuli‐responsive micro/nanopillar arrays
Park, J. E., Won, S., Cho, W., Kim, J. G., Jhang, S., Lee, J. G., & Wie, J. J. (2021) · Journal of Polymer Science · doi:10.1002/pol.20210311 · Cited by 51
Silva, F. E. F., Batista, K. D. A., Leal, M. C. B. D. M., da Silva, C. N. S., Moreira, B. R., & Fernandes, K. F. (2015) · Materials Science and Engineering C · doi:10.1016/j.msec.2015.09.064 · Cited by 46
Thermoresponsive gels based on ABC triblock copolymers: effect of the length of the PEG side group
Constantinou, A. P., & Georgiou, T. K. (2016) · Polymer Chemistry · doi:10.1039/c5py02072g · Cited by 46
Engineering the Immune Response to Biomaterials
Moghaddam, A. S., Bahrami, M., Sarikhani, E., Tutar, R., Ertaş, Y. N., Tamimi, F., Hedayatnia, A., Jugie, C., Savoji, H., Qureshi, A., et al. (2025) · Advanced Science · doi:10.1002/advs.202414724 · Cited by 49
Scolari, V. F., & Lagomarsino, M. C. (2014) · Soft Matter · doi:10.1039/c4sm02434f · Cited by 43
Sartipzadeh, O., Naghib, S. M., Haghiralsadat, F., Shokati, F., & Rahmanian, M. (2022) · Scientific Reports · doi:10.1038/s41598-022-12031-9 · Cited by 42
Indermun, S., Govender, M., Kumar, P., Choonara, Y. E., & Pillay, V. (2018) · Elsevier eBooks · doi:10.1016/b978-0-08-101997-9.00002-3 · Cited by 42
Safety regulation of gel electrolytes in electrochemical energy storage devices
Yu, D., Li, X., & Xu, J. (2019) · Science China Materials · doi:10.1007/s40843-019-9475-4 · Cited by 42
Tuning the Gelation of Thermoresponsive Gels Based on Triblock Terpolymers
Constantinou, A. P., Zhan, B., & Georgiou, T. K. (2021) · Macromolecules · doi:10.1021/acs.macromol.0c02533 · Cited by 42
Telitel, S., Telitel, S., Bosson, J., Lalevée, J., Jean-Louis, C., Godfroy, M., Fillaut, J., Akdas, H., Guillaneuf, Y., Gigmès, D., et al. (2015) · Langmuir · doi:10.1021/acs.langmuir.5b01681 · Cited by 39
Thomas, M., Gajda, M., Naini, C. A., Franzka, S., Ulbricht, M., & Hartmann, N. (2015) · Langmuir · doi:10.1021/acs.langmuir.5b03448 · Cited by 39
Sun, J., Jiang, J., Bao, B., Wang, S., He, M., Zhang, X., & Song, Y. (2016) · Materials · doi:10.3390/ma9040253 · Cited by 38
Liquid crystal polymers with motile surfaces
Visschers, F. L. L., Hendrikx, M., Zhan, Y., & Liu, D. (2018) · Soft Matter · doi:10.1039/c8sm00524a · Cited by 38
Huang, C. (2016) · Polymer Journal · doi:10.1038/pj.2016.24 · Cited by 38
Thermoresponsive Tetrablock Terpolymers: Effect of Architecture and Composition on Gelling Behavior
Constantinou, A. P., Sam-Soon, N. F., Carroll, D. R., & Georgiou, T. K. (2018) · Macromolecules · doi:10.1021/acs.macromol.8b01251 · Cited by 37
Vyas, B., Pillai, S. A., Bahadur, A., & Bahadur, P. (2018) · Polymers · doi:10.3390/polym10010076 · Cited by 36
4D printing of pH-responsive bilayer with programmable shape-shifting behaviour
Parimita, S., Kumar, A., Hariharan, K., & Ghosh, P. (2024) · European Polymer Journal · doi:10.1016/j.eurpolymj.2024.113581 · Cited by 37
Metal-Organic Framework-Based Stimuli-Responsive Polymers
Wei, M., Wan, Y., & Zhang, X. (2021) · Journal of Composites Science · doi:10.3390/jcs5040101 · Cited by 34
Polymer platforms for micro- and nanomotor fabrication
Hermanová, S., & Pumera, M. (2018) · Nanoscale · doi:10.1039/c8nr00836a · Cited by 34
Ong, C. S., Shi, Y., Chang, J., Alduraiei, F., Ahmed, Z., & Wang, P. (2019) · Industrial & Engineering Chemistry Research · doi:10.1021/acs.iecr.8b06408 · Cited by 33
Smart Polymers and Coatings Obtained by Ionizing Radiation: Synthesis and Biomedical Applications
Melendez‐Ortiz, H. I., Varca, G. H. C., Lugão, A. B., & Bucio, E. (2015) · Open Journal of Polymer Chemistry · doi:10.4236/ojpchem.2015.53003 · Cited by 33
Zeng, J.-R., Cheng, C., Chang, C., Huang, C., & Chen, J.-K. (2016) · Dyes and Pigments · doi:10.1016/j.dyepig.2016.11.047 · Cited by 33
Self-citationFrysali, M. A., & Anastasiadis, S. H. (2017) · Langmuir · doi:10.1021/acs.langmuir.7b02098 · Cited by 32
Sarikaya, S., Gardea, F., Auletta, J. T., Kavosi, J., Langrock, A., Mackie, D. M., & Naraghi, M. (2021) · Sensors and Actuators B Chemical · doi:10.1016/j.snb.2021.129703 · Cited by 33
Recent advances in stimuli-responsive polymers for sensing and actuation
Hu, L., Shu, T., Wan, Y., Fang, C., Gao, F., & Serpe, M. J. (2021) · Molecular Systems Design & Engineering · doi:10.1039/d0me00133c · Cited by 32
Zhang, Y., Zhang, H., Liu, P., Sun, H., Li, B., & Wang, W. (2019) · ACS Sustainable Chemistry & Engineering · doi:10.1021/acssuschemeng.8b06714 · Cited by 30
Solvent triggered irreversible shape morphism of biopolymer films
Rath, A., Geethu, P. M., Mathesan, S., Satapathy, D. K., & Ghosh, P. (2018) · Soft Matter · doi:10.1039/c8sm00042e · Cited by 30
Quilis, N. G., Hageneder, S., Fossati, S., Auer, S. K., Venugopalan, P., Bozdogan, A., Petri, C., Moreno‐Cencerrado, A., Toca-Herrera, J. L., Jonas, U., et al. (2020) · The Journal of Physical Chemistry C · doi:10.1021/acs.jpcc.9b11059 · Cited by 29
Abdelaty, M. S. A., & Kuckling, D. (2016) · Gels · doi:10.3390/gels2010003 · Cited by 28
Triple-stimuli responsive polymers with fine tuneable magnetic responses
Alard, I. C., Soubhye, J., Berger, G., Gelbcke, M., Spassov, S., Amighi, K., Goole, J., & Meyer, F. (2017) · Polymer Chemistry · doi:10.1039/c7py00218a · Cited by 28
Verma, A., Parashar, A., & van Duin, A. C. T. (2022) · Elsevier eBooks · doi:10.1016/b978-0-12-823789-2.00009-1 · Cited by 27
Roghani‐Mamaqani, H., & Tajmoradi, Z. (2022) · Wiley eBooks · doi:10.1002/9783527832385.ch2 · Cited by 26
Chang, C., Reddy, P. M., Hsieh, S., & Huang, H.-C. (2014) · Soft Matter · doi:10.1039/c4sm01994f · Cited by 24
Self-citationDynamism of Stimuli-Responsive Nanohybrids: Environmental Implications
Plazas‐Tuttle, J., Rowles, L. S., Chen, H., Bisesi, J. H., Sabo‐Attwood, T., & Saleh, N. B. (2015) · Nanomaterials · doi:10.3390/nano5021102 · Cited by 23
Environmental Functional Photo-Cross-Linked Hydrogel Bilayer Thin Films from Vanillin
Abdelaty, M. S. A. (2017) · Journal of Polymers and the Environment · doi:10.1007/s10924-017-1126-y · Cited by 23
Rajabi, M., & Feyzbakhsh, H. (2025) · RSC Advances · doi:10.1039/d5ra05399d · Cited by 31
Electric-stimulus-responsive multilayer films based on a cobaltocenium-containing polymer
Wei, J., Ren, L., Tang, C., & Su, Z. (2014) · Polymer Chemistry · doi:10.1039/c4py00918e · Cited by 22
Panzarasa, G., Soliveri, G., & Pifferi, V. (2015) · Journal of Materials Chemistry C · doi:10.1039/c5tc03367e · Cited by 22
Recent advances in responsive membrane functionalization approaches and applications
Mills, R., Baldridge, K. C., Bernard, M., & Bhattacharyya, D. (2022) · Separation Science and Technology · doi:10.1080/01496395.2022.2145222 · Cited by 21
Parylene C Surface Functionalization and Patterning with pH-Responsive Microgels
Calcagnile, P., Blasi, L., Rizzi, F., Qualtieri, A., Athanassiou, A., Gogolides, Ε., & Vittorio, M. D. (2014) · ACS Applied Materials & Interfaces · doi:10.1021/am502467y · Cited by 21
Abdelaty, M. S. A. (2018) · Polymer Bulletin · doi:10.1007/s00289-018-2297-y · Cited by 21
Molecular-Gated Drug Delivery Systems Using Light-Triggered Hydrophobic-to-Hydrophilic Switches
Ghani, M., Heiskanen, A. R., Thomsen, P., Alm, M., & Emnéus, J. (2021) · ACS Applied Bio Materials · doi:10.1021/acsabm.0c01458 · Cited by 22
Microstructured Magnetoactive Elastomers for Switchable Wettability
Kriegl, R., Kravanja, G., Hribar, L., Čoga, L., Drevenšek‐Olenik, I., Jezeršek, M., Kalin, M., & Shamonin, M. (2022) · Polymers · doi:10.3390/polym14183883 · Cited by 19
Thin films of PS/PS‐b‐pnipam and ps/pnipam polymer blends with tunable wettability
Kanidi, M., Papagiannopoulos, A., Skandalis, A., Kandyla, M., & Pispas, S. (2019) · Journal of Polymer Science Part B Polymer Physics · doi:10.1002/polb.24822 · Cited by 19
Responsive polyelectrolyte complexes based on natural polysaccharides for drug delivery applications
Emmanuel, B. D., Abu-Thabit, N. Y., & Ngwuluka, N. C. (2018) · Elsevier eBooks · doi:10.1016/b978-0-08-101997-9.00014-x · Cited by 21
Functional properties of photo-crosslinkable biodegradable polyurethane nanocomposites
Salgado, C., Arrieta, M. P., Sessini, V., Peponi, L., López, D., & Fernández‐García, M. (2020) · Polymer Degradation and Stability · doi:10.1016/j.polymdegradstab.2020.109204 · Cited by 19
Havanur, S., Farheenand, V., & JagadeeshBabu, P. E. (2018) · Iranian Polymer Journal · doi:10.1007/s13726-018-0680-z · Cited by 18
He, Y., Gao, Q., Lv, C., & Liu, L. (2020) · Journal of Photochemistry and Photobiology B Biology · doi:10.1016/j.jphotobiol.2020.112102 · Cited by 18
Micro- to Nanoscale Bio-Hybrid Hydrogels Engineered by Ionizing Radiation
Dispenza, C., Giacomazza, D., & Jönsson, M. (2020) · Biomolecules · doi:10.3390/biom11010047 · Cited by 18
Engineering polymer film porosity for solvent triggered actuation
Pervin, R., Ghosh, P., & Basavaraj, M. G. (2021) · Soft Matter · doi:10.1039/d0sm01772h · Cited by 18
Siegwardt, L., Glößner, V., Boehm, A. K., Schneider, M., & Gallei, M. (2024) · ACS Applied Materials & Interfaces · doi:10.1021/acsami.3c17974 · Cited by 17
Roach, J. D., Bondaruk, M. M., Al-Abdulghani, A., & Shahrori, Z. (2016) · Advances in Materials Physics and Chemistry · doi:10.4236/ampc.2016.69025 · Cited by 17
Biomaterials and Stem Cells: Promising Tools in Tissue Engineering and Biomedical Applications
Sekuła, M., & Zuba‐Surma, E. K. (2018) · InTech eBooks · doi:10.5772/intechopen.70122 · Cited by 17
Smart microdevices for biomedical drug delivery: endogenous stimuli as the key to safer therapeutics
Datta, D., Colaco, V., Nison, M., Ananya Prabha, H., Bandi, S. P., Dhas, N. L., Pai, V., Halagali, P., Tippavajhala, V. K., Singh, S. A., et al. (2026) · RSC Advances · doi:10.1039/d5ra09767c · Cited by 18
Bao, N., Gold, J. I., Sheavly, J. K., Schauer, J. J., Zavala, V. M., Lehn, R. C. V., Mavrikakis, M., & Abbott, N. L. (2022) · Journal of the American Chemical Society · doi:10.1021/jacs.2c03424 · Cited by 16
Introduction of smart polymer nanocomposites
Yaqoob, A. A., Safian, M. T.-U., Rashid, M., Parveen, T., Umar, K., & Ibrahim, M. N. M. (2021) · Elsevier eBooks · doi:10.1016/b978-0-12-819961-9.00007-4 · Cited by 18
Wu, S.-P., Zhu, X., Yang, J., & Nie, J. (2015) · Chemical Communications · doi:10.1039/c4cc10441b · Cited by 16
pH-Responsive Copolymer Films Prepared by Surface-Initiated Polymerization and Simple Modification
Deng, X., Livingston, J. L., Spear, N. J., & Jennings, G. K. (2020) · Langmuir · doi:10.1021/acs.langmuir.9b03026 · Cited by 16
de Boer, K., & Schroën, K. G. P. H. (2024) · Separation and Purification Technology · doi:10.1016/j.seppur.2024.126288 · Cited by 18
User-friendly chemical patterning with digital light projection polymer brush photolithography
Fromel, M., Crisci, R. L., Sankhe, C. S., Hickey, D. R., Tighe, T. B., Gomez, E. W., & Pester, C. W. (2021) · European Polymer Journal · doi:10.1016/j.eurpolymj.2021.110652 · Cited by 15
Waheed, A., Mazumder, M. A. J., Al‐Ahmed, A., Roy, P., & Ullah, N. (2019) · Polymers and polymeric composites · doi:10.1007/978-3-319-95990-0_4 · Cited by 15
Asymmetric polymer materials: Synthesis, structure, and performance
Hnatchuk, N., Pawale, T., & Li, X. (2022) · Polymer · doi:10.1016/j.polymer.2022.124607 · Cited by 15
Soft Matter Technology at KIT: Chemical Perspective from Nanoarchitectures to Microstructures
Grosjean, S., Wawryszyn, M., Mutlu, H., Bräse, S., Lahann, J., & Théato, P. (2019) · Advanced Materials · doi:10.1002/adma.201806334 · Cited by 15
Stanzione, F., & Jayaraman, A. (2015) · The Journal of Physical Chemistry B · doi:10.1021/acs.jpcb.5b06838 · Cited by 14
Abdelaty, M. S. A., & Kuckling, D. (2018) · Open Journal of Organic Polymer Materials · doi:10.4236/ojopm.2018.82002 · Cited by 14
Abdelaty, M. S. A. (2021) · Journal of Polymers and the Environment · doi:10.1007/s10924-021-02117-2 · Cited by 14
Smart polymers: key to targeted therapeutic interventions
Thakkar, D., Sehgal, R., Narula, A. K., & Deswal, D. (2024) · Chemical Communications · doi:10.1039/d4cc05098c · Cited by 13
Mehta, K., Peeketi, A. R., Sol, J. A. H. P., Debije, M. G., Onck, P. R., & Annabattula, R. K. (2020) · Mechanics of Materials · doi:10.1016/j.mechmat.2020.103388 · Cited by 13
Thermal stability of self-assembled surfaces and micropatterns made of ladder polysilsesquioxanes
Kowalewska, A., Nowacka, M., Makowski, T., & Michalski, A. (2016) · Polymer · doi:10.1016/j.polymer.2016.03.002 · Cited by 13
Angle-independent pH-sensitive composites with natural gyroid structure
Xue, R., Zhang, W., Sun, P., Zada, I., Guo, C., Liu, Q., Gu, J., Su, H., & Zhang, D. (2017) · Scientific Reports · doi:10.1038/srep42207 · Cited by 13
Abdelaty, M. S. A. (2020) · Journal of Polymers and the Environment · doi:10.1007/s10924-020-01793-w · Cited by 12
The Bioanalytical and Biomedical Applications of Polymer Modified Substrates
Liu, G., Sun, X., Li, X., & Wang, Z. (2022) · Polymers · doi:10.3390/polym14040826 · Cited by 12
Metadata
- Authors
- Chen, J.-K., & Chang, C.-J.
- Affiliations
- National Taiwan University of Science and Technology (TW)
- Feng Chia University (TW)
- Corresponding author
- Chang, Chi-Jung
- Venue
- Materials
- Publisher
- MDPI AG
- Published
- 2014-01-28
- Volume
- 7
- Issue
- 2
- Pages
- 805-875
- ISSN
- 1996-1944 (ISSN-L)
- PMC
- PMC5453090
- OpenAlex
- W2138602189
- Cited by
- 193
- References
- 301
- Citations by year
- 2026: 5 · 2025: 14 · 2024: 6 · 2023: 7 · 2022: 16 · 2021: 16 · 2020: 20 · 2019: 16 · 2018: 26 · 2017: 18 · 2016: 23 · 2015: 18 · 2014: 7
- FWCI
- 6.01
- Type
- journal article
- Language
- en
- Open access
- gold
- doi.org
- Licence
- Locations
- Materials (publishedVersion, cc-by)
- Europe PMC (PubMed Central) (publishedVersion, cc-by)
- PubMed Central (publishedVersion, cc-by)
- PubMed (publishedVersion)
- DOAJ (DOAJ: Directory of Open Access Journals) (submittedVersion)
- Funders
- National Science Council
- Topics
- Physical Sciences › Engineering › Mechanical Engineering › Advanced Materials and Mechanics
- Physical Sciences › Materials Science › Biomaterials › Hydrogels: synthesis, properties, applications
- Physical Sciences › Materials Science › Surfaces, Coatings and Films › Nanofabrication and Lithography Techniques
- Keywords
- stimuli-responsive polymers, thermosensitive hydrogel, pH-responsive hydrogels, electroactive composites, photolithography, electron beam lithography, microcontact printing, inkjet printing, switchable wettability, biosensors, chemical sensors, actuators, biointerfaces
About these checks
Registry, retraction, Cites and statistics results are computed, not judged, with one exception: a printed reference that no index lists is read once by a model before it counts as a citation error. Claims are extracted by a model and kept only when their quote appears verbatim in the text; each cited source is then checked, with a model’s help, for whether it says what the claim relies on. Those verdicts can be wrong — read the claim’s quote and the cited source before relying on one.
Statistics and arithmetic are recomputed, not judged.
Confidence bands are shown only for fields calibrated on our annotated test set. None is calibrated yet, so no band is shown.
What counts as a claim ›How we measure confidence ›How we check this ›
Are you an author, or do you see a problem with this page? Request a review
