

The DOI matches its Crossref record; 66 of the 67 references it cites were found in a registry or an index.
Removal of Naturally Occurring Strontium by Nanofiltration/Reverse Osmosis from Groundwater
Open accessAbstract
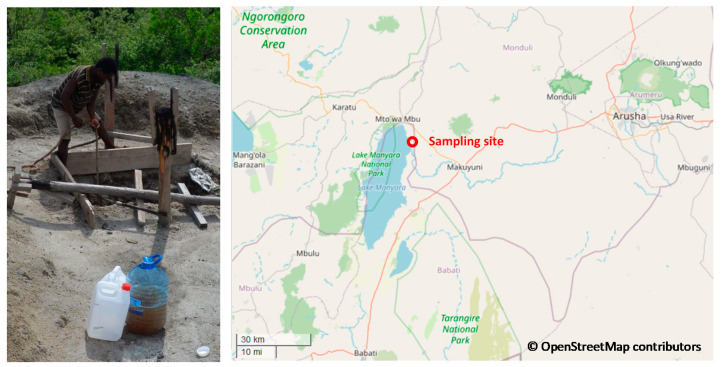
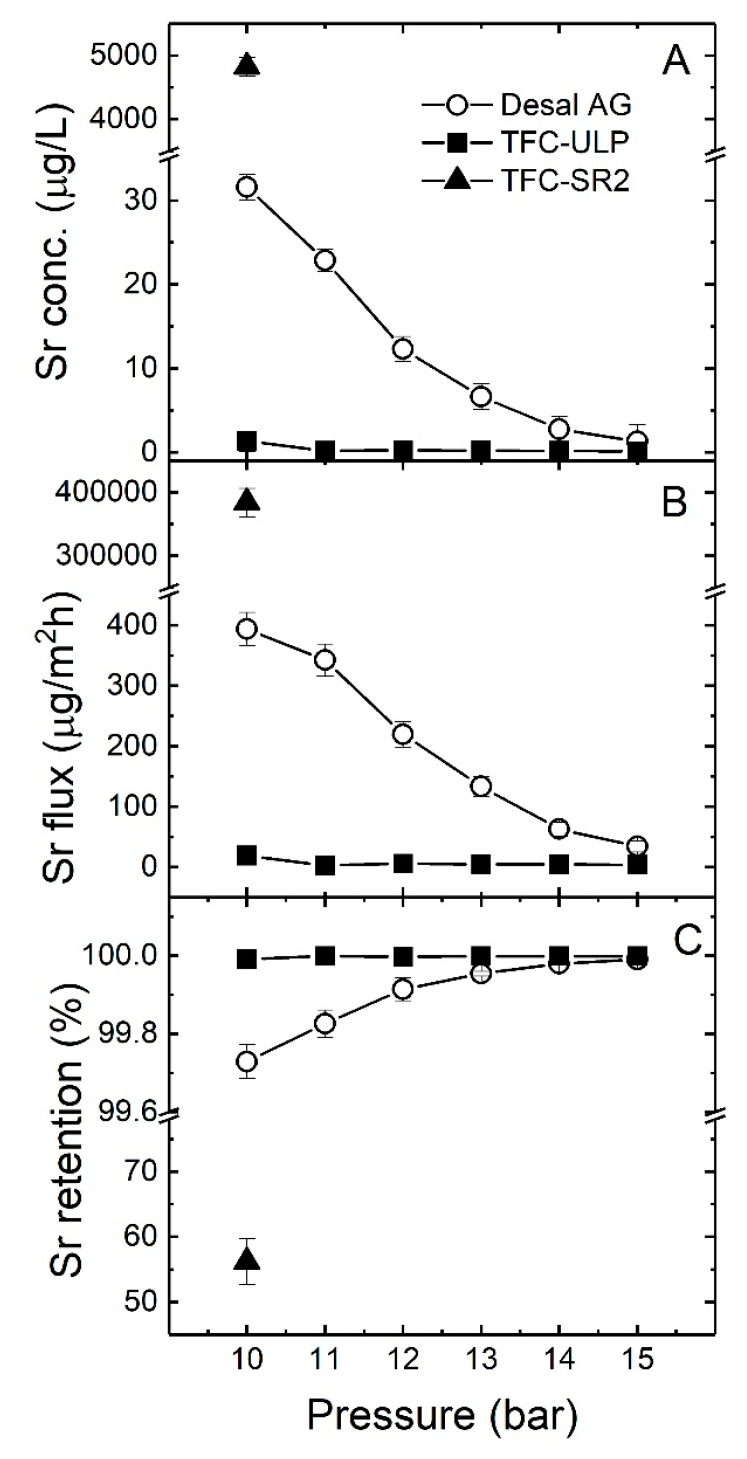
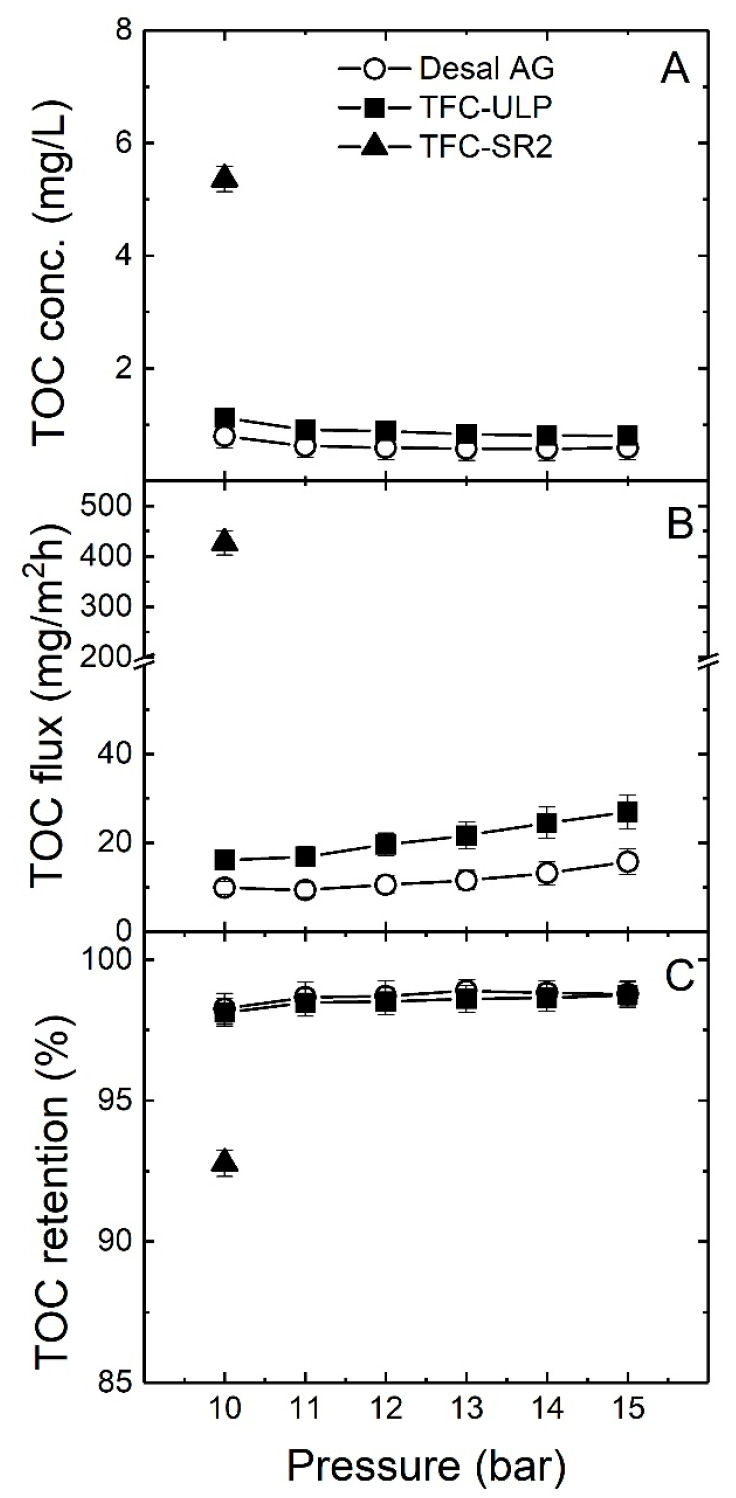
Removal of naturally occurring strontium (Sr) from groundwater is vital as excessive exposure may lead to bone growth problems in children. Nanofiltration/reverse osmosis (NF/RO) is commonly used in groundwater treatment due to the high effectiveness and simple maintenance of these pressure driven membrane processes. In this research, a pilot-scale NF/RO system was used to desalinate a natural groundwater sample containing high Sr concentration (10.3 mg/L) and “old” groundwater organic matter (70.9 mg/L) from Esilalei in northern Tanzania to understand the removal of strontium by NF/RO. The impact of applied pressure (10–15 bar) and groundwater pH (3–12) on the membrane performance including permeate flux, strontium and total organic carbon (TOC) flux and removal was investigated. Increasing applied pressure was found to enhance the flux by increasing the driving force and enhance Sr and TOC removal by dilution effect (water flux higher than Sr passage). The alkaline pH caused severe flux decline likely due to membrane fouling and scaling, while it slightly enhanced Sr removal of RO membranes, but weakened the TOC removal. In contrast, acidic and neutral pH of groundwater enhanced TOC removal. These findings suggest that appropriately high applied pressure and acidic pH condition of groundwater are recommended to apply to the NF/RO membrane system in groundwater desalination to achieve better membrane performance.
Overview
The claims and statistics of this paper haven’t been checked yet.
Run the check — free, no account needed. It reads the open-access text and checks the sources it cites.
Integrity signals
Registry
Cites
Statistics
Figures
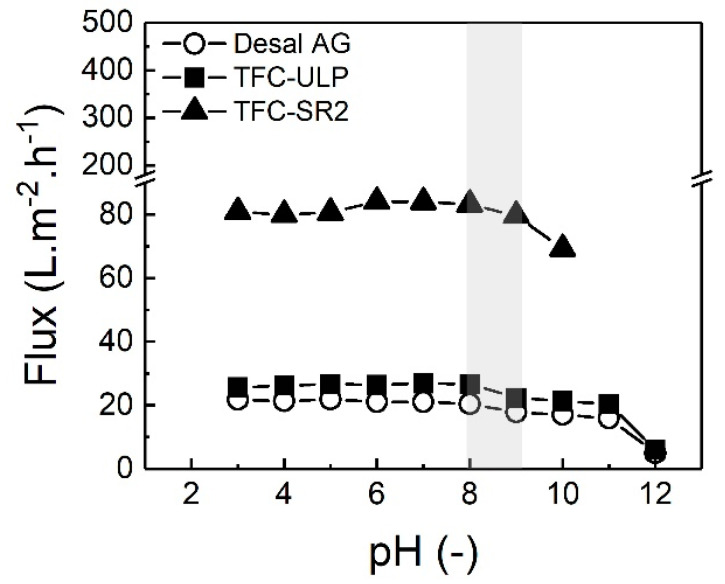
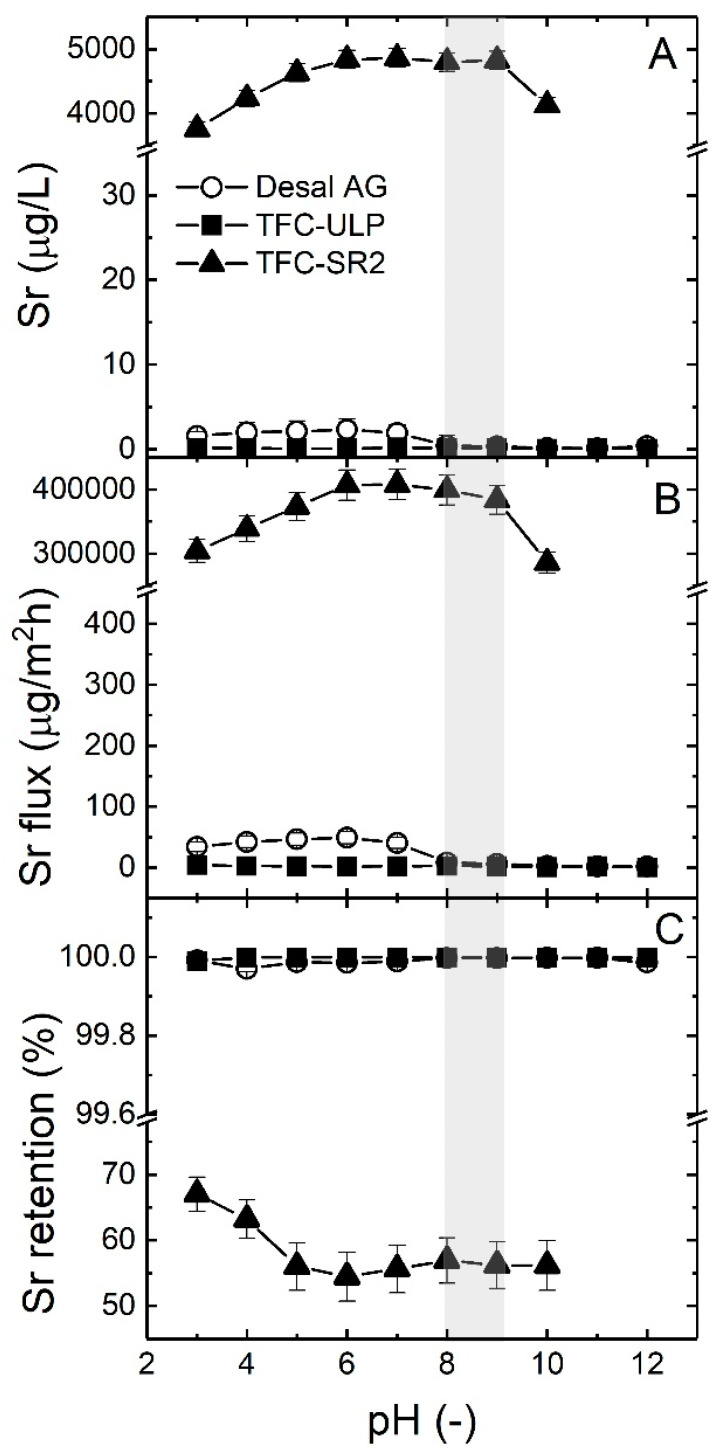
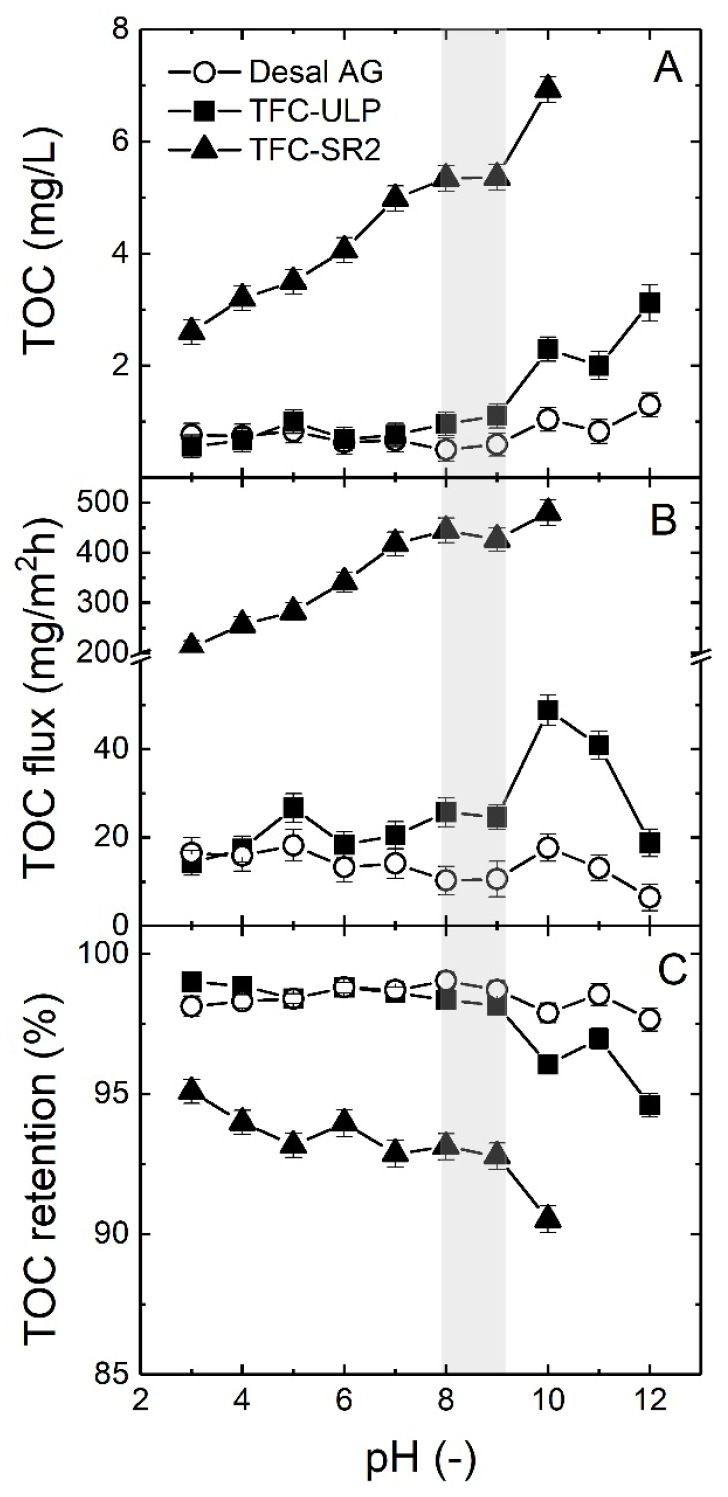
Verification
Claims the paper makes
The claims and statistics of this paper haven’t been checked yet.
Run the check — free, no account needed. It reads the open-access text and checks the sources it cites.
Claims other papers make about this one
Each is checked against this paper’s own text: does it say what the citing paper says it does?
The check wasn’t confident either way, so it gives no verdict — never disputed.
In the citing paper
“Significant progress has been achieved in many nanomembrane methods, including ultrafiltration, nanofiltration, and reverse osmosis.172,173”
From Emerging nanotechnology approaches for sustainable water treatment and heavy metals removal: a comprehensive review (2025) · cites this paper as [172]
Experimental — accuracy not yet measured
Self-check
Percentages, sums and reported differences re-computed from the paper’s own numbers.
The self-check needs the paper’s full text.
Citations
Cites
Peer Reviewed: Characterizing Aquatic Dissolved Organic Matter
Leenheer, J. A., & Croué, J. (2003) · Environmental Science & Technology · doi:10.1021/es032333c · Cited by 5,785 · cited 1×
“The factors influencing the characteristics of NOM include location, pH, water chemistry, temperature, and biological processes [19].”
BackgroundCharacterizing aquatic dissolved organic matter.
Leenheer, J. A., & Croué, J.-P. (2003) · PubMed · Cited by 4,891
Phenomenological Theory of Ion Solvation. Effective Radii of Hydrated Ions
Nightingale, E. R. (1959) · The Journal of Physical Chemistry · doi:10.1021/j150579a011 · Cited by 3,505
Basic Principles of Membrane Technology
Mulder, M. H. V. (1996) · Springer eBooks · doi:10.1007/978-94-009-1766-8 · Cited by 3,086
(1996) · Soil Science Society of America book series · doi:10.2136/sssabookser5.3 · Cited by 2,418
Metal Ion Binding by Humic Acid: Application of the NICA-Donnan Model
Kinniburgh, D. G., Milne, C. J., Benedetti, M. F., Pinheiro, J. P., Filius, J. D., Koopal, L. K., & van Riemsdijk, W. H. (1996) · Environmental Science & Technology · doi:10.1021/es950695h · Cited by 558 · cited 1×
“The dissolved organic matter (DOC) of humic acid from a non-ideal competitive adsorption model combined with the Donnan-type model (NICA-Donnan model) [22] in the software was used as NOM.”
MethodNatural organic matter-cations complexation and its impact on water treatment: A critical review
Adusei-Gyamfi, J., Ouddane, B., Rietveld, L. C., Cornard, J. P., & Criquet, J. (2019) · Water Research · doi:10.1016/j.watres.2019.05.064 · Cited by 410 · cited 1×
“pH may affect these interactions by changing the charge and structure of NOM [21,24].”
BackgroundDielectric exclusion of ions from membranes
Yaroshchuk, A. E. (2000) · Advances in Colloid and Interface Science · doi:10.1016/s0001-8686(99)00021-4 · Cited by 396 · cited 1×
“The interactions of ions with the bound electric charges induced by ion interfaces between different media dielectric constants cause the dielectric exclusion [48].”
BackgroundPark, Y., Lee, Y.-C., Shin, W. S., & Choi, S.-J. (2010) · Chemical Engineering Journal · doi:10.1016/j.cej.2010.06.026 · Cited by 389
Factors affecting natural organic matter (NOM) and scaling fouling in NF membranes: A review
Al-Amoudi, A. S. (2010) · Desalination · doi:10.1016/j.desal.2010.04.003 · Cited by 351 · cited 1×
“Divalent cations can form complexes with chelating micelles, polymers, and NOM [53], enhancing the Sr removal by more open membranes.”
BackgroundCheng, W., Liu, C., Tong, T., Epsztein, R., Sun, M., Verduzco, R., Ma, J., & Elimelech, M. (2018) · Journal of Membrane Science · doi:10.1016/j.memsci.2018.04.052 · Cited by 344
Mertz, J. L., Fard, Z. H., Malliakas, C. D., Manos, M. J., & Kanatzidis, M. G. (2013) · Chemistry of Materials · doi:10.1021/cm400699r · Cited by 320 · cited 1×
“In contrast, dense NF/RO membranes can remove the multivalent Sr2+ ions directly [31], while a robust pretreatment process (such as MF/UF) is probably required for the long-term use of NF/RO membranes depending on feed water quality.”
BackgroundNon-steric mechanisms of nanofiltration: superposition of Donnan and dielectric exclusion
Yaroshchuk, A. E. (2001) · Separation and Purification Technology · doi:10.1016/s1383-5866(00)00159-3 · Cited by 305 · cited 1×
“While the Donnan exclusion is caused by the electrostatic repulsion between the ions and membrane surface charge [49].”
BackgroundNanofiltration of Natural Organic Matter: pH and Ionic Strength Effects
Braghetta, A., DiGiano, F. A., & Ball, W. P. (1997) · Journal of Environmental Engineering · doi:10.1061/(asce)0733-9372(1997)123:7(628 · Cited by 256
Ion binding to natural organic matter: General considerations and the NICA–Donnan model
Koopal, L. K., Saito, T., Pinheiro, J. P., & van Riemsdijk, W. H. (2005) · Colloids and Surfaces A Physicochemical and Engineering Aspects · doi:10.1016/j.colsurfa.2004.11.050 · Cited by 250
Fouling effects on rejection in the membrane filtration of natural waters
Schäfer, A. I., Fane, A. G., & Waite, T. D. (2000) · Desalination · doi:10.1016/s0011-9164(00)90020-1 · Cited by 249 · cited 3×
“[61] found that most LMW acids could pass through NF membranes and cause their lower rejection.”
BackgroundInfluentialSelf-citationNanofiltration of natural organic matter: Removal, fouling and the influence of multivalent ions
Schäfer, A. I., Fane, A. G., & Waite, T. D. (1998) · Desalination · doi:10.1016/s0011-9164(98)00104-0 · Cited by 239 · cited 2×
“Calcium was found to bind with NOM such as humic acid, resulting in a complexation between humic acid and Ca with increasing pH value due to the enhanced negative charge of humic acid [25,26].”
BackgroundSelf-citationStrontium-Calcium Movement from Soil to Man
Comar, C. L., Russell, R. S., & Wasserman, R. H. (1957) · Science · doi:10.1126/science.126.3272.485 · Cited by 236 · cited 1×
“Strontium (Sr) has become a concern and research interest since radioactive Sr was produced and spread from nuclear weapons or nuclear plants, thus contaminating the environment and biosphere [1,2].”
BackgroundChegrouche, S., Mellah, A., & Barkat, M. (2008) · Desalination · doi:10.1016/j.desal.2008.01.018 · Cited by 234
Dialynas, E., Mantzavinos, D., & Diamadopoulos, E. (2008) · Water Research · doi:10.1016/j.watres.2008.08.008 · Cited by 225
Roy, Y., Warsinger, D. M., & Lienhard, J. H. (2017) · Desalination · doi:10.1016/j.desal.2017.07.020 · Cited by 224
Removal of organic contaminants by RO and NF membranes
YOON, Y., & Lueptow, R. M. (2005) · Journal of Membrane Science · doi:10.1016/j.memsci.2005.03.038 · Cited by 209 · cited 2×
“Yoon and Lueptow [73] determined that smaller LMW organic compounds had a lower rejection ( 10–20”
BackgroundRadioactive decontamination of water by membrane processes — A review
Rana, D. K., Matsuura, T., Kassim, M. A., & Ismail, A. F. (2012) · Desalination · doi:10.1016/j.desal.2012.11.007 · Cited by 198 · cited 2×
“[38] have reviewed these membrane technologies and summarized their advantages and limitations.”
BackgroundMembrane purification in radioactive waste management: a short review
Ambashta, R. D., & Sillanpää, M. E. T. (2011) · Journal of Environmental Radioactivity · doi:10.1016/j.jenvrad.2011.12.002 · Cited by 174 · cited 2×
“For instance, chemical precipitation and flocculation [27], ion exchange [28–31], adsorption [32–35], and membrane processes [36,37] have been developed to meet the guideline value of Sr disposal.”
BackgroundAdvances in membrane technologies for the treatment of liquid radioactive waste
Zakrzewska-Trznadel, G. (2013) · Desalination · doi:10.1016/j.desal.2013.02.022 · Cited by 172 · cited 1×
“Both laboratory and pilot experiments showed that MD is an effective method for Sr removal in radioactive wastewater, especially considering the availability of waste heat in nuclear power plants [42].”
BackgroundMembrane processes in nuclear technology-application for liquid radioactive waste treatment
Zakrzewska-Trznadel, G. (2001) · Separation and Purification Technology · doi:10.1016/s1383-5866(00)00167-2 · Cited by 136 · cited 1×
“Among these separation methods, membrane technology has been applied to treat radioactive wastewater (mainly radioactive heavy metal ions) in many nuclear plants around the world due to its high efficiency and relatively simple maintenance [38,39].”
BackgroundEffect of adsorbents and chemical treatments on the removal of strontium from aqueous solutions
Ahmadpour, A., Zabihi, M., Tahmasbi, M., & Bastami, T. R. (2010) · Journal of Hazardous Materials · doi:10.1016/j.jhazmat.2010.06.067 · Cited by 128
Listiarini, K., Sun, D. D., & Leckie, J. O. (2009) · Journal of Membrane Science · doi:10.1016/j.memsci.2009.01.037 · Cited by 125 · cited 1×
“Calcium was found to bind with NOM such as humic acid, resulting in a complexation between humic acid and Ca with increasing pH value due to the enhanced negative charge of humic acid [25,26].”
BackgroundECKELMANN, W. R., Kulp, J. L., & Schulert, A. R. (1958) · Science · doi:10.1126/science.127.3293.266 · Cited by 121
Mouhoumed, E. I., Szymczyk, A., Schäfer, A. I., Paugam, L., & La, Y. (2014) · Journal of Membrane Science · doi:10.1016/j.memsci.2014.03.025 · Cited by 121 · cited 2×
“The membranes’ support layers consist of a polysulfone midlayer and polyester web support [57].”
BackgroundSelf-citationCompetitive adsorption of strontium and cobalt onto tin antimonate
Zhang, L., Wei, J., Zhao, X., Li, F., Jiang, F., Zhang, M., & Cheng, X. (2015) · Chemical Engineering Journal · doi:10.1016/j.cej.2015.10.013 · Cited by 108
Strontium and barium in sea water and marine organisms
Bowen, H. J. M. (1956) · Journal of the Marine Biological Association of the United Kingdom · doi:10.1017/s0025315400010298 · Cited by 104
Zeta potential of commercial RO membranes: influence of source water type and chemistry
Deshmukh, S., & Childress, A. E. (2001) · Desalination · doi:10.1016/s0011-9164(01)00357-5 · Cited by 101 · cited 1×
“the IEP point, as shown in Table 2) and negatively charged with increasing pH [59,60], while the charge of Desal AG-2540 as a function of pH is not available.”
BackgroundPermeability of low molecular weight organics through nanofiltration membranes
Meylan, S., Hammes, F., TRABER, J., Salhi, E., VONGUNTEN, U., & Pronk, W. (2007) · Water Research · doi:10.1016/j.watres.2007.05.031 · Cited by 91 · cited 2×
“This result can be attributed to the fact that the organic matter concentration at the membrane surface may enhance the diffusion of organic matter, preferentially LMW compounds [74,76].”
BackgroundSchäfer, A. I., Pihlajamäki, A., Fane, A. G., Waite, T. D., & Nyström, M. (2004) · Journal of Membrane Science · doi:10.1016/j.memsci.2004.05.018 · Cited by 89 · cited 2×
“This result can be attributed to the fact that the organic matter concentration at the membrane surface may enhance the diffusion of organic matter, preferentially LMW compounds [74,76].”
BackgroundSelf-citationShen, J., Richards, B. S., & Schäfer, A. I. (2016) · Separation and Purification Technology · doi:10.1016/j.seppur.2016.06.042 · Cited by 83 · cited 2×
“The testing location was in Tanzania, which was typically 22 to 29 ◦C [64].”
BackgroundResultSelf-citationSkoryna, S. C. (1981) · Springer eBooks · doi:10.1007/978-1-4684-3698-3 · Cited by 82 · cited 3×
“Natural Sr is not radioactive and there are four stable isotopes 88Sr (mainly), 87Sr, 86Sr, and 84Sr [3].”
BackgroundOwusu-Agyeman, I., Reinwald, M., Jeihanipour, A., & Schäfer, A. I. (2018) · Chemosphere · doi:10.1016/j.chemosphere.2018.10.135 · Cited by 81 · cited 3×
“At high pH, the surface charge of the TFC NF/RO membrane became more negatively charged, and most NOM may become more negative, which would result in high TOC removal due to enhanced charge exclusion [24,71].”
BackgroundMethodSelf-citationRemoval of arsenic(V) by nanofiltration: Impact of water salinity, pH and organic matter
Boussouga, Y., Frey, H., & Schäfer, A. I. (2020) · Journal of Membrane Science · doi:10.1016/j.memsci.2020.118631 · Cited by 75 · cited 1×
“This can be calculated by the relationship between relative error and measured concentration based on the calibration of ICP-MS and TOC analyzer [67].”
MethodSelf-citationDing, S., Yang, Y., Haiou, H., Liu, H., & Hou, L.-A. (2015) · Journal of Hazardous Materials · doi:10.1016/j.jhazmat.2015.03.056 · Cited by 66 · cited 3×
“When the membrane surface becomes positive at an acidic pH (below the isoelectric point (IEP) of the membrane), Donnan exclusion will be enhanced, so the retention of Sr is increased [45].”
BackgroundMishra, S. P., & Tiwary, D. (1999) · Applied Radiation and Isotopes · doi:10.1016/s0969-8043(99)00065-2 · Cited by 65
Occurrence and distribution of strontium in natural water
Skougstad, M. W., & Horr, C. A. (1963) · doi:10.3133/wsp1496d · Cited by 61
Karimi, L., Abkar, L., Aghajani, M., & Ghassemi, A. (2015) · Separation and Purification Technology · doi:10.1016/j.seppur.2015.07.023 · Cited by 61 · cited 1×
“However, when the solution’s salinity is high (≥ about 3500 mg/L), ED showed a reduced efficiency [41].”
BackgroundHwang, E.-D., Lee, K., Choo, K., Choi, S.-J., Kim, S.-H., Yoon, C.-H., & Lee, C. (2002) · Desalination · doi:10.1016/s0011-9164(02)00554-4 · Cited by 56
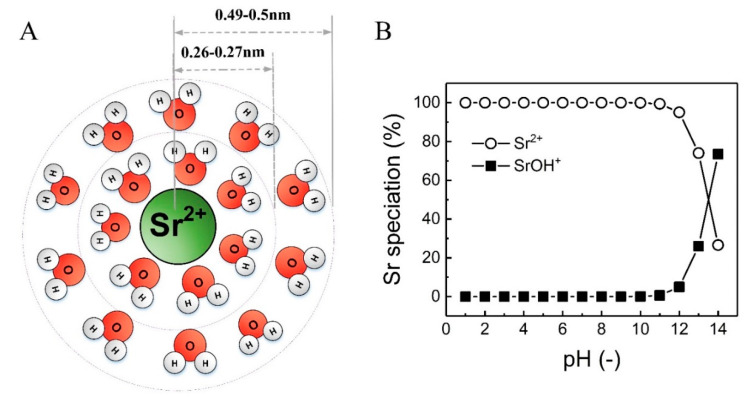
Sr(II) in Water: A Labile Hydrate with a Highly Mobile Structure
Hofer, T. S., Randolf, B. R., & Rode, B. M. (2006) · The Journal of Physical Chemistry B · doi:10.1021/jp0638033 · Cited by 54
Munari, A. D., Semião, A. J. C., & Antízar-Ladislao, B. (2013) · Water Research · doi:10.1016/j.watres.2013.03.055 · Cited by 52 · cited 2×
“This result may be due to the fact that the membrane surface, which is assumed to be negatively charged, attracted more Sr2+ ions with an increase in pH [59].”
BackgroundEnhanced removal of dissolved metal ions in radioactive effluents by flocculation
Rout, T. K., Sengupta, D. K., Kaur, G., & Kumar, S. (2006) · International Journal of Mineral Processing · doi:10.1016/j.minpro.2006.04.006 · Cited by 43 · cited 1×
“For instance, chemical precipitation and flocculation [27], ion exchange [28–31], adsorption [32–35], and membrane processes [36,37] have been developed to meet the guideline value of Sr disposal.”
BackgroundSelective Strontium Removal from a Sodium Nitrate Aqueous Medium by Nanofiltration - Complexation
Gaubert, E., Barnier, H., Maurel, A., Foos, J., Guy, A., Bardot, C., & Lemaire, M. (1997) · Separation Science and Technology · doi:10.1080/01496399708003217 · Cited by 40 · cited 1×
“) have been reported to also play an important role in Sr retention [45,50,51].”
BackgroundWadekar, S. S., & Vidić, R. D. (2018) · Journal of Membrane Science · doi:10.1016/j.memsci.2018.07.060 · Cited by 38 · cited 3×
“Wadekar and Vidic [46] reported that Sr retention by NF decreased with the increase in pH (due to enhanced charge attraction) and that surface charge effects were the most dominant determining factors.”
BackgroundInfluentialPhenol removal from water by AG reverse osmosis membrane
Mnif, A., Tabassi, D., Ali, M. B. S., & Hamrouni, B. (2015) · Environmental Progress & Sustainable Energy · doi:10.1002/ep.12078 · Cited by 37 · cited 1×
“The active layer of Desal-AG and TFC-ULP are made of a full aromatic polyamide, while TFC-SR2 is made of semi-aromatic polyamide [57,58].”
BackgroundJeihanipour, A., Shen, J., Abbt‐Braun, G., Huber, S. A., Mkongo, G., & Schäfer, A. I. (2018) · The Science of The Total Environment · doi:10.1016/j.scitotenv.2018.05.113 · Cited by 36 · cited 1×
“Such permeation of organic compounds can be the source of significant regrowth in the permeate if the concentration of LMW organics in source waters are high, as has been observed in studies using some of the tropical blackwaters in Tanzania [72,75].”
ResultSelf-citationCao, J., Gu, P. D., Zhao, J., Zhang, D., & Deng, Y. (2010) · Journal of Radioanalytical and Nuclear Chemistry · doi:10.1007/s10967-010-0564-y · Cited by 32 · cited 2×
“Furthermore, the additives may pass through the membranes into the permeate [36,43,44].”
BackgroundMethodKulp, J. L., Schulert, A. R., & Hodges, E. J. (1960) · Science · doi:10.1126/science.132.3425.448 · Cited by 31
Ion exchangers in radioactive waste management
Mishra, S. P., & Srinivasu, N. (1992) · Journal of Radioanalytical and Nuclear Chemistry · doi:10.1007/bf02035391 · Cited by 30
Schäfer, A. I., & Fane, A. G. (2021) · Wiley eBooks · doi:10.1002/9783527824984 · Cited by 29
Self-citationSelective separation of contaminants from paper mill effluent using nanofiltration
Negaresh, E., Antony, A., Bassandeh, M., Richardson, D., & Leslie, G. L. (2011) · Process Safety and Environmental Protection · doi:10.1016/j.cherd.2011.08.005 · Cited by 28
Renewable energy-powered membrane technology in Tanzanian communities
Schäfer, A. I., Shen, J., & Richards, B. S. (2018) · npj Clean Water · doi:10.1038/s41545-018-0026-6 · Cited by 26 · cited 3×
“This result is likely due to the ancient nature of the groundwater in the region and a lot of the organic matter has been degraded in the aquifer with time and may not be replenished in this region [72].”
BackgroundResultSelf-citationShen, J., Jeihanipour, A., Richards, B. S., & Schäfer, A. I. (2019) · Separation and Purification Technology · doi:10.1016/j.seppur.2019.03.004 · Cited by 24 · cited 2×
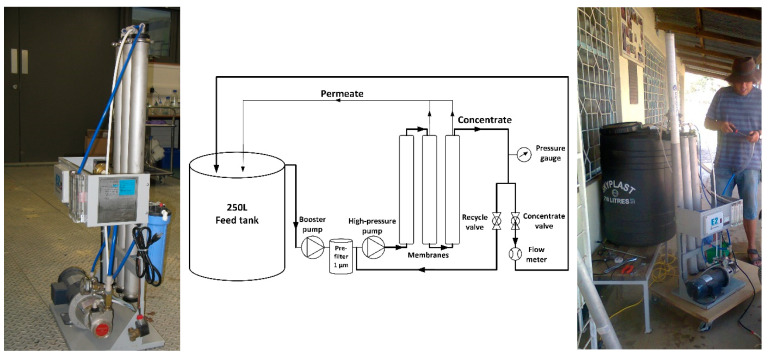
“This configuration was specifically chosen, as it can improve the system’s recovery as much as possible, and it is a typical set-up in brackish water desalination even though the last module may perform poorly [56].”
BackgroundSelf-citationRemoval of strontium from simulated low-level radioactive wastewater by nanofiltration
Chen, L., Bian, X., & Lu, X. (2018) · Water Science & Technology · doi:10.2166/wst.2018.455 · Cited by 17 · cited 2×
“[52] found that Sr retention by NF was more affected by pH and complexation while it was less influenced by the initial Sr concentration.”
BackgroundMethodAssessment of the Alkaline Earth Metals (Ca, Sr, Ba) and Their Associated Health Impacts
Pathak, P., Srivastava, R. R., Keçeli, G., & Mishra, S. (2019) · The handbook of environmental chemistry · doi:10.1007/978-3-030-15314-4_12 · Cited by 17
A model of estimating scaling potential in reverse osmosis and nanofiltration systems
Huang, Q., & Ma, W. (2012) · Desalination · doi:10.1016/j.desal.2011.12.007 · Cited by 15 · cited 2×
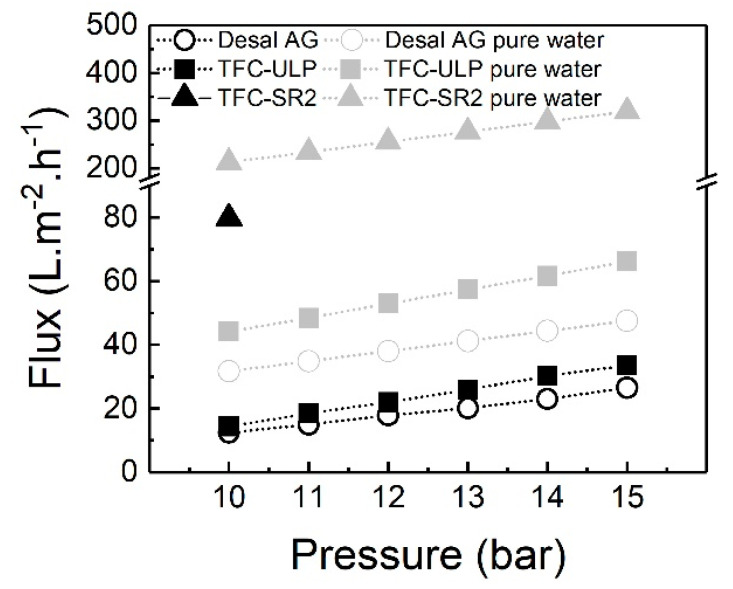
“This result is consistent with the findings of Bergman [68], where the salt permeate concentration decreased with an increase in applied pressure.”
BackgroundResultMagnitude of Biological Hazard from Strontium-90
Newcombe, H. B. (1957) · Science · doi:10.1126/science.126.3273.549 · Cited by 15
Gasser, M. S., & Nowier, H. G. (2003) · Journal of Chemical Technology & Biotechnology · doi:10.1002/jctb.914 · Cited by 12
Micellar enhanced microfiltration of strontium
Rajec, P., & Paulenová, A. (1994) · Journal of Radioanalytical and Nuclear Chemistry · doi:10.1007/bf02043122 · Cited by 9 · cited 1×
“Furthermore, the additives may pass through the membranes into the permeate [36,43,44].”
BackgroundGLOBAL DISTRIBUTION OF STRONTIUM-90 FROM NUCLEAR DETONATIONS
Eisenbud, M. (1957) · The Scientific monthly/Scientific monthly · Cited by 3
Membrane-based separation technologies for cesium, strontium, and technetium
Kafka, T. (1996) · OSTI OAI (U.S. Department of Energy Office of Scientific and Technical Information) · Cited by 2
Research works printed but not linked: 7
- U.S. Environmental Protection Agency (2012). 2012 Edition of the Drinking Water Standards and Health Advisories.
- Sillanpää, M. (2015). Natural Organic Matter in Water, Elsevier.
- Clearfield, A., and Yates, S. (1995, January 24−26). Inorganic Ion Exchange for Cesium and Strontium. Proceedings of the Efficient Separations and Processing Cross-Cutting Program Annual Technical Exchange Meeting, Gaithersburg, MD, USA.
- Zahakifar, F., Keshtkar, A.R., Shirani, A.S., and Zaheri, A. (2014, January 27). Removal of strontium from aqueous solutions using electrodialysis (ED). Proceedings of the The 8th International Chemical Engineering Congress & Exhibition (IChEC), Kish, Iran.
- Garrett, L. (1990, January 15−17). Reverse osmosis application to low-level radioactive waste. Proceedings of the 1990 Annual Membrane Technology/Planning Conference and High-Tech Separations Symposium, Newton, MA, USA.
- Bevington, P.R., and Robinson, D.K. (2003). Data Reduction and Error Analysis for the Physical Sciences, McGraw-Hill.
- Shen, J. (2014). Application of Membrane Filtration in Removing Radioactive Contaminant Strontium. [Master‘s Thesis, Beijing University of Chemical Technology].
Cited by
Sorted by citations
Technological trends in heavy metals removal from industrial wastewater: a review
Shrestha, R., Ban, S., Devkota, S., Sharma, S., Joshi, R., Tiwari, A. P., Kim, H. Y., & Joshi, M. K. (2021) · Journal of Environmental Chemical Engineering · doi:10.1016/j.jece.2021.105688 · Cited by 961
Abidli, A., Huang, Y., Ben Rejeb, Z., Zaoui, A., & Park, C. B. (2022) · Chemosphere · doi:10.1016/j.chemosphere.2021.133102 · Cited by 194
Progress in Research and Application of Nanofiltration (NF) Technology for Brackish Water Treatment
Tian, J., Zhao, X., Gao, S., Wang, X., & Zhang, R. (2021) · Membranes · doi:10.3390/membranes11090662 · Cited by 84
Advanced Polymeric Nanocomposites for Water Treatment Applications: A Holistic Perspective
Adeola, A. O., & Nomngongo, P. N. (2022) · Polymers · doi:10.3390/polym14122462 · Cited by 81
Hussein, E. B., Rasheed, F. A., Mohammed, A. S., & Kayani, K. F. (2025) · RSC Advances · doi:10.1039/d5ra06914a · Cited by 86
“172,173”
Metadata
- Authors
- Cai, Y.-H., Yang, X. J., & Schäfer, A. I.
- Affiliations
- Karlsruhe Institute of Technology (DE)
- Beijing University of Chemical Technology (CN)
- Corresponding author
- Schäfer, Andrea Iris
- Venue
- Membranes
- Publisher
- MDPI AG
- Published
- 2020-10-30
- Volume
- 10
- Issue
- 11
- Pages
- 321
- ISSN
- 2077-0375 (ISSN-L)
- PMC
- PMC7693364
- OpenAlex
- W3097766034
- Cited by
- 47
- References
- 67
- Citations by year
- 2026: 6 · 2025: 8 · 2024: 8 · 2023: 6 · 2022: 8 · 2021: 11
- FWCI
- 1.92
- Type
- journal article
- Language
- en
- Open access
- gold
- doi.org
- Licence
- Locations
- Membranes (publishedVersion, cc-by)
- PubMed Central (publishedVersion, cc-by)
- PubMed (publishedVersion)
- Repository KITopen (Karlsruhe Institute of Technology) (submittedVersion, cc-by)
- DOAJ (DOAJ: Directory of Open Access Journals) (submittedVersion, cc-by-sa)
- KITopen (cc-by)
- Funders
- Leverhulme Trust
- China Scholarship Council
- Université de Genève
- Beijing University of Chemical Technology
- Topics
- Physical Sciences › Environmental Science › Water Science and Technology › Membrane Separation Technologies
- Physical Sciences › Chemical Engineering › Filtration and Separation › Membrane-based Ion Separation Techniques
- Physical Sciences › Environmental Science › Waste Management and Disposal › Wastewater Treatment and Reuse
- Keywords
- strontium removal, nanofiltration, reverse osmosis, groundwater treatment, groundwater desalination, total organic carbon removal, membrane fouling, scaling, applied pressure, groundwater pH, permeate flux
About these checks
Registry, retraction, Cites and statistics results are computed, not judged, with one exception: a printed reference that no index lists is read once by a model before it counts as a citation error. Claims are extracted by a model and kept only when their quote appears verbatim in the text; each cited source is then checked, with a model’s help, for whether it says what the claim relies on. Those verdicts can be wrong — read the claim’s quote and the cited source before relying on one.
Statistics and arithmetic are recomputed, not judged.
Confidence bands are shown only for fields calibrated on our annotated test set. None is calibrated yet, so no band is shown.
What counts as a claim ›How we measure confidence ›How we check this ›
Are you an author, or do you see a problem with this page? Request a review
