

Online Surface Defect Identification of Cold Rolled Strips Based on Local Binary Pattern and Extreme Learning Machine
Open accessThe DOI matches its Crossref record; 17 of the 17 references it cites were found in a registry or an index.
Abstract
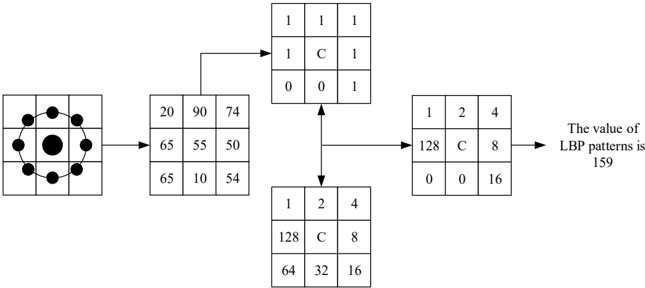
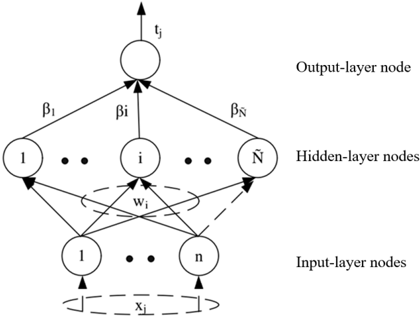
In the production of cold-rolled strip, the strip surface may suffer from various defects which need to be detected and identified using an online inspection system. The system is equipped with high-speed and high-resolution cameras to acquire images from the moving strip surface. Features are then extracted from the images and are used as inputs of a pre-trained classifier to identify the type of defect. New types of defect often appear in production. At this point the pre-trained classifier needs to be quickly retrained and deployed in seconds to meet the requirement of the online identification of all defects in the environment of a continuous production line. Therefore, the method for extracting the image features and the training for the classification model should be automated and fast enough, normally within seconds. This paper presents our findings in investigating the computational and classification performance of various feature extraction methods and classification models for the strip surface defect identification. The methods include Scale Invariant Feature Transform (SIFT), Speeded Up Robust Features (SURF) and Local Binary Patterns (LBP). The classifiers we have assessed include Back Propagation (BP) neural network, Support Vector Machine (SVM) and Extreme Learning Machine (ELM). By comparing various combinations of different feature extraction and classification methods, our experiments show that the hybrid method of LBP for feature extraction and ELM for defect classification results in less training and identification time with higher classification accuracy, which satisfied online real-time identification.
Overview
The claims and statistics of this paper haven’t been checked yet.
Free: it reads the open-access text and checks the first 5 claims that cite a source we can check. Create a free account to check every claim.
Integrity signals
Registry
Cites
Statistics
Figures









Verification
Claims the paper makes
The claims and statistics of this paper haven’t been checked yet.
Free: it reads the open-access text and checks the first 5 claims that cite a source we can check. Create a free account to check every claim.
Claims other papers make about this one
Each is checked against this paper’s own text: does it say what the citing paper says it does?
The source backs part of the claim, not all of it — or backs it for a different population, condition or comparison.
In the citing paper
“Be of rotation and gray invariance, fast calculation speed.”
From Automated Visual Defect Classification for Flat Steel Surface: A Survey (2020) · cites this paper as [86]
Experimental — accuracy not yet measuredThe check wasn’t confident either way, so it gives no verdict — never disputed.
In the citing paper
“Sensitive to scale variation and noise interference.”
From Automated Visual Defect Classification for Flat Steel Surface: A Survey (2020) · cites this paper as [86]
Experimental — accuracy not yet measured
Self-check
Percentages, sums and reported differences re-computed from the paper’s own numbers.
The self-check needs the paper’s full text.
Citations
Cites
Speeded-Up Robust Features (SURF)
Bay, H., Ess, A., Tuytelaars, T., & Van Gool, L. (2008) · Computer Vision and Image Understanding · doi:10.1016/j.cviu.2007.09.014 · Cited by 13,557
Extreme learning machine: Theory and applications
Huang, G.-B., Zhu, Q.-Y., & Siew, C.-K. (2006) · Neurocomputing · doi:10.1016/j.neucom.2005.12.126 · Cited by 13,285
A comparative study of texture measures with classification based on featured distributions
Ojala, T., Pietikäinen, M., & Harwood, D. (1996) · Pattern Recognition · doi:10.1016/0031-3203(95)00067-4 · Cited by 6,882
Extreme learning machine: a new learning scheme of feedforward neural networks
Huang, G.-B., Zhu, Q.-Y., & Siew, C.-K. (2005) · 2004 IEEE International Joint Conference on Neural Networks (IEEE Cat. No.04CH37541) · doi:10.1109/ijcnn.2004.1380068 · Cited by 4,084
Unsupervised Deep Feature Extraction for Remote Sensing Image Classification
Romero, A., Gatta, C., & Camps-Valls, G. (2016) · IEEE Transactions on Geoscience and Remote Sensing · doi:10.1109/tgrs.2015.2478379 · Cited by 729
Image Texture Feature Extraction Using GLCM Approach
Mohanaiah, P., Sathyanarayana, P., & GuruKumar, L. (2013) · Cited by 646
Theory of the backpropagation neural network
Hecht-Nielsen, R. (1988) · Neural Networks · doi:10.1016/0893-6080(88)90469-8 · Cited by 472
Learning local binary patterns for gender classification on real-world face images
Shan, C. (2012) · Pattern Recognition Letters · doi:10.1016/j.patrec.2011.05.016 · Cited by 350
Exploiting local features from deep networks for image retrieval
Ng, J. Y.-H., Yang, F., & Davis, L. S. (2015) · 2015 IEEE Conference on Computer Vision and Pattern Recognition Workshops (CVPRW) · doi:10.1109/cvprw.2015.7301272 · Cited by 344
Survey on LBP based texture descriptors for image classification
Nanni, L., Lumini, A., & Brahnam, S. (2012) · Expert Systems with Applications · doi:10.1016/j.eswa.2011.09.054 · Cited by 260
Hu, J., Li, D., Duan, Q., Han, Y., Chen, G., & Si, X. (2012) · Computers and Electronics in Agriculture · doi:10.1016/j.compag.2012.07.008 · Cited by 254
Food image recognition with deep convolutional features
Kawano, Y., & Yanai, K. (2014) · Proceedings of the 2014 ACM International Joint Conference on Pervasive and Ubiquitous Computing: Adjunct Publication · doi:10.1145/2638728.2641339 · Cited by 209
GA-SIFT: A new scale invariant feature transform for multispectral image using geometric algebra
Li, Y., Liu, W., Xiao-tang, L., Huang, Q., & Li, X. (2014) · Information Sciences · doi:10.1016/j.ins.2013.12.022 · Cited by 83
Efficient and effective algorithms for training single-hidden-layer neural networks
Yu, D., & Deng, L. (2011) · Pattern Recognition Letters · doi:10.1016/j.patrec.2011.12.002 · Cited by 67
Application of Shearlet transform to classification of surface defects for metals
Xu, K., Liu, S., & Ai, Y. (2015) · Image and Vision Computing · doi:10.1016/j.imavis.2015.01.001 · Cited by 55
Self-citationAn improved LBP algorithm for avatar face recognition
Mohamed, A. A., & Yampolskiy, R. V. (2011) · doi:10.1109/icat.2011.6102124 · Cited by 27
Support Vector Machine Regression Algorithm Based on Chunking Incremental Learning
Jingqing, J., Chuyi, S., Chun-guo, W., Marchese, M., & Yangchun, L. (2006) · Lecture notes in computer science · doi:10.1007/11758501_74 · Cited by 9
Research works printed but not linked: 1
- 6. Bheda, D.; Joshi, M.; Agrawal, V. A study on features extraction techniques for image mosaicing. Int. J. Innov. Res. Comput. Commun. Eng. 2014, 2, 3432-3437.
Cited by
Automated Visual Defect Detection for Flat Steel Surface: A Survey
Luo, Q., Fang, X., Liu, L., Yang, C., & Sun, Y. (2020) · IEEE Transactions on Instrumentation and Measurement · doi:10.1109/tim.2019.2963555 · Cited by 559
Wang, S., Xia, X., Ye, L., & Yang, B. (2021) · Metals · doi:10.3390/met11030388 · Cited by 184
Automated Visual Defect Classification for Flat Steel Surface: A Survey
Luo, Q., Fang, X., Su, J., Zhou, J., Zhou, B., Yang, C., Liu, L., Gui, W., & Tian, L. (2020) · IEEE Transactions on Instrumentation and Measurement · doi:10.1109/tim.2020.3030167 · Cited by 148
Surface defect detection of steel strips based on classification priority YOLOv3-dense network
Zhang, J., Kang, X., Ni, H., & Ren, F. (2020) · Ironmaking & Steelmaking Processes Products and Applications · doi:10.1080/03019233.2020.1816806 · Cited by 106
Road Surface Defect Detection—From Image-Based to Non-Image-Based: A Survey
Yu, J., Jiang, J., Fichera, S., Paoletti, P., Layzell, L., Mehta, D., & Luo, S. (2024) · IEEE Transactions on Intelligent Transportation Systems · doi:10.1109/tits.2024.3382837 · Cited by 110
Metadata
- Authors
- Liu, Y., Xu, K., & Wang, D.
- Affiliations
- University of Science and Technology Beijing (CN)
- Commonwealth Scientific and Industrial Research Organisation (AU)
- Corresponding author
- Xu, Ke
- Venue
- Metals
- Publisher
- MDPI AG
- Published
- 2018-03-20
- Volume
- 8
- Issue
- 3
- Pages
- 197
- ISSN
- 2075-4701 (ISSN-L)
- OpenAlex
- W2793624836
- Semantic Scholar
- 98fa2f0f31f9a2509b7503149756abc8eb697271
- Cited by
- 39
- References
- 17
- Citations by year
- 2026: 5 · 2025: 4 · 2024: 7 · 2023: 4 · 2022: 9 · 2021: 2 · 2020: 5 · 2019: 2 · 2018: 1
- FWCI
- 2.07
- Type
- journal article
- Language
- en
- Open access
- gold
- doi.org
- Licence
- Locations
- Metals (publishedVersion, cc-by)
- DOAJ (DOAJ: Directory of Open Access Journals) (submittedVersion, cc-by-sa)
- Funders
- National Natural Science Foundation of China (51674031)
- Topics
- Physical Sciences › Engineering › Industrial and Manufacturing Engineering › Industrial Vision Systems and Defect Detection
- Physical Sciences › Engineering › Mechanical Engineering › Non-Destructive Testing Techniques
- Physical Sciences › Computer Science › Computer Vision and Pattern Recognition › Image Retrieval and Classification Techniques
- Keywords
- cold-rolled strip, online defect detection, local binary pattern, extreme learning machine, feature extraction, SIFT, SURF, real-time classification, continuous production line
About these checks
Registry, retraction, Cites and statistics results are computed, not judged, with one exception: a printed reference that no index lists is read once by a model before it counts as a citation error. Claims are extracted by a model and kept only when their quote appears verbatim in the text; each cited source is then checked, with a model’s help, for whether it says what the claim relies on. Those verdicts can be wrong — read the claim’s quote and the cited source before relying on one.
Statistics and arithmetic are recomputed, not judged.
Confidence bands are shown only for fields calibrated on our annotated test set. None is calibrated yet, so no band is shown.
What counts as a claim ›How we measure confidence ›How we check this ›
Are you an author, or do you see a problem with this page? Request a review
Data sources
Bibliographic data: Semantic Scholar, OpenAlex, Crossref.
Contains information from the Semantic Scholar Academic Graph Datasets, made available under the ODC Attribution License (ODC-BY 1.0).
Semantic Scholar’s data is described in: Kinney, R., et al. (2023). The Semantic Scholar Open Data Platform. arXiv:2301.10140.
