

The DOI matches its Crossref record; 39 of the 39 references it cites were found in a registry or an index.
Effects of pH and Osmotic Changes on the Metabolic Expressions of Bacillus subtilis Strain 168 in Metabolite Pathways including Leucine Metabolism
Open accessAbstract
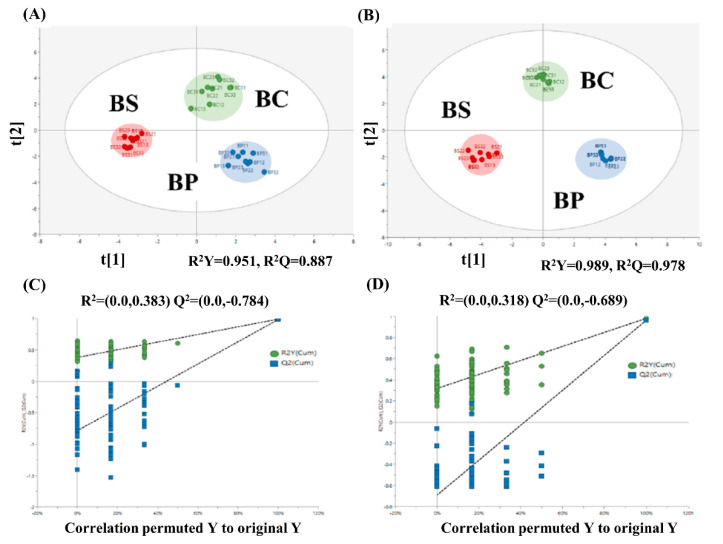
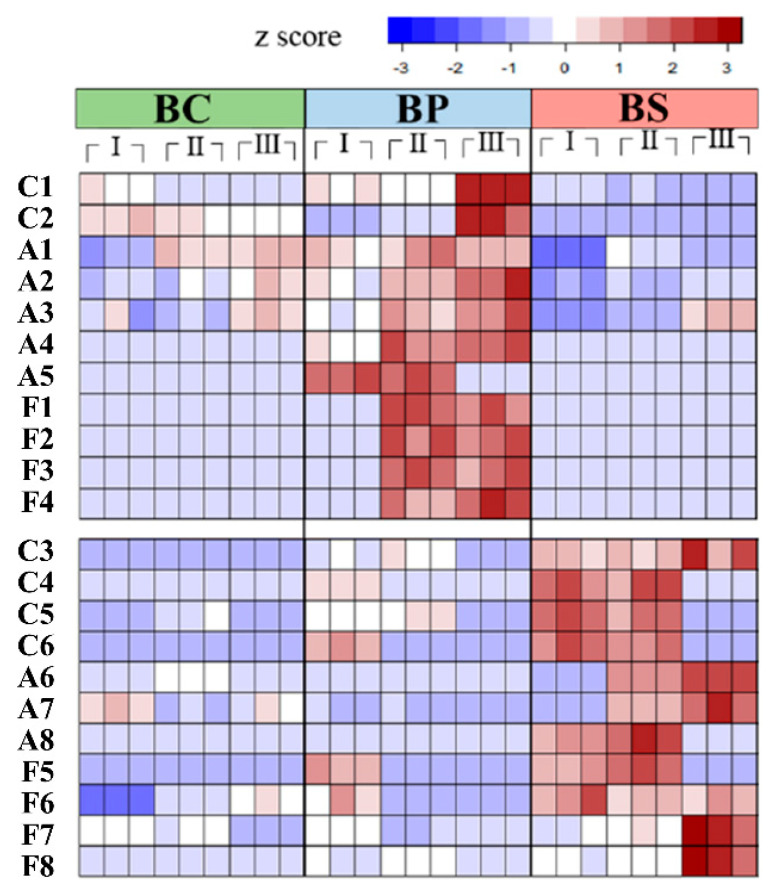
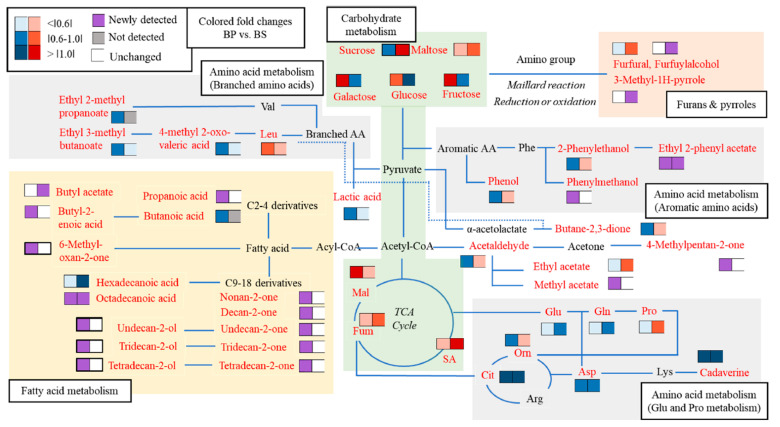
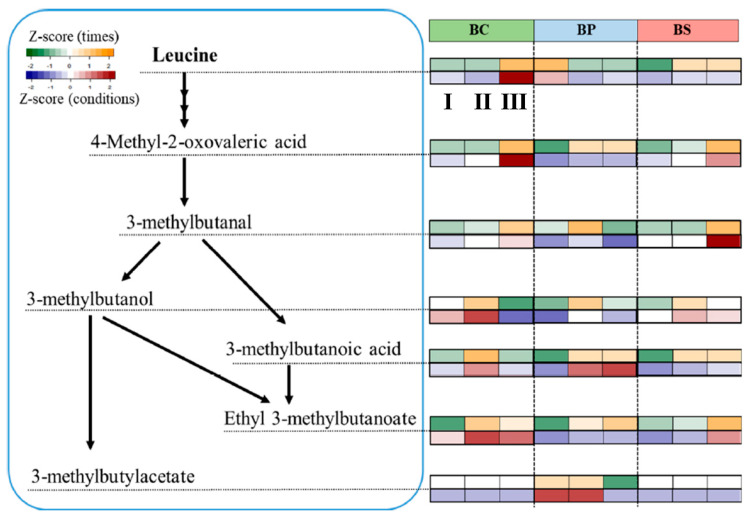
Bacillus subtilis is often exposed to diverse culture conditions with the aim of improving hygiene or food quality. This can lead to changes in the volatile metabolite profiles related to the quality of fermented foods. To comprehensively interpret the associated metabolic expressions, changes in intracellular primary and extracellular secondary volatile metabolites were investigated by exposing B. subtilis to an alkaline pH (BP, pH 8.0) and a high salt concentration (BS, 1 M). In particular, B. subtilis was cultured in a leucine-enriched medium to investigate the formation of leucine-derived volatile metabolites. This study observed metabolic changes in several metabolic pathways, including carbohydrate metabolism, amino acid metabolism, fatty acid metabolism, and leucine degradation. The formation of proline (an osmolyte), furans, pyrrole, and monosaccharide sugars (glucose, galactose, and fructose) was enhanced in BS, whereas fatty acid derivatives (ketones and alcohols) increased in BP. In the case of leucine degradation, 3-methyl-butanal and 3-methylbutanol could be salt-specific metabolites, while the contents of 3-methylbutanoic acid and 3-methylbutylacetate increased in BP. These results show culture condition-specific metabolic changes, especially secondary volatile metabolites related to the sensory property of foods, in B. subtilis.
Overview
The claims and statistics of this paper haven’t been checked yet.
Run the check — free, no account needed. It reads the open-access text and checks the sources it cites.
Integrity signals
Registry
Cites
Statistics
Figures
Verification
Claims the paper makes
The claims and statistics of this paper haven’t been checked yet.
Run the check — free, no account needed. It reads the open-access text and checks the sources it cites.
Claims other papers make about this one
Each is checked against this paper’s own text: does it say what the citing paper says it does?
The check wasn’t confident either way, so it gives no verdict — never disputed.
In the citing paper
“Acidic pH may result in rigid and ordered membranes, which can affect th e membrane dynamics of the bacterium [48] .”
From Optimization of Bacillus subtilis PW12 biomass production using RSM: a preliminary study towards single-cell protein production for aquaculture (2024) · cites this paper as [48]
Experimental — accuracy not yet measured
Self-check
Percentages, sums and reported differences re-computed from the paper’s own numbers.
The self-check needs the paper’s full text.
Citations
Cites
Bro, R., & Smilde, A. K. (2014) · Anal. Methods · doi:10.1039/c3ay41907j · Cited by 3,038
Bacillus subtilis antibiotics: structures, syntheses and specific functions
Stein, T. H. (2005) · Molecular Microbiology · doi:10.1111/j.1365-2958.2005.04587.x · Cited by 1,573
Trehalose accumulation in rice plants confers high tolerance levels to different abiotic stresses
Garg, A. K., Kim, J.-K., Owens, T. G., Ranwala, A. P., Choi, Y. D., Kochian, L. V., & Wu, R. J. (2002) · Proceedings of the National Academy of Sciences · doi:10.1073/pnas.252637799 · Cited by 1,346
Serrano‐Ruiz, J. C., Luque, R., & Sepúlveda‐Escribano, A. (2011) · Chemical Society Reviews · doi:10.1039/c1cs15131b · Cited by 897
Triba, M. N., Moyec, L. L., Amathieu, R., Goossens, C., Bouchemal, N., Nahon, P., Rutledge, D. N., & Savarin, P. (2014) · Molecular BioSystems · doi:10.1039/c4mb00414k · Cited by 709
Bidirectional modulation of insulin action by amino acids.
Patti, M., Brambilla, E., Luzi, L., Landaker, E. J., & Kahn, C. R. (1998) · Journal of Clinical Investigation · doi:10.1172/jci1326 · Cited by 493
The Role of Leucine in Weight Loss Diets and Glucose Homeostasis
Layman, D. K. (2003) · Journal of Nutrition · doi:10.1093/jn/133.1.261s · Cited by 385
Huang, J., Hirji, R. N., Adam, L., Rozwadowski, K. L., Hammerlindl, J. K., Keller, W. A., & Selvaraj, G. (2000) · PLANT PHYSIOLOGY · doi:10.1104/pp.122.3.747 · Cited by 361
Microbial alkaline proteases: Optimization of production parameters and their properties
Sharma, K. M., Kumar, R., Panwar, S., & Kumar, A. (2017) · Journal of Genetic Engineering and Biotechnology · doi:10.1016/j.jgeb.2017.02.001 · Cited by 349
Metabolomics: quantification of intracellular metabolite dynamics
Buchholz, A., Hurlebaus, J., Wandrey, C., & Takors, R. (2002) · Biomolecular Engineering · doi:10.1016/s1389-0344(02)00003-5 · Cited by 220
Cited by
Sorted by citations
Bacterial osmoprotectants—a way to survive in saline conditions and potential crop allies
Goszcz, A., Furtak, K., Stasiuk, R., Wójtowicz, J., Musiałowski, M., Schiavon, M., & Dębiec-Andrzejewska, K. (2025) · FEMS Microbiology Reviews · doi:10.1093/femsre/fuaf020 · Cited by 71
Lee, K., Kwon, S.-H., Song, S., Lee, D. Y., Park, M. K., & Kim, Y. S. (2023) · Metabolites · doi:10.3390/metabo13020219 · Cited by 13
Self-citationPark, M. K., Hong, C. P., Kim, B. S., Lee, D. Y., & Kim, Y.-S. (2023) · Journal of Agricultural and Food Chemistry · doi:10.1021/acs.jafc.3c01900 · Cited by 12
Self-citationLee, Y. R., & Lee, S. (2025) · Journal of Ethnic Foods · doi:10.1186/s42779-025-00294-2 · Cited by 8
Self-citationSalgaço, M. K., de Oliveira, F. L., Sartoratto, A., Mesa, V., Mayer, M. P. A., & Sivieri, K. (2023) · Fermentation · doi:10.3390/fermentation9080740 · Cited by 8
Metadata
- Authors
- Park, M.-K., Lee, S., & Kim, Y.-S.
- Affiliations
- Ewha Womans University (KR)
- Department of Food Science and Biotechnology, Ewha Womans University, Seoul 03760, Korea
- Corresponding author
- Kim, Young-Suk
- Venue
- Metabolites
- Publisher
- MDPI AG
- Published
- 2022-01-25
- Volume
- 12
- Issue
- 2
- Pages
- 112
- ISSN
- 2218-1989 (ISSN-L)
- PMC
- PMC8880083
- OpenAlex
- W4210345244
- Cited by
- 15
- References
- 39
- Citations by year
- 2026: 6 · 2025: 4 · 2024: 1 · 2023: 3 · 2022: 1
- FWCI
- 1.20
- Type
- journal article
- Language
- en
- Open access
- gold
- doi.org
- Licence
- Locations
- Metabolites (publishedVersion, cc-by)
- PubMed Central (publishedVersion, cc-by)
- PubMed (publishedVersion)
- DOAJ (DOAJ: Directory of Open Access Journals) (submittedVersion, cc-by-sa)
- Funders
- National Research Foundation of Korea (NRF-2020R1A2C2004724)
- Korea government (BK 21 FOUR) (No. 4299990914600)
- Topics
- Life Sciences › Agricultural and Biological Sciences › Food Science › Probiotics and Fermented Foods
- Life Sciences › Biochemistry, Genetics and Molecular Biology › Genetics › Bacterial Genetics and Biotechnology
- Life Sciences › Biochemistry, Genetics and Molecular Biology › Molecular Biology › Microbial Metabolic Engineering and Bioproduction
- Keywords
- Bacillus subtilis, pH stress, osmotic stress, high salt concentration, alkaline pH, leucine metabolism, leucine degradation, volatile metabolites, secondary metabolites, proline, furan, pyrrole, fatty acid derivatives, isovaleric acid, isoamyl alcohol, 3-methylbutanal, fermented food quality, sensory properties
About these checks
Registry, retraction, Cites and statistics results are computed, not judged, with one exception: a printed reference that no index lists is read once by a model before it counts as a citation error. Claims are extracted by a model and kept only when their quote appears verbatim in the text; each cited source is then checked, with a model’s help, for whether it says what the claim relies on. Those verdicts can be wrong — read the claim’s quote and the cited source before relying on one.
Statistics and arithmetic are recomputed, not judged.
Confidence bands are shown only for fields calibrated on our annotated test set. None is calibrated yet, so no band is shown.
What counts as a claim ›How we measure confidence ›How we check this ›
Are you an author, or do you see a problem with this page? Request a review
