

Circulating Phospholipid Patterns in NAFLD Patients Associated with a Combination of Metabolic Risk Factors
Open accessThe DOI matches its Crossref record; 42 of the 42 references it cites were found in a registry or an index.
Abstract
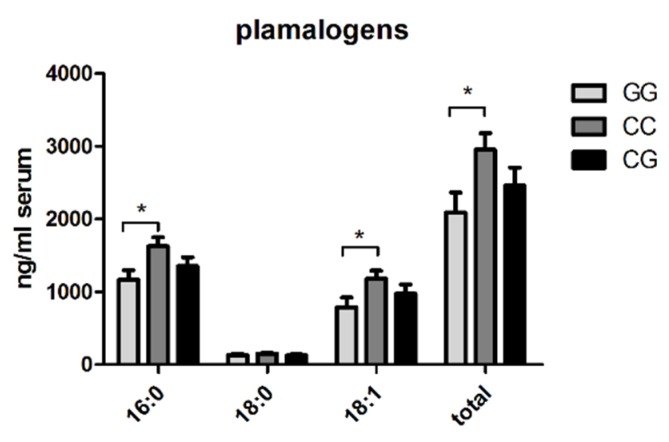
Background: Non-alcoholic fatty liver disease (NAFLD) is associated with inefficient macro- and micronutrient metabolism, and alteration of circulating phospholipid compositions defines the signature of NAFLD. This current study aimed to assess the pattern of serum phospholipids in the spectrum of NAFLD, and its related comorbidities and genetic modifications. Methods: 97 patients with diagnosed NAFLD were recruited at a single center during 2013–2016. Based on histological and transient elastography assessment, 69 patients were divided into non-alcoholic steatohepatitis (NASH) and non-alcoholic fatty liver (NAFL) subgroups. 28 patients served as healthy controls. Serum phospholipids were determined by liquid-chromatography mass spectrometry (LC-MS/MS). Results: The total content of phosphatidylcholine (PC) and sphingomyelin in the serum was significantly increased in NAFL and NASH patients, compared to healthy controls. In addition, serum lysophospatidylethanolamine levels were significantly decreased in NAFL and NASH individuals. Circulating PC species, containing linoleic and α-linolenic acids, were markedly increased in NAFLD patients with hypertension, compared to NAFLD patients without hypertension. The pattern of phospholipids did not differ between NAFLD patients with diabetes and those without diabetes. However, NAFLD patients with hyperglycemia (blood glucose level (BGL) >100 mg/dL) exhibited significantly a higher amount of monounsaturated phosphatidylethanolamine than those with low blood glucose levels. In addition, NAFLD patients with proven GG-genotype of PNPLA3, who were at higher risk for the development of progressive disease with fibrosis, showed lower levels of circulating plasmalogens, especially 16:0, compared to those with CC- and CG-allele. Conclusions: Our extended lipidomic study presents a unique metabolic profile of circulating phospholipids associated with the presence of metabolic risk factors or the genetic background of NAFLD patients.
Overview
The claims and statistics of this paper haven’t been checked yet.
Free: it reads the open-access text and checks the first 5 claims that cite a source we can check. Create a free account to check every claim.
Integrity signals
Registry
Cites
Statistics
Figures


Verification
Claims the paper makes
The claims and statistics of this paper haven’t been checked yet.
Free: it reads the open-access text and checks the first 5 claims that cite a source we can check. Create a free account to check every claim.
Claims other papers make about this one
Each is checked against this paper’s own text: does it say what the citing paper says it does?
In the citing paper
“Also, conflicting results were reported for sphingomyelins, which were found to be both increased94,108,111,113 and decreased94,113,114 in MASLD.”
From Lipid metabolism in MASLD and MASH: From mechanism to the clinic (2024) · cites this paper as [111]
Self-check
Percentages, sums and reported differences re-computed from the paper’s own numbers.
The self-check needs the paper’s full text.
Citations
Cites
A SIMPLE METHOD FOR THE ISOLATION AND PURIFICATION OF TOTAL LIPIDES FROM ANIMAL TISSUES
Folch, J., Lees, M., & Stanley, G. H. S. (1957) · Journal of Biological Chemistry · doi:10.1016/s0021-9258(18)64849-5 · Cited by 65,189 · cited 1×
“A classical Folch method, which uses chloroform/methanol (3:2, v/v), was applied to the glass tubes [16].”
MethodGenetic variation in PNPLA3 confers susceptibility to nonalcoholic fatty liver disease
Romeo, S., Kozlitina, J., Xing, C., Pertsemlidis, A., Cox, D., Pennacchio, L. A., Boerwinkle, E., Cohen, J. C., & Hobbs, H. H. (2008) · Nature Genetics · doi:10.1038/ng.257 · Cited by 3,416
Williams, C. D., Stengel, J., Asike, M. I., Torres, D. M., Shaw, J., Contreras, M., Landt, C. L., & Harrison, S. A. (2011) · Gastroenterology · doi:10.1053/j.gastro.2010.09.038 · Cited by 2,148
A lipidomic analysis of nonalcoholic fatty liver disease
Puri, P., Baillie, R. A., Wiest, M. M., Mirshahi, F., Choudhury, J., Cheung, O., Sargeant, C., Contos, M. J., & Sanyal, A. J. (2007) · Hepatology · doi:10.1002/hep.21763 · Cited by 1,338 · cited 4×
“showed a significant decrease of hepatic phosphatidiylcholine (PC) levels and hepatic lipid subclasses containing arachidonic acid (AA) in NAFLD patients [7].”
BackgroundResultInfluentialEpidemiology of Non-Alcoholic Fatty Liver Disease
Bellentani, S., Scaglioni, F., Marino, M., & Bedogni, G. (2010) · Digestive Diseases · doi:10.1159/000282080 · Cited by 1,026 · cited 2×
“Non-alcoholic fatty liver disease (NAFLD) is one of the most common causes of chronic liver disease in the western world, and is linked to increasing prevalence of obesity and diabetes [1,2].”
BackgroundBedossa, P., Poitou, C., Veyrie, N., Bouillot, J.-L., Basdevant, A., Paradis, V., Tordjman, J., & Clement, K. (2012) · Hepatology · doi:10.1002/hep.25889 · Cited by 903
Alcoholic fatty liver: its pathogenesis and mechanism of progression to inflammation and fibrosis
Lieber, C. S. (2004) · Alcohol · doi:10.1016/j.alcohol.2004.07.008 · Cited by 699
The plasma lipidomic signature of nonalcoholic steatohepatitis
Puri, P., Wiest, M. M., Cheung, O., Mirshahi, F., Sargeant, C., Min, H., Contos, M. J., Sterling, R. K., Fuchs, M., Zhou, H., et al. (2009) · Hepatology · doi:10.1002/hep.23229 · Cited by 655 · cited 2×
“reported low circulating serum plasmalogen levels in patients presenting with NASH in their lipidomics study [10].”
BackgroundHealth effects of dietary phospholipids
Küllenberg, D., Taylor, L. A., Schneider, M., & Massing, U. (2012) · Lipids in Health and Disease · doi:10.1186/1476-511x-11-3 · Cited by 561
Molecular Mechanisms of Lipotoxicity in Nonalcoholic Fatty Liver Disease
Malhi, H., & Gores, G. (2008) · Seminars in Liver Disease · doi:10.1055/s-0028-1091980 · Cited by 538
Abdelmalek, M. (2001) · The American Journal of Gastroenterology · doi:10.1016/s0002-9270(01)02691-0 · Cited by 439
INTERSALT study findings. Public health and medical care implications
Stamler, J., Rose, G., Stamler, R., Elliott, P., Dyer, A., & Marmot, M. (1989) · Hypertension · doi:10.1161/01.hyp.14.5.570 · Cited by 426 · cited 1×
“Few epidemiological studies suggest a positive impact of dietary intake of essential PUFAs on cholesterol profiling or blood pressure [19,30].”
BackgroundFunctions and biosynthesis of plasmalogens in health and disease
Brites, P., Waterham, H. R., & Wanders, R. J. A. (2004) · Biochimica et Biophysica Acta (BBA) - Molecular and Cell Biology of Lipids · doi:10.1016/j.bbalip.2003.12.010 · Cited by 416
Fast food fever: reviewing the impacts of the Western diet on immunity
Myles, I. A. (2014) · Nutrition Journal · doi:10.1186/1475-2891-13-61 · Cited by 380
Palmitic and linoleic acids induce ER stress and apoptosis in hepatoma cells
Zhang, Y., Xue, R., Zhang, Z., Yang, X., & Shi, H. (2012) · Lipids in Health and Disease · doi:10.1186/1476-511x-11-1 · Cited by 335
Plasmalogens the neglected regulatory and scavenging lipid species
Wallner, S., & Schmitz, G. (2011) · Chemistry and Physics of Lipids · doi:10.1016/j.chemphyslip.2011.06.008 · Cited by 323
Feldstein, A. E., Lopez, R., Tamimi, T. A.-R., Yerian, L., Chung, Y.-M., Berk, M., Zhang, R., McIntyre, T. M., & Hazen, S. L. (2010) · Journal of Lipid Research · doi:10.1194/jlr.m007096 · Cited by 297
Trépo, E., Romeo, S., Zucman-Rossi, J., & Nahon, P. (2016) · Journal of Hepatology · doi:10.1016/j.jhep.2016.03.011 · Cited by 291
Dissecting the Chemistry of Protein Splicing and Its Applications
Noren, C. J., Wang, J., & Perler, F. B. (2000) · Angewandte Chemie International Edition · doi:10.1002/(sici)1521-3773(20000204)39:3<450::aid-anie450>3.0.co;2-f · Cited by 274
Loomba, R., Quehenberger, O., Armando, A., & Dennis, E. A. (2015) · Journal of Lipid Research · doi:10.1194/jlr.p055640 · Cited by 197
Hepatocyte autotaxin expression promotes liver fibrosis and cancer
Kaffe, E., Katsifa, A., Xylourgidis, N., Ninou, I., Zannikou, M., Harokopos, V., Foka, P., Dimitriadis, A., Evangelou, K., Moulas, A. N., et al. (2017) · Hepatology · doi:10.1002/hep.28973 · Cited by 187
Retarded release phosphatidylcholine benefits patients with chronic active ulcerative colitis
Stremmel, W. (2005) · Gut · doi:10.1136/gut.2004.052316 · Cited by 176
Self-citationII. Veterans Affairs Cooperative Study of Polyenylphosphatidylcholine in Alcoholic Liver Disease
Lieber, C. S., Weiss, D. G., Groszmann, R., Paronetto, F., Schenker, S., & for the Veterans Affairs Cooperative Study 391 Group (2003) · Alcoholism: Clinical and Experimental Research · doi:10.1097/01.alc.0000093743.03049.80 · Cited by 128
Bemelmans, W. J. E., Lefrandt, J. D., Feskens, E. J. M., Haelst, P. L. V., Broer, J., Meyboom-de Jong, B., May, J. F., Tervaert, J. W. C., & Smit, A. J. (2004) · European Journal of Clinical Nutrition · doi:10.1038/sj.ejcn.1601938 · Cited by 123 · cited 2×
“In particular, intake and metabolism of essential fatty acids are relevant to the pathogenesis of different chronic diseases [27,28].”
BackgroundResultCirculating phospholipid profiling identifies portal contribution to NASH signature in obesity
Anjani, K., Lhomme, M., Sokolovska, N., Poitou, C., Aron-Wisnewsky, J., Bouillot, J.-L., Lesnik, P., Bedossa, P., Kontush, A., Clement, K., et al. (2015) · Journal of Hepatology · doi:10.1016/j.jhep.2014.11.002 · Cited by 106
Ma, D. W. L., Arendt, B. M., Hillyer, L. M., Fung, S. K., McGilvray, I. D., Guindi, M. M., & Allard, J. P. (2016) · Nutrition and Diabetes · doi:10.1038/nutd.2016.27 · Cited by 100
Protective role of endogenous plasmalogens against hepatic steatosis and steatohepatitis in mice
Jang, J. E., Park, H., Yoo, H. J., Baek, I., Yoon, J. E., Ko, M. S., Kim, A., Kim, H. S., Park, H., Lee, S. E., et al. (2017) · Hepatology · doi:10.1002/hep.29039 · Cited by 93
Krawczyk, M. J., Grünhage, F., Zimmer, V., & Lammert, F. (2010) · Journal of Hepatology · doi:10.1016/j.jhep.2010.10.042 · Cited by 92
Differential Intrahepatic Phospholipid Zonation in Simple Steatosis and Nonalcoholic Steatohepatitis
Wattacheril, J., Seeley, E. H., Angel, P., Chen, H., Bowen, B. P., Lanciault, C., M.Caprioli, R., Abumrad, N., & Flynn, C. R. (2013) · PLoS ONE · doi:10.1371/journal.pone.0057165 · Cited by 88
Pathil, A., Mueller, J., Warth, A., Chamulitrat, W., & Stremmel, W. (2011) · Hepatology · doi:10.1002/hep.25531 · Cited by 87
Self-citationScherhag, R., Kramer, H. J., & Düsing, R. (1982) · Prostaglandins · doi:10.1016/0090-6980(82)90082-x · Cited by 81
The Clinicopathologic Spectrum and Management of Nonalcoholic Fatty Liver Disease
Contos, M. J., & Sanyal, A. J. (2002) · Advances in Anatomic Pathology · doi:10.1097/00125480-200201000-00005 · Cited by 80
Carpino, G., Pastori, D., Baratta, F., Overi, D., Labbadia, G., Polimeni, L., Di Costanzo, A., Pannitteri, G., Carnevale, R., Del Ben, M., et al. (2017) · Scientific Reports · doi:10.1038/s41598-017-15943-z · Cited by 59
Böhm, T., Berger, H., Nejabat, M., Riegler, T., Kellner, F., Kuttke, M., Sagmeister, S., Bazanella, M., Stolze, K., Daryabeigi, A., et al. (2013) · Journal of Hepatology · doi:10.1016/j.jhep.2013.04.025 · Cited by 55
Chamulitrat, W., Burhenne, J., Rehlen, T., Pathil, A., & Stremmel, W. (2009) · Hepatology · doi:10.1002/hep.22955 · Cited by 52
Self-citationOxidized metabolites of linoleic acid as biomarkers of liver injury in nonalcoholic steatohepatitis
Santoro, N., Caprio, S., & Feldstein, A. E. (2013) · Clinical Lipidology · doi:10.2217/clp.13.39 · Cited by 33
Sookwong, P., Nakagawa, K., Fujita, I., Shoji, N., & Miyazawa, T. (2011) · Lipids · doi:10.1007/s11745-011-3588-3 · Cited by 32
Oxidation of Linoleic Acid in Low-Density Lipoprotein: An Important Event in Atherogenesis
Spiteller, D., & Spiteller, G. (2000) · Angewandte Chemie International Edition · doi:10.1002/(sici)1521-3773(20000204)39:3<585::aid-anie585>3.0.co;2-g · Cited by 32
Li, J., Gan‐Schreier, H., Zhu, X., Wang, W., Tuma‐Kellner, S., Liebisch, G., Stremmel, W., & Chamulitrat, W. (2017) · Biochimica et Biophysica Acta (BBA) - Molecular and Cell Biology of Lipids · doi:10.1016/j.bbalip.2017.09.001 · Cited by 24
Self-citationChamulitrat, W., Liebisch, G., Xu, W., Gan‐Schreier, H., Pathil, A., Schmitz, G., & Stremmel, W. (2013) · Molecular Pharmacology · doi:10.1124/mol.113.088039 · Cited by 21
Self-citationAre diets high in omega-6 polyunsaturated fatty acids unhealthy?
Berry, E. M. (2001) · European Heart Journal Supplements · doi:10.1016/s1520-765x(01)90117-8 · Cited by 20
Tandem Mass Spectrometry Analysis of Amadori‐Glycated Phosphatidylethanolamine in Human Plasma
Miyazawa, T., OAK, J., & Nakagawa, K. (2005) · Annals of the New York Academy of Sciences · doi:10.1196/annals.1333.034 · Cited by 13
Cited by
How does hepatic lipid accumulation lead to lipotoxicity in non-alcoholic fatty liver disease?
Geng, Y., Faber, K. N., de Meijer, V. E., Blokzijl, H., & Moshage, H. (2021) · Hepatology International · doi:10.1007/s12072-020-10121-2 · Cited by 432
Non-alcoholic fatty liver disease in lean individuals
Albhaisi, S., Chowdhury, A., & Sanyal, A. J. (2019) · JHEP Reports · doi:10.1016/j.jhepr.2019.08.002 · Cited by 174
Lipid metabolism in MASLD and MASH: From mechanism to the clinic
Carli, F., Della Pepa, G., Sabatini, S., Vidal Puig, A., & Gastaldelli, A. (2024) · JHEP Reports · doi:10.1016/j.jhepr.2024.101185 · Cited by 147
“94 Also, con fl icting results were reported for sphingomyelins, which were found to be both increased 94,108,111,113 and decreased 94,113,114 in MASLD.”
Lipidomics in non-alcoholic fatty liver disease
Kartsoli, S., Kostara, C. E., Tsimihodimos, V., Bairaktari, E. T., & Christodoulou, D. K. (2020) · World Journal of Hepatology · doi:10.4254/wjh.v12.i8.436 · Cited by 163
Yamamoto, Y., Sakurai, T., Chen, Z., Inoue, N., Chiba, H., & Hui, S. (2022) · Nutrients · doi:10.3390/nu14030579 · Cited by 104
Metadata
- Authors
- Tiwari-Heckler, S., Gan-Schreier, H., Stremmel, W., Chamulitrat, W., & Pathil, A.
- Affiliations
- Department of Internal Medicine IV, Gastroenterology and Hepatology, University of Heidelberg, Im Neuenheimer Feld 410, 69120 Heidelberg, Germany
- Heidelberg University (DE)
- Corresponding author
- Pathil, Anita
- Venue
- Nutrients
- Publisher
- MDPI AG
- Published
- 2018-05-21
- Volume
- 10
- Issue
- 5
- Pages
- 649
- ISSN
- 2072-6643 (ISSN-L)
- PMC
- PMC5986528
- OpenAlex
- W2803425795
- Cited by
- 96
- References
- 42
- Citations by year
- 2026: 9 · 2025: 10 · 2024: 16 · 2023: 16 · 2022: 13 · 2021: 15 · 2020: 10 · 2019: 7
- FWCI
- 6.24
- Type
- journal article
- Language
- en
- Open access
- gold
- doi.org
- Licence
- Locations
- Nutrients (publishedVersion, cc-by)
- Europe PMC (PubMed Central) (publishedVersion, cc-by)
- PubMed Central (publishedVersion, cc-by)
- PubMed (publishedVersion)
- DOAJ (DOAJ: Directory of Open Access Journals) (submittedVersion)
- Funders
- German Research Foundation (PA 2365/1-1)
- Topics
- Health Sciences › Medicine › Hepatology › Liver Disease Diagnosis and Treatment
- Life Sciences › Biochemistry, Genetics and Molecular Biology › Molecular Biology › Metabolomics and Mass Spectrometry Studies
- Life Sciences › Biochemistry, Genetics and Molecular Biology › Biochemistry › Lipid metabolism and biosynthesis
- Keywords
- non-alcoholic fatty liver disease, nonalcoholic steatohepatitis, serum phospholipids, lipidomics, phosphatidylcholine, sphingomyelin, lysophosphatidylethanolamine, plasmalogens, linoleic acid, alpha-linolenic acid, hypertension, hyperglycemia, diabetes mellitus, liver fibrosis, metabolic risk factors
- MeSH terms
- Acyltransferases, Adult, Chromatography, High Pressure Liquid, Female, Germany, Humans, Lipase, Male, Membrane Proteins, Middle Aged, Phospholipids, Polymorphism, Genetic, Risk Factors, Biomarkers, Comorbidity, Case-Control Studies, Spectrometry, Mass, Electrospray Ionization, Tandem Mass Spectrometry, Elasticity Imaging Techniques, Phospholipases A2, Calcium-Independent, Metabolomics, Non-alcoholic Fatty Liver Disease
About these checks
Registry, retraction, Cites and statistics results are computed, not judged, with one exception: a printed reference that no index lists is read once by a model before it counts as a citation error. Claims are extracted by a model and kept only when their quote appears verbatim in the text; each cited source is then checked, with a model’s help, for whether it says what the claim relies on. Those verdicts can be wrong — read the claim’s quote and the cited source before relying on one.
Statistics and arithmetic are recomputed, not judged.
Confidence bands are shown only for fields calibrated on our annotated test set. None is calibrated yet, so no band is shown.
What counts as a claim ›How we measure confidence ›How we check this ›
Are you an author, or do you see a problem with this page? Request a review
Data sources
Bibliographic data: Semantic Scholar, OpenAlex, Crossref.
Contains information from the Semantic Scholar Academic Graph Datasets, made available under the ODC Attribution License (ODC-BY 1.0).
Semantic Scholar’s data is described in: Kinney, R., et al. (2023). The Semantic Scholar Open Data Platform. arXiv:2301.10140.
