

The DOI matches its Crossref record; 66 of the 66 references it cites were found in a registry or an index.
Deciphering the Genetic Mechanisms of Salt Tolerance in Sorghum bicolor L.: Key Genes and SNP Associations from Comparative Transcriptomic Analyses
Open accessAbstract
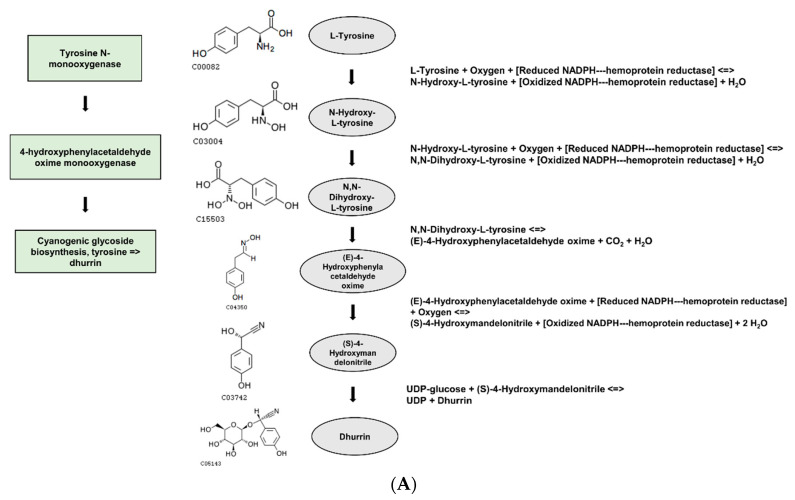
Sorghum bicolor L. is a vital cereal crop for global food security. Its adaptability to diverse climates make it economically, socially, and environmentally valuable. However, soil salinization caused by climate extremes poses a threat to sorghum. This study aimed to identify candidate salt-tolerant genes and single nucleotide polymorphisms (SNPs) by performing a comparative transcriptome analysis on a mutant sorghum line and its wild type. The mutant line was generated through gamma ray exposure and selection for salt tolerance. Phenotypic measurements were taken, followed by mRNA sequencing and variant calling. In this study, potential genes and non-synonymous SNPs associated with salt tolerance were inferred, including LOC8071970, LOC8067721, LOC110430887, LOC8070256, and LOC8056880. These genes demonstrated notable differences in nsSNPs in comparison to the wild type, suggesting their potential roles in salt tolerance. Additionally, LOC8060874 (cyanohydrin beta-glucosyltransferase) was suggested as a key gene involved in salt tolerance due to its possible role in dhurrin biosynthesis under salt stress. In upcoming research, additional reverse genetics studies will be necessary in order to verify the function of those candidate genes in relation to salt stress. In conclusion, this study underscores the significance of investigating salt tolerance mechanisms and the potential key genes associated with salt tolerance in sorghum. Our findings may provide insights for future breeding strategies aimed at enhancing salinity tolerance and crop productivity.
Overview
The claims and statistics of this paper haven’t been checked yet.
Run the check — free, no account needed. It reads the open-access text and checks the sources it cites.
Integrity signals
Registry
Cites
Statistics
Figures
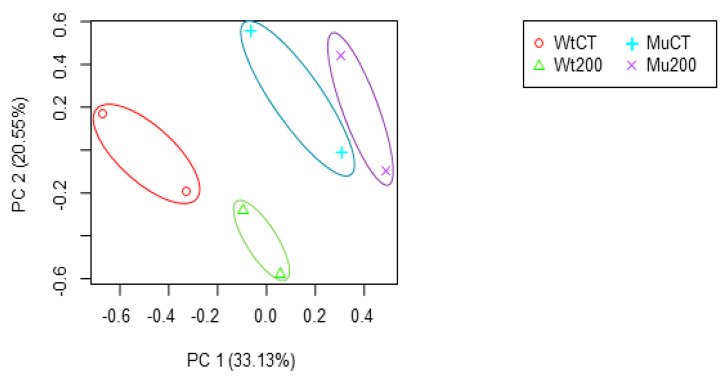
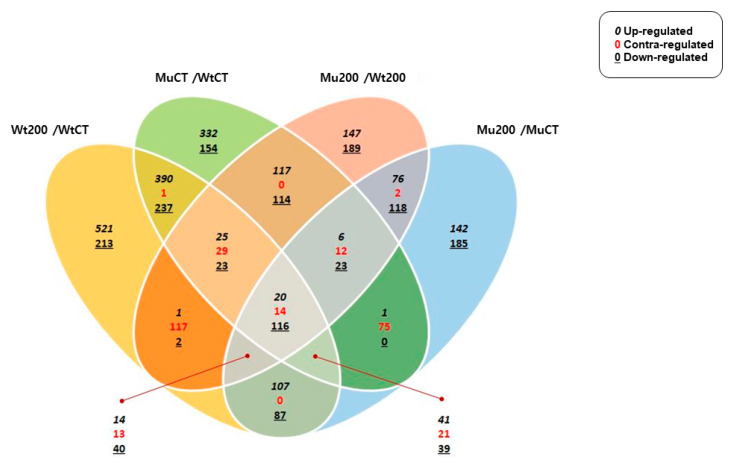
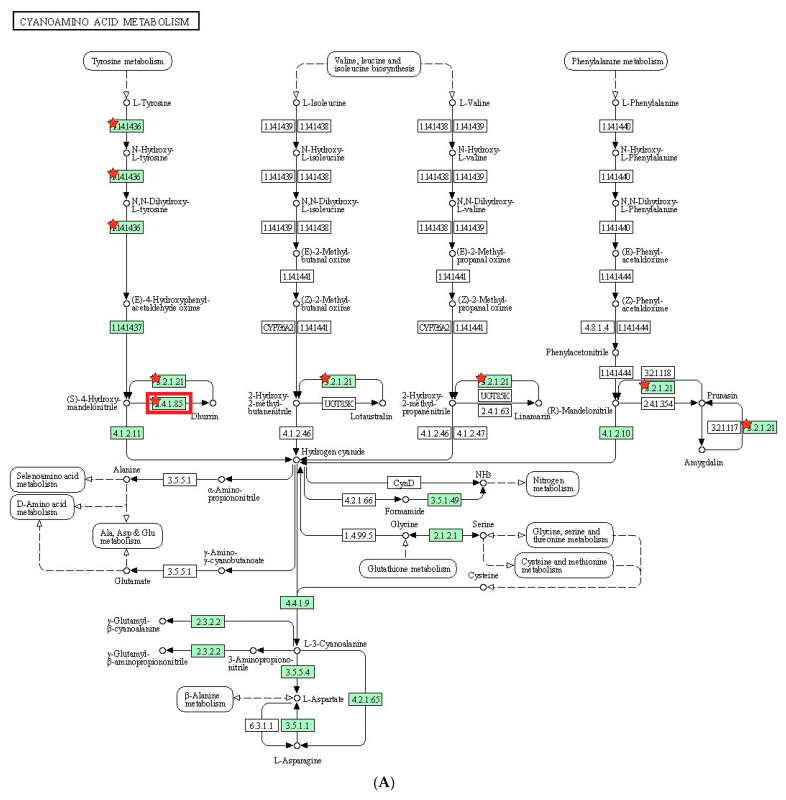
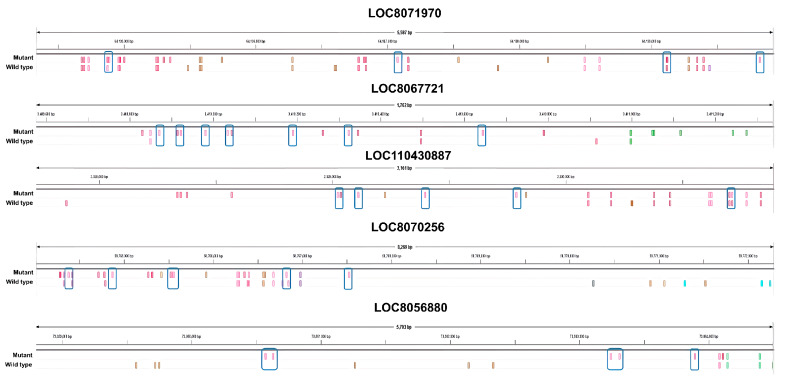
Verification
Claims the paper makes
The claims and statistics of this paper haven’t been checked yet.
Run the check — free, no account needed. It reads the open-access text and checks the sources it cites.
Claims other papers make about this one
Each is checked against this paper’s own text: does it say what the citing paper says it does?
The source backs part of the claim, not all of it — or backs it for a different population, condition or comparison.
In the citing paper
“Furthermore, the integration of multi-omics approaches, such as comparative transcriptomic analyses, has helped identify essential genes associated with salt stress response in sorghum (Jeon et al., 2023).”
From Emerging applications of gene editing technologies for the development of climate-resilient crops (2025) · cites this paper as Jeon et al., 2023
Experimental — accuracy not yet measured
Self-check
Percentages, sums and reported differences re-computed from the paper’s own numbers.
The self-check needs the paper’s full text.
Citations
Cites
SWISS-MODEL: homology modelling of protein structures and complexes
Waterhouse, A. M., Bertoni, M., Bienert, S., Studer, G., Tauriello, G., Gumienny, R., Heer, F. T., de Beer, T., Rempfer, C., Bordoli, L., et al. (2018) · Nucleic Acids Research · doi:10.1093/nar/gky427 · Cited by 13,248
TopHat: discovering splice junctions with RNA-Seq
Trapnell, C., Pachter, L. S., & Salzberg, S. L. (2009) · Bioinformatics · doi:10.1093/bioinformatics/btp120 · Cited by 11,682
The Sorghum bicolor genome and the diversification of grasses
Paterson, A. H., Bowers, J., Bruggmann, R., Dubchak, I. L., Grimwood, J., Gundlach, H., Haberer, G., Hellsten, U., Mitros, T., Poliakov, A., et al. (2009) · Nature · doi:10.1038/nature07723 · Cited by 3,150
Plant Immunity to Insect Herbivores
Howe, G. A., & Jander, G. (2007) · Annual Review of Plant Biology · doi:10.1146/annurev.arplant.59.032607.092825 · Cited by 2,493
Human non-synonymous SNPs: server and survey
Ramensky, V. E. (2002) · Nucleic Acids Research · doi:10.1093/nar/gkf493 · Cited by 2,299
PlantRegMap: charting functional regulatory maps in plants
Tian, F., Yang, D.-C., Meng, Y.-Q., Jin, J., & Gao, G. (2019) · Nucleic Acids Research · doi:10.1093/nar/gkz1020 · Cited by 1,018
Plant salt-tolerance mechanism: A review
Liang, W., Ma, X., Wan, P., & Liu, L. (2017) · Biochemical and Biophysical Research Communications · doi:10.1016/j.bbrc.2017.11.043 · Cited by 929
Cyanogenic Glycosides: Synthesis, Physiology, and Phenotypic Plasticity
Gleadow, R. M., & Møller, B. L. (2014) · Annual Review of Plant Biology · doi:10.1146/annurev-arplant-050213-040027 · Cited by 511
Liu, J., Srivastava, R., Che, P., & Howell, S. H. (2007) · The Plant Journal · doi:10.1111/j.1365-313x.2007.03195.x · Cited by 480
Osmotic Stress Responses and Plant Growth Controlled by Potassium Transporters in Arabidopsis
Osakabe, Y., Arinaga, N., Umezawa, T., et al. (2013) · The Plant Cell · doi:10.1105/tpc.112.105700 · Cited by 385
Nxele, X., Klein, A., & Ndimba, B. K. (2016) · South African Journal of Botany · doi:10.1016/j.sajb.2016.11.003 · Cited by 376
Wrzaczek, M., Brosché, M., Salojärvi, J., Kangasjärvi, S., Idänheimo, N., Mersmann, S., Robatzek, S., Karpiński, S. M., Karpińska, B., & Kangasjärvi, J. (2010) · BMC Plant Biology · doi:10.1186/1471-2229-10-95 · Cited by 320
Dehnavi, A. R., Zahedi, M., Ludwiczak, A., Cárdenas-Pérez, S., & Piernik, A. (2020) · Agronomy · doi:10.3390/agronomy10060859 · Cited by 272
Che, P., Bussell, J. D., Zhou, W., Estavillo, G. M., Pogson, B. J., & Smith, S. M. (2010) · Science Signaling · doi:10.1126/scisignal.2001140 · Cited by 270
Bourdais, G., Burdiak, P., Gauthier, A., et al. (2015) · PLoS Genetics · doi:10.1371/journal.pgen.1005373 · Cited by 240
Specific Roles of Lipoxygenases in Development and Responses to Stress in Plants
Singh, P., Arif, Y., Miszczuk, E., Bajguz, A., & Hayat, S. (2022) · Plants · doi:10.3390/plants11070979 · Cited by 236
Neilson, E. H. J., Edwards, A. M., Blomstedt, C. K., Berger, B., Møller, B. L., & Gleadow, R. M. (2015) · Journal of Experimental Botany · doi:10.1093/jxb/eru526 · Cited by 219
Busk, P. K., & Møller, B. L. (2002) · PLANT PHYSIOLOGY · doi:10.1104/pp.000687 · Cited by 197
Chen, D., Wu, F., Li, Y., et al. (2019) · Frontiers in Plant Science · doi:10.3389/fpls.2019.00178 · Cited by 193
Jones, P. R., Møller, B. L., & Høj, P. B. (1999) · Journal of Biological Chemistry · doi:10.1074/jbc.274.50.35483 · Cited by 185
Subtilisin‐like proteases in plant defence: the past, the present and beyond
Figueiredo, J., Silva, M. S., & Figueiredo, A. (2017) · Molecular Plant Pathology · doi:10.1111/mpp.12567 · Cited by 183
Yeh, Y., Chang, Y.-H., Huang, P., Huang, J., & Zimmerli, L. (2015) · Frontiers in Plant Science · doi:10.3389/fpls.2015.00322 · Cited by 177
A proteomic approach identifies many novel palmitoylated proteins in A rabidopsis
Hemsley, P. A., Weimar, T., Lilley, K. S., et al. (2012) · New Phytologist · doi:10.1111/nph.12077 · Cited by 164
Sui, N., Tian, S., Wang, W., Wang, M., & Hai, F. (2017) · Frontiers in Plant Science · doi:10.3389/fpls.2017.01337 · Cited by 159
Hernández, P. E., Chávez‐González, M. L., Ascacio-Valdés, J. A., Dávila-Medina, D., Naveda, A. F., da Silva, T. G., Rúelas-Chácon, X., & Sepúlveda, L. (2020) · Critical Reviews in Food Science and Nutrition · doi:10.1080/10408398.2020.1852389 · Cited by 143
Zhang, Z., Mao, C., Shi, Z., & Kou, X. (2017) · Frontiers in Plant Science · doi:10.3389/fpls.2017.01231 · Cited by 133
Emerging Roles of SWEET Sugar Transporters in Plant Development and Abiotic Stress Responses
Gautam, T., Dutta, M., Jaiswal, V., Zinta, G., Gahlaut, V., & Kumar, S. (2022) · Cells · doi:10.3390/cells11081303 · Cited by 128
Research progress on plant tolerance to soil salinity and alkalinity in sorghum
Rui-dong, H. (2018) · Journal of Integrative Agriculture · doi:10.1016/s2095-3119(17)61728-3 · Cited by 117
Lü, K., Liang, S., Wu, Z., et al. (2016) · Journal of Experimental Botany · doi:10.1093/jxb/erw266 · Cited by 115
Highlighting reactive oxygen species as multitaskers in root development
Eljebbawi, A., Guerrero, Y. D. C. R., Dunand, C., & Estevez, J. M. (2020) · iScience · doi:10.1016/j.isci.2020.101978 · Cited by 97
Nielsen, L., Stuart, P., Pičmanová, M., Rasmussen, S., Olsen, C. E., Harholt, J., Møller, B. L., & Bjarnholt, N. (2016) · BMC Genomics · doi:10.1186/s12864-016-3360-4 · Cited by 88
The plasma membrane transport systems and adaptation to salinity
Mansour, M. M. F. (2014) · Journal of Plant Physiology · doi:10.1016/j.jplph.2014.08.016 · Cited by 86
Effects of PEG-induced osmotic stress on growth and dhurrin levels of forage sorghum
O’Donnell, N. H., Møller, B. L., Neale, A. D., Hamill, J. D., Blomstedt, C. K., & Gleadow, R. M. (2013) · Plant Physiology and Biochemistry · doi:10.1016/j.plaphy.2013.09.001 · Cited by 86
Wang, D., Gao, Y., Sun, S., Lu, X., Li, Q., Li, L., Wang, K., & Liu, J. (2022) · Life · doi:10.3390/life12111929 · Cited by 86
Lei, S., Rossi, S., & Huang, B. (2022) · Plants · doi:10.3390/plants11020199 · Cited by 81
Selection of Novel Cowpea Genotypes Derived through Gamma Irradiation
Horn, L. N., Ghebrehiwot, H. M., & Shimelis, H. (2016) · Frontiers in Plant Science · doi:10.3389/fpls.2016.00262 · Cited by 72
Rastogi, A., Kovár, M., He, X., et al. (2020) · Photosynthetica · doi:10.32615/ps.2019.169 · Cited by 71
Kumar, M., Carr, P., & Turner, S. R. (2022) · Nature Plants · doi:10.1038/s41477-022-01164-4 · Cited by 68
Mukisa, I. M., Muyanja, C. M. B. K., Byaruhanga, Y. B., et al. (2011) · Radiation Physics and Chemistry · doi:10.1016/j.radphyschem.2011.11.021 · Cited by 58
Salt Tolerance and Na Allocation in Sorghum bicolor under Variable Soil and Water Salinity
Calone, R., Sanoubar, R., Lambertini, C., Speranza, M., Antisari, L. V., Vianello, G., & Barbanti, L. (2020) · Plants · doi:10.3390/plants9050561 · Cited by 58
Montini, L., Crocoll, C., Gleadow, R. M., et al. (2020) · PLANT PHYSIOLOGY · doi:10.1104/pp.19.01357 · Cited by 57
Diurnal regulation of cyanogenic glucoside biosynthesis and endogenous turnover in cassava
Schmidt, F. B., Cho, S. K., Olsen, C. E., et al. (2018) · Plant Direct · doi:10.1002/pld3.38 · Cited by 42
OsTSD2‐mediated cell wall modification affects ion homeostasis and salt tolerance
Fang, C., Li, K., Wu, Y., et al. (2018) · Plant Cell & Environment · doi:10.1111/pce.13499 · Cited by 37
Mild and severe salt stress responses are age-dependently regulated by abscisic acid in tomato
Holsteens, K., Jaegere, I. D., Wynants, A., et al. (2022) · Frontiers in Plant Science · doi:10.3389/fpls.2022.982622 · Cited by 36
Induced protein polymorphisms and nutritional quality of gamma irradiation mutants of sorghum
Mehlo, L., Mbambo, Z., Bado, S., Lin, J., Moagi, S. M., Buthelezi, S. G., Stoychev, S., & Chikwamba, R. K. (2013) · Mutation research. Fundamental and molecular mechanisms of mutagenesis · doi:10.1016/j.mrfmmm.2013.05.002 · Cited by 31
Budič, M., Sabotič, J., Meglič, V., et al. (2012) · Plant Physiology and Biochemistry · doi:10.1016/j.plaphy.2012.10.022 · Cited by 31
A Multifactorial Regulation of Glutathione Metabolism behind Salt Tolerance in Rice
Cimini, S., Locato, V., Giacinti, V., et al. (2022) · Antioxidants · doi:10.3390/antiox11061114 · Cited by 31
Calcium-dependent protein kinase 2 plays a positive role in the salt stress response in potato
Grossi, C. E. M., Santin, F., Quintana, S. A., et al. (2021) · Plant Cell Reports · doi:10.1007/s00299-021-02676-7 · Cited by 30
Hong, M. J., Kim, D. Y., Nam, B. M., et al. (2018) · Journal of the Science of Food and Agriculture · doi:10.1002/jsfa.9141 · Cited by 29
Yan, K., Xu, H., Cao, W., & Chen, X. (2015) · Acta Physiologiae Plantarum · doi:10.1007/s11738-015-1957-x · Cited by 28
Ahmed, M. M., Abdalla, I. G., Salih, A. M., et al. (2018) · Food Science & Nutrition · doi:10.1002/fsn3.752 · Cited by 28
Sohail, M. N., Blomstedt, C. K., & Gleadow, R. M. (2020) · Plants · doi:10.3390/plants9121791 · Cited by 19
Delaplace, P., Frettinger, P., Ghanem, M. E., Blondiaux, A., Bauwens, J., Cotton, S., Clerck, C. D., Dewalque, A., Guy, J., Heuze, F., et al. (2009) · Cited by 15
Adaptive Response to Salt Stress in Sorghum (Sorghum bicolor)
Omari, R. E., & Nhiri, M. (2015) · Cited by 13
Prediction of Dhurrin Metabolism by Transcriptome and Metabolome Analyses in Sorghum
Choi, S. C., Chung, Y. S., Lee, Y. G., et al. (2020) · Plants · doi:10.3390/plants9101390 · Cited by 13
Safwat, G., & El-Salam, H. S. A. (2022) · Egyptian Journal of Botany · doi:10.21608/ejbo.2022.75826.1689 · Cited by 13
Su, M., Zhang, M., Liu, Y., et al. (2022) · Forests · doi:10.3390/f13111864 · Cited by 13
Hassan, A. B., Diab, E. E., Mahmoud, N. S., et al. (2013) · Radiation Physics and Chemistry · doi:10.1016/j.radphyschem.2013.05.008 · Cited by 10
Transcriptome analysis of the impact of exogenous methyl jasmonate on the opening of sorghum florets
Liu, S., Fu, Y., He, Y., et al. (2021) · PLoS ONE · doi:10.1371/journal.pone.0248962 · Cited by 10
(2020) · Indian Journal of Experimental Biology · doi:10.56042/ijeb.v58i06.65504 · Cited by 10
Expression Profile of Sorghum Genes and Cis-Regulatory Elements under Salt-Stress Conditions
Lee, S., Jeon, D., Choi, S.-H., et al. (2022) · Plants · doi:10.3390/plants11070869 · Cited by 7
Self-citationEffect of salinity on seed germination and seedlings growth of sorghum (Sorghum bicolor l.)
Sarkar, M. N., Hossain, A., Begum, S. A., et al. (2019) · Journal of Bioscience and Agriculture Research · doi:10.18801/jbar.210219.218 · Cited by 4
Physio-chemical and co-expression network analysis associated with salt stress in sorghum
sehyun, C., Kang, Y., Lee, S., et al. (2022) · Frontiers in Bioscience-Landmark · doi:10.31083/j.fbl2702055 · Cited by 4
Kim, J. M., Lyu, J. I., Ryu, J., et al. (2020) · Korean Journal of Breeding Science · doi:10.9787/kjbs.2020.52.1.32 · Cited by 3
Self-citationSeo, J. S., Lyu, J. I., Kim, J. M., et al. (2022) · Plant Breeding and Biotechnology · doi:10.9787/pbb.2022.10.2.128 · Cited by 2
Self-citationJeon, D., Lee, S., Choi, S., Kang, Y., & Kim, C. (2022) · Agronomy · doi:10.3390/agronomy12102511 · Cited by 2
Self-citation
Research works printed but not linked: 2
- Adhikari, 2022, Salt Stress Negatively Affects the Growth and Development, Net Photosynthetic, Chlorophyll Fluorescence, and Biochemical Responses in Lettuce (Lactuca sativa L.), Hortscience, 57, S145
- Mansour, 2020, Plasma membrane lipids and adaptation of plants to salt stress, Adv. Environ. Res., 78, 1
Cited by
Sorted by citations
Emerging applications of gene editing technologies for the development of climate-resilient crops
Chavhan, R. L., Jaybhaye, S. G., Hinge, V. R., Deshmukh, A. S., Shaikh, U. S., Jadhav, P. K., Kadam, U. S., & Hong, J. C. (2025) · Frontiers in Genome Editing · doi:10.3389/fgeed.2025.1524767 · Cited by 55
Metadata
- Authors
- Jeon, D., Kim, J.-B., Kang, B.-C., & Kim, C.
- Affiliations
- Chungnam National University (KR)
- Korea Atomic Energy Research Institute (KR)
- Jeonbuk National University (KR)
- Corresponding author
- Kang, Beum-Chang
- Kim, Changsoo
- Venue
- Plants
- Publisher
- MDPI AG
- Published
- 2023-07-13
- Volume
- 12
- Issue
- 14
- Pages
- 2639
- ISSN
- 2223-7747 (ISSN-L)
- PMC
- PMC10384642
- OpenAlex
- W4384341729
- Cited by
- 14
- References
- 66
- Citations by year
- 2026: 3 · 2025: 5 · 2024: 6
- FWCI
- 2.21
- Type
- journal article
- Language
- en
- Open access
- gold
- doi.org
- Licence
- Locations
- Plants (publishedVersion, cc-by)
- PubMed Central (publishedVersion, cc-by)
- PubMed (publishedVersion)
- DOAJ (DOAJ: Directory of Open Access Journals) (submittedVersion, cc-by-sa)
- Funders
- Chungnam National University (2021-1863-01)
- Topics
- Life Sciences › Agricultural and Biological Sciences › Plant Science › Plant Stress Responses and Tolerance
- Life Sciences › Agricultural and Biological Sciences › Plant Science › Plant Genetic and Mutation Studies
- Life Sciences › Agricultural and Biological Sciences › Plant Science › Genetics and Plant Breeding
- Keywords
- sorghum, salt tolerance, salt stress, single nucleotide polymorphisms, non-synonymous SNPs, candidate genes, mutant strain, gamma-ray mutagenesis, comparative transcriptomics, soil salinization
About these checks
Registry, retraction, Cites and statistics results are computed, not judged, with one exception: a printed reference that no index lists is read once by a model before it counts as a citation error. Claims are extracted by a model and kept only when their quote appears verbatim in the text; each cited source is then checked, with a model’s help, for whether it says what the claim relies on. Those verdicts can be wrong — read the claim’s quote and the cited source before relying on one.
Statistics and arithmetic are recomputed, not judged.
Confidence bands are shown only for fields calibrated on our annotated test set. None is calibrated yet, so no band is shown.
What counts as a claim ›How we measure confidence ›How we check this ›
Are you an author, or do you see a problem with this page? Request a review
