

Algorithms based on CWT and classifiers to control cardiac alterations and stress using an ECG and a SCR.
Open accessThe DOI matches its Crossref record; 45 of the 45 references it cites were found in a registry or an index.
Abstract
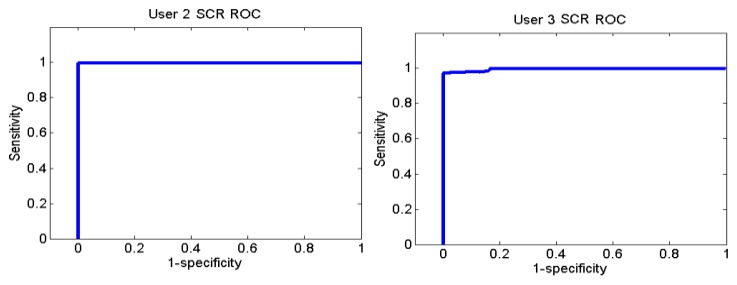
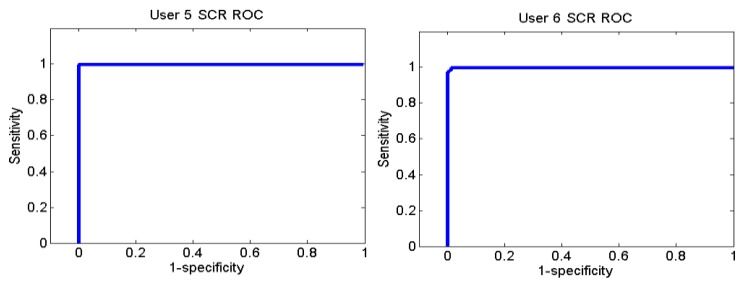
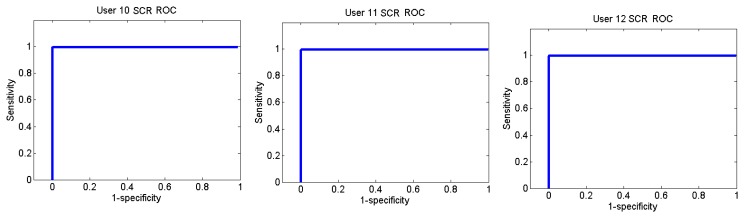
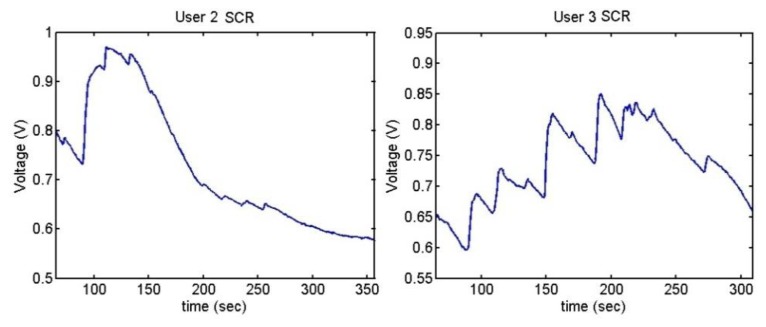
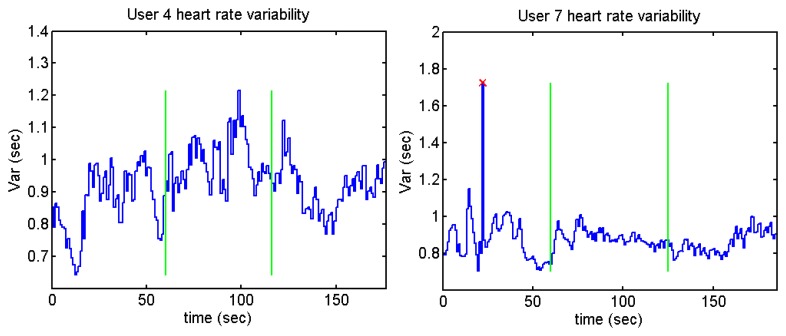
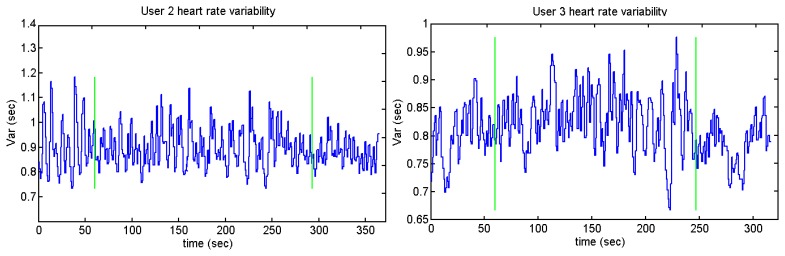
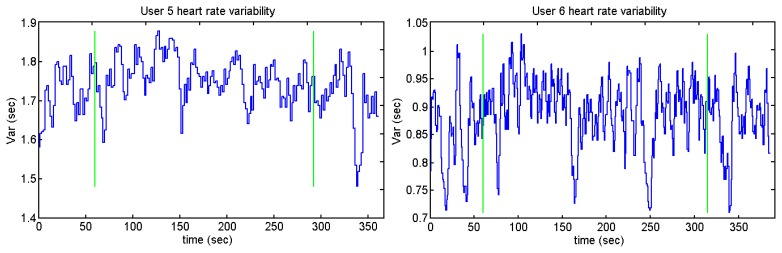
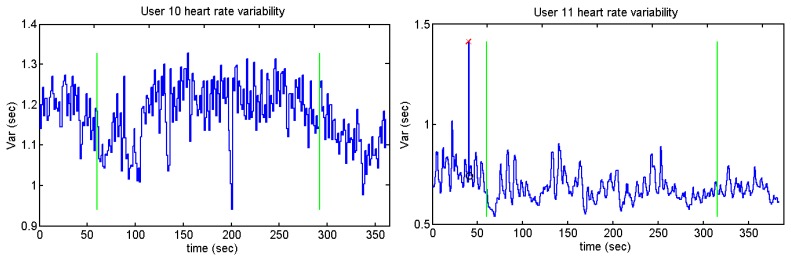
This paper presents the results of using a commercial pulsimeter as an electrocardiogram (ECG) for wireless detection of cardiac alterations and stress levels for home control. For these purposes, signal processing techniques (Continuous Wavelet Transform (CWT) and J48) have been used, respectively. The designed algorithm analyses the ECG signal and is able to detect the heart rate (99.42%), arrhythmia (93.48%) and extrasystoles (99.29%). The detection of stress level is complemented with Skin Conductance Response (SCR), whose success is 94.02%. The heart rate variability does not show added value to the stress detection in this case. With this pulsimeter, it is possible to prevent and detect anomalies for a non-intrusive way associated to a telemedicine system. It is also possible to use it during physical activity due to the fact the CWT minimizes the motion artifacts.
Overview
The claims and statistics of this paper haven’t been checked yet.
Free: it reads the open-access text and checks the first 5 claims that cite a source we can check. Create a free account to check every claim.
Integrity signals
Registry
Cites
Statistics
Figures















Verification
Claims the paper makes
The claims and statistics of this paper haven’t been checked yet.
Free: it reads the open-access text and checks the first 5 claims that cite a source we can check. Create a free account to check every claim.
Claims other papers make about this one
Each is checked against this paper’s own text: does it say what the citing paper says it does?
The cited source says what the claim attributes to it.
In the citing paper
“Specific algorithms like continuous wavelet transformation minimizes motion artifact (Villarejo et al., 2013), however, this only addresses one aspect of the issue because concerns related to interpretation of the data remain (Malik, 1996).”
From Heart Rate Variability and Cardiac Vagal Tone in Psychophysiological Research – Recommendations for Experiment Planning, Data Analysis, and Data Reporting (2017) · cites this paper as Villarejo et al., 2013
Self-check
Percentages, sums and reported differences re-computed from the paper’s own numbers.
The self-check needs the paper’s full text.
Citations
Cites
Detecting Stress During Real-World Driving Tasks Using Physiological Sensors
Healey, J. A., & Picard, R. W. (2005) · IEEE Transactions on Intelligent Transportation Systems · doi:10.1109/tits.2005.848368 · Cited by 2,207 · cited 1×
“In [31] Healey and Picard describe methods of detecting stress levels in drivers with an accuracy of 90% by recording ECG, electromyogram (EMG), skin response and breathing rate (BR).”
MethodThe principles of software QRS detection
Kohler, B.-U., Hennig, C., & Orglmeister, R. (2002) · IEEE Engineering in Medicine and Biology Magazine · doi:10.1109/51.993193 · Cited by 1,242 · cited 1×
“In [21], Koheler et al. reviewed and compared different algorithms to detect the QRS complex.”
The use of the Hilbert transform in ECG signal analysis
Benitez, D., Gaydecki, P. A., Zaidi, A., & Fitzpatrick, A. P. (2001) · Computers in Biology and Medicine · doi:10.1016/s0010-4825(01)00009-9 · Cited by 489 · cited 1×
“In [22], Benitez et al. describe an algorithm based on the Hilbert transform which differentiates the R wave, the T peak and the P wave with an average of 99.87% sensitivity while minimising the motion artefacts.”
MethodInfluentialSmart Vest: Wearable multi-parameter remote physiological monitoring system
Pandian, P. S., Mohanavelu, K., Safeer, K. P., Kotresh, T. M., Shakunthala, D. T., Gopal, P., & Padaki, V. C. (2008) · Medical Engineering & Physics · doi:10.1016/j.medengphy.2007.05.014 · Cited by 423 · cited 1×
“There are other wearable systems which acquire more data such as [19]: they use one shirt which measures ECG, PPG, BP, temperature, GSR and HR.”
BackgroundWireless sensor network based wearable smart shirt for ubiquitous health and activity monitoring
Lee, Y.-D., & Chung, W.-Y. (2009) · Sensors and Actuators B: Chemical · doi:10.1016/j.snb.2009.04.040 · Cited by 382 · cited 1×
“In [17] a shirt which combines an ECG and an accelerometer is presented.”
BackgroundUltra short term analysis of heart rate variability for monitoring mental stress in mobile settings.
Salahuddin, L., Cho, J., Jeong, M. G., & Kim, D. (2007) · 2007 29th Annual International Conference of the IEEE Engineering in Medicine and Biology Society · doi:10.1109/iembs.2007.4353378 · Cited by 374 · cited 1×
“This test has been used in different studies to induce stress in people [11,12].”
MethodStress monitoring using a distributed wireless intelligent sensor system
Jovanov, E., O'Donnell Lords, A., Raskovic, D., Cox, P. G., Adhami, R., & Andrasik, F. (2003) · IEEE Engineering in Medicine and Biology Magazine · doi:10.1109/memb.2003.1213626 · Cited by 373 · cited 1×
“The heart rate variability (HRV) is acquired in [33] to detect stress parameters.”
BackgroundA Stress Sensor Based on Galvanic Skin Response (GSR) Controlled by ZigBee
Villarejo, M. V., Zapirain, B. G., & Zorrilla, A. M. (2012) · Sensors · doi:10.3390/s120506075 · Cited by 315 · cited 1×
“The different components of the device can be seen in [39].”
BackgroundSelf-citationAbstract Harmonic Analysis of Continuous Wavelet Transforms
Führ, H. (2005) · Lecture Notes in Mathematics · doi:10.1007/b104912 · Cited by 274 · cited 1×
“In this case, the signals to analyse have been given by the ECG and the method used to analyse them is the Continuous Wavelet Transform (CWT) [9].”
MethodBury, M. R. (2005) · Medical Entomology and Zoology · Cited by 243
Research works printed but not linked: 1
- Steptoe, A., and Ayers, S. (2005). The SAGE Handbook of Health Psychology, SAGE Publication. Chapter 7.
Cited by
Laborde, S., Mosley, E., & Thayer, J. F. (2017) · Frontiers in Psychology · doi:10.3389/fpsyg.2017.00213 · Cited by 2,336
“Specific algorithms like continuous wavelet transformation minimizes motion artifact (Villarejo et al., 2013), however, this only addresses one aspect of the issue because concerns related to interpretation of the data remain (Malik, 1996).”
BackgroundMohammed, M. A., Abdulkareem, K. H., Al-Waisy, A. S., Mostafa, S. A., Al-Fahdawi, S., Dinar, A. M., Alhakami, W., Baz, A., Al-Mhiqani, M. N., Alhakami, H., et al. (2020) · IEEE Access · doi:10.1109/access.2020.2995597 · Cited by 193
“Medical professionals facing a big challenge when making decisions of using the computer-decision support system [6], [11] to provide a reliable solution which helps them investigate a particular sophisticated disease such as COVID-19 [2].”
BackgroundSoon, S., Svavarsdottir, H. S., Downey, C. L., & Jayne, D. G. (2020) · BMJ Innovations · doi:10.1136/bmjinnov-2019-000354 · Cited by 151
A scoping review of heart rate variability in sport and exercise psychology
Mosley, E., & Laborde, S. (2022) · International Review of Sport and Exercise Psychology · doi:10.1080/1750984x.2022.2092884 · Cited by 96
Resting high frequency heart rate variability selectively predicts cooperative behavior
Beffara, B., Bret, A., Vermeulen, N., & Mermillod, M. (2016) · Physiology & Behavior · doi:10.1016/j.physbeh.2016.06.011 · Cited by 67
Metadata
- Authors
- Villarejo, M., Zapirain, B., & Zorrilla, A.
- Affiliations
- Universidad de Deusto (ES)
- DeustoTech-Life Unit, DeustoTech Institute of Technology, University of Deusto, 48007 Bilbao, Spain
- Corresponding author
- Zorrilla, Amaia
- Venue
- Sensors
- Publisher
- MDPI AG
- Published
- 2013-05-10
- Volume
- 13
- Issue
- 5
- Pages
- 6141-6170
- ISSN
- 1424-8220 (ISSN-L)
- PMC
- PMC3690048
- OpenAlex
- W1985714831
- Cited by
- 20
- References
- 45
- Citations by year
- 2024: 1 · 2023: 1 · 2022: 1 · 2021: 2 · 2020: 4 · 2019: 1 · 2018: 1 · 2017: 1 · 2016: 5 · 2015: 3
- FWCI
- 1.81
- Type
- journal article
- Language
- en
- Open access
- gold
- doi.org
- Licence
- Locations
- Sensors (publishedVersion, cc-by)
- Europe PMC (PubMed Central) (publishedVersion, cc-by)
- PubMed Central (publishedVersion, cc-by)
- PubMed (publishedVersion)
- DOAJ (DOAJ: Directory of Open Access Journals) (submittedVersion, cc-by-sa)
- Funders
- Eusko Jaurlaritza
- Topics
- Health Sciences › Medicine › Cardiology and Cardiovascular Medicine › ECG Monitoring and Analysis
- Physical Sciences › Engineering › Biomedical Engineering › Non-Invasive Vital Sign Monitoring
- Health Sciences › Medicine › Cardiology and Cardiovascular Medicine › Heart Rate Variability and Autonomic Control
- Keywords
- arrhythmia detection, heartbeat detection, stress detection, skin conductance response, electrocardiogram, continuous wavelet transform, J48 classifier, wireless physiological monitoring, telemedicine, motion artifact reduction, home health monitoring
- MeSH terms
- Adult, Algorithms, Electricity, Electrocardiography, Female, Galvanic Skin Response, Heart, Heart Rate, Humans, Male, Monitoring, Physiologic, ROC Curve, Stress, Physiological, Young Adult, Stroop Test, Wavelet Analysis
About these checks
Registry, retraction, Cites and statistics results are computed, not judged, with one exception: a printed reference that no index lists is read once by a model before it counts as a citation error. Claims are extracted by a model and kept only when their quote appears verbatim in the text; each cited source is then checked, with a model’s help, for whether it says what the claim relies on. Those verdicts can be wrong — read the claim’s quote and the cited source before relying on one.
Statistics and arithmetic are recomputed, not judged.
Confidence bands are shown only for fields calibrated on our annotated test set. None is calibrated yet, so no band is shown.
What counts as a claim ›How we measure confidence ›How we check this ›
Are you an author, or do you see a problem with this page? Request a review
How to cite
Cite CoChat for the checks on this page, and the paper for its own findings.
- This page
- CoChat. (2026). Citation check: Algorithms based on CWT and classifiers to control cardiac alterations and stress using an ECG and a SCR. https://app.cochat.ai/papers/10.3390/s130506141
- The paper
- Villarejo, M., Zapirain, B., & Zorrilla, A. (2013). Algorithms based on CWT and classifiers to control cardiac alterations and stress using an ECG and a SCR. Sensors. https://doi.org/10.3390/s130506141
Data sources
Bibliographic data: Semantic Scholar, OpenAlex, Crossref.
Contains information from the Semantic Scholar Academic Graph Datasets, made available under the ODC Attribution License (ODC-BY 1.0).
Semantic Scholar’s data is described in: Kinney, R., et al. (2023). The Semantic Scholar Open Data Platform. arXiv:2301.10140.
