

The DOI matches its Crossref record; 52 of the 52 references it cites were found in a registry or an index.
Dealing with the Effects of Sensor Displacement in Wearable Activity Recognition
Open accessAbstract
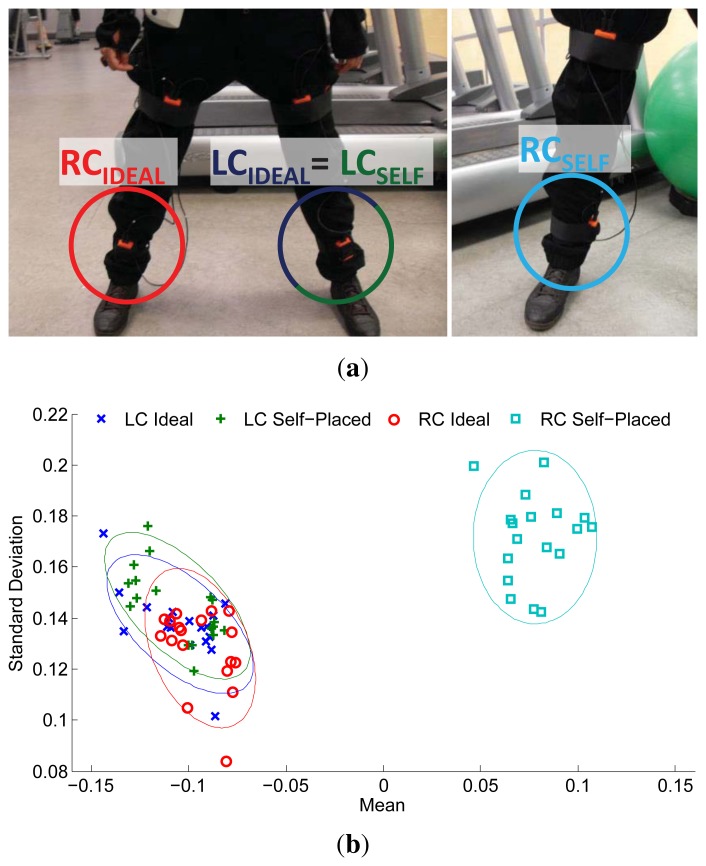
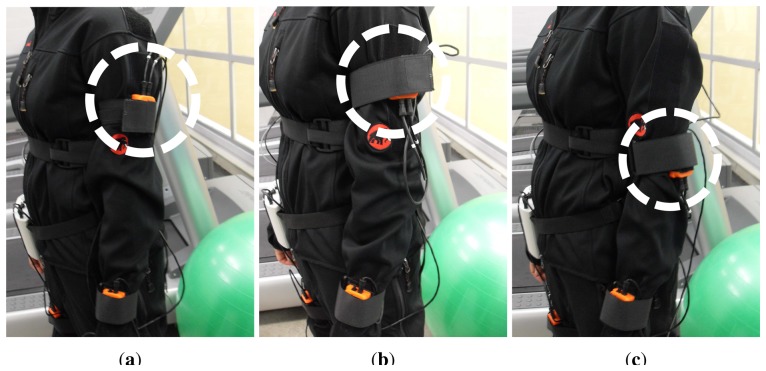
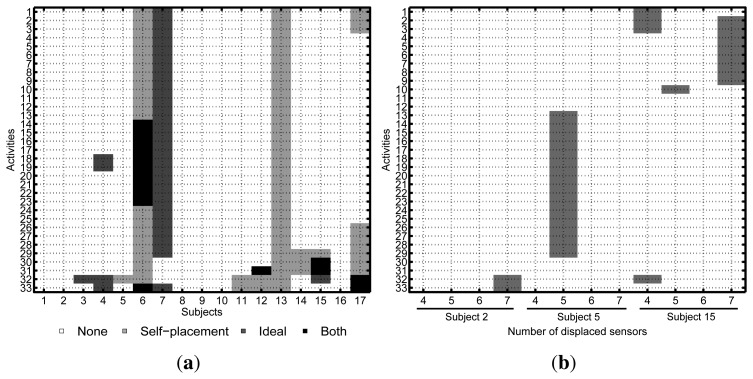
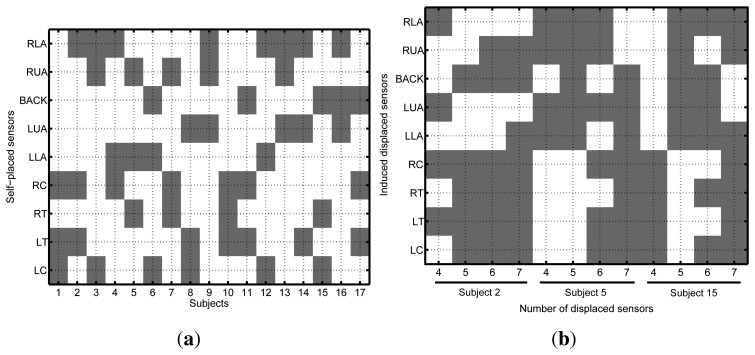
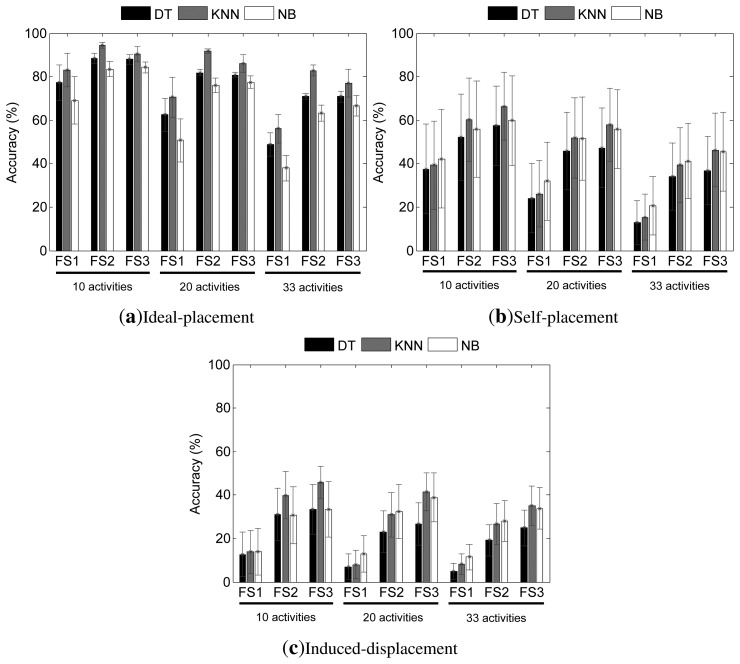
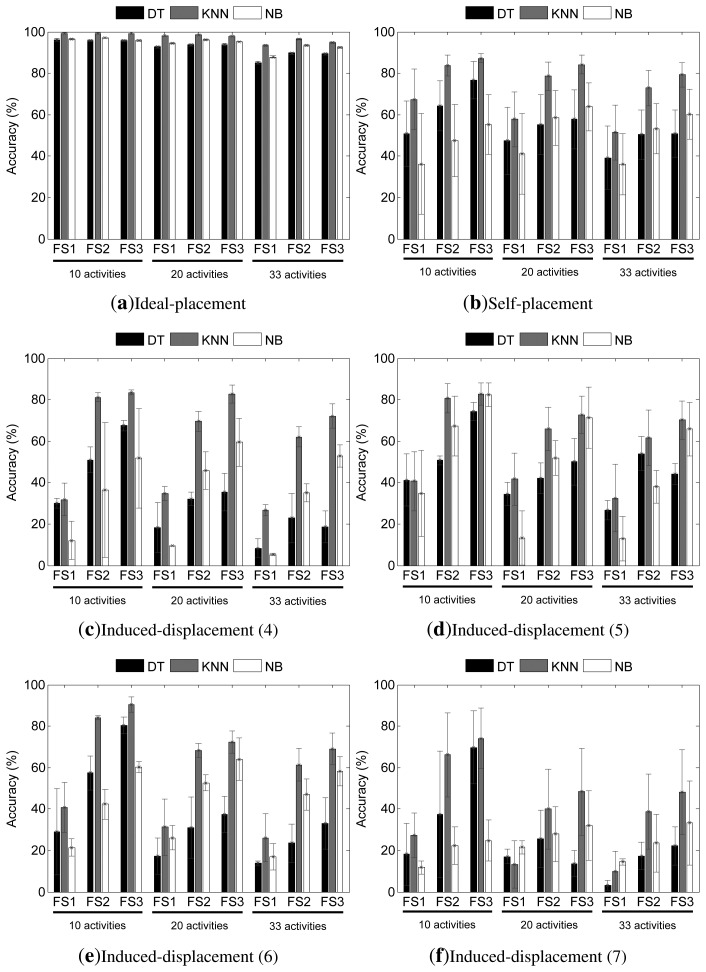
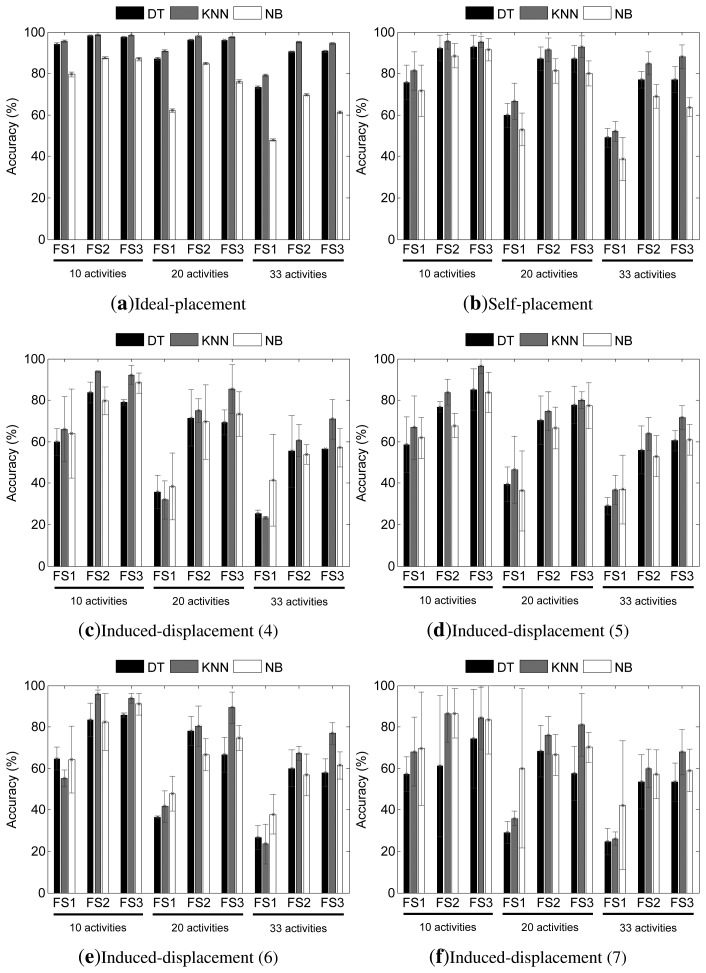
Most wearable activity recognition systems assume a predefined sensor deployment that remains unchanged during runtime. However, this assumption does not reflect real-life conditions. During the normal use of such systems, users may place the sensors in a position different from the predefined sensor placement. Also, sensors may move from their original location to a different one, due to a loose attachment. Activity recognition systems trained on activity patterns characteristic of a given sensor deployment may likely fail due to sensor displacements. In this work, we innovatively explore the effects of sensor displacement induced by both the intentional misplacement of sensors and self-placement by the user. The effects of sensor displacement are analyzed for standard activity recognition techniques, as well as for an alternate robust sensor fusion method proposed in a previous work. While classical recognition models show little tolerance to sensor displacement, the proposed method is proven to have notable capabilities to assimilate the changes introduced in the sensor position due to self-placement and provides considerable improvements for large misplacements.
Overview
The claims and statistics of this paper haven’t been checked yet.
Run the check — free, no account needed. It reads the open-access text and checks the sources it cites.
Integrity signals
Registry
Cites
Statistics
Figures
Verification
Claims the paper makes
The claims and statistics of this paper haven’t been checked yet.
Run the check — free, no account needed. It reads the open-access text and checks the sources it cites.
Claims other papers make about this one
Each is checked against this paper’s own text: does it say what the citing paper says it does?
In the citing paper
“This dataset includes recordings from 17 subjects performing 33 different activities in three different scenarios.”
From Feature extraction for robust physical activity recognition (2017) · cites this paper as [24]
In the citing paper
“This dataset includes recordings from 17 subjects, seven females and ten males, with ages ranging from 22 to 37 years old.”
From Feature extraction for robust physical activity recognition (2017) · cites this paper as [24]
In the citing paper
“The dataset includes recordings in three placement scenarios:”
From Feature extraction for robust physical activity recognition (2017) · cites this paper as [24]
In the citing paper
“The most significant characteristic of this dataset is the introduction of sensor displacement, such as rotation and mis-positioning from the corresponding body part.”
From Feature extraction for robust physical activity recognition (2017) · cites this paper as [24]
In the citing paper
“The experiment consisted in performing a complete set of exercises: 33 physical activities, including warm up, fitness and cool down activities (walking, jogging, cycling, jumping, etc.).”
From Feature extraction for robust physical activity recognition (2017) · cites this paper as [24]
In the citing paper
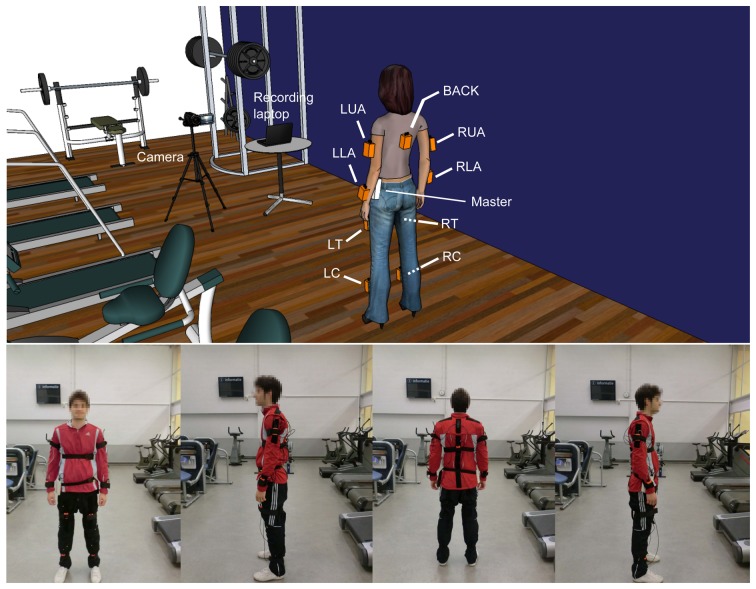
“These recording include 13 inertial signals obtained from 9 on-body inertial measurement units located on different body parts.”
From Feature extraction for robust physical activity recognition (2017) · cites this paper as [24]
In the citing paper
“Using these sensors, a 3D (3-dimension) linear acceleration, a 3D angular velocity, a 3D magnetic field orientation and a 4D quaternions are sampled every 20 ms (50 Hz sample-rate).”
From Feature extraction for robust physical activity recognition (2017) · cites this paper as [24]
In the citing paper
“This dataset also includes a Null-activity.This label has been assigned to other activities (different from the 33 activities considered in this study), and also, the transitions between activities.”
From Feature extraction for robust physical activity recognition (2017) · cites this paper as [24]
In the citing paper
“When comparing these results to the original paper, there is a big improvement (more than 10%, from 88.4 to 98.9%) in the self-placement scenario.”
From Feature extraction for robust physical activity recognition (2017) · cites this paper as [24]
In the citing paper
“After introducing the signal normalization method and considering all sensors, the system accuracy goes to 99.4%, a 2.4% improvement compared to the original paper (97%).”
From Feature extraction for robust physical activity recognition (2017) · cites this paper as [24]
In the citing paper
“Regarding the self-placement scenario, this table shows 8.6% accuracy drop compared to the ideal-placement in the original paper (from 97.0 to 88.4%), but with our system, this reduction is lower than 0.5% (from 99.1 to 98.9%).”
From Feature extraction for robust physical activity recognition (2017) · cites this paper as [24]
In the citing paper
“It is important to notice that, in the original paper, the evaluation method was random-partitioning and, based on the results presented in”
From Feature extraction for robust physical activity recognition (2017) · cites this paper as [24]
In the citing paper
“our system still maintains a high performance when the Null-activity is included: the system only loses 0.3% accuracy (from 99.4 to 99.1%) showing a significant improvement (2.1%) respect to the baseline system (97%).”
From Feature extraction for robust physical activity recognition (2017) · cites this paper as [24]
In the citing paper
“Final results have exhibited that the proposed system largely improves the performance compared to previous works on the same dataset [24].”
From Feature extraction for robust physical activity recognition (2017) · cites this paper as [24]
Self-check
Percentages, sums and reported differences re-computed from the paper’s own numbers.
The self-check needs the paper’s full text.
Citations
Cites
Nearest neighbor pattern classification
Cover, T., & Hart, P. (1967) · IEEE Transactions on Information Theory · doi:10.1109/tit.1967.1053964 · Cited by 16,936
Activity Recognition from User-Annotated Acceleration Data
Bao, L., & Intille, S. S. (2004) · Lecture Notes in Computer Science · doi:10.1007/978-3-540-24646-6_1 · Cited by 3,147
Activity recognition using cell phone accelerometers
Kwapisz, J. R., Weiss, G. M., & Moore, S. A. (2011) · ACM SIGKDD Explorations Newsletter · doi:10.1145/1964897.1964918 · Cited by 2,912 · cited 1×
“These are features widely used in activity recognition [23,38,52–54] for their discrimination potential and ease of interpretation in the acceleration domain.”
BackgroundA Survey on Human Activity Recognition using Wearable Sensors
Lara, O. D., & Labrador, M. A. (2013) · IEEE Communications Surveys & Tutorials · doi:10.1109/surv.2012.110112.00192 · Cited by 2,662
Activity recognition from accelerometer data
Ravi, N., Dandekar, N., Mysore, P., & Littman, M. L. (2005) · Cited by 1,422
Mathie, M. J., Coster, A. C. F., Lovell, N. H., & Celler, B. G. (2004) · Physiological Measurement · doi:10.1088/0967-3334/25/2/r01 · Cited by 828
Najafi, B., Aminian, K., Paraschiv-Ionescu, A., Loew, F., Büla, C., & Robert, P. A. (2003) · IEEE Transactions on Biomedical Engineering · doi:10.1109/tbme.2003.812189 · Cited by 760
Covariate Shift Adaptation by Importance Weighted Cross Validation
Sugiyama, M., Krauledat, M., & Müller, K. (2007) · doi:10.5555/1314498.1390324 · Cited by 733
Ermes, M., Pärkkä, J., Mäntyjärvi, J., & Korhonen, I. (2008) · IEEE Transactions on Information Technology in Biomedicine · doi:10.1109/titb.2007.899496 · Cited by 707
Window Size Impact in Human Activity Recognition
Baños, O., Gálvez, J. M., Damas, M., Pomares, H., & Rojas, I. (2014) · Sensors · doi:10.3390/s140406474 · Cited by 699
Self-citation
Research works printed but not linked: 2
- Duda, R.O., Hart, P.E., and Stork, D.G. (2000). Pattern Classification, Wiley-Interscience. [2nd ed].
- Theodoridis, S., and Koutroumbas, K. (2008). Pattern Recognition, Academic Press. [4th ed].
Cited by
Sorted by citations
Nweke, H. F., Wah, T. Y., Mujtaba, G., & Al-Garadi, M. A. (2018) · Information Fusion · doi:10.1016/j.inffus.2018.06.002 · Cited by 408
Banos, O., Villalonga, C., Garcia, R., Saez, A., Damas, M., Holgado-Terriza, J. A., Lee, S., Pomares, H., & Rojas, I. (2015) · BioMedical Engineering OnLine · doi:10.1186/1475-925x-14-s2-s6 · Cited by 321
Self-citationA Survey on Deep Learning for Human Activity Recognition
Gu, F., Chung, M.-H., Chignell, M., Valaee, S., Zhou, B., & Liu, X. (2021) · ACM Computing Surveys · doi:10.1145/3472290 · Cited by 301
Reliable recognition of lying, sitting, and standing with a hip‐worn accelerometer
Vähä‐Ypyä, H., Husu, P., Suni, J. H., Vasankari, T. J., & Sievänen, H. T. (2017) · Scandinavian Journal of Medicine and Science in Sports · doi:10.1111/sms.13017 · Cited by 161
UTiLearn: A Personalised Ubiquitous Teaching and Learning System for Smart Societies
Mehmood, R., Alam, F., Albogami, N., Katib, I. A., Albeshri, A. A., & Altowaijri, S. M. (2017) · IEEE Access · doi:10.1109/access.2017.2668840 · Cited by 151
Wearable Medical Sensor-Based System Design: A Survey
Mosenia, A., Sur‐Kolay, S., Raghunathan, A., & Jha, N. K. (2017) · IEEE Transactions on Multi-Scale Computing Systems · doi:10.1109/tmscs.2017.2675888 · Cited by 143
Body Sensor Networks: In the Era of Big Data and Beyond
Poon, C. C. Y., Lo, B. P. L., Yuce, M. R., Alomainy, A., & Hao, Y. (2015) · IEEE Reviews in Biomedical Engineering · doi:10.1109/rbme.2015.2427254 · Cited by 135
Human activity recognition using machine learning methods in a smart healthcare environment
Subaşı, A., Khateeb, K., Brahimi, T., & Sarirete, A. (2019) · Elsevier eBooks · doi:10.1016/b978-0-12-819043-2.00005-8 · Cited by 139
Tong, X., Su, Y., Li, Z., Si, C., Han, G., Ning, J., & Yang, F. (2019) · IEEE Transactions on Industrial Electronics · doi:10.1109/tie.2019.2897550 · Cited by 104
Baños, O., Villalonga, C., Damas, M., Glösekötter, P., Pomares, H., & Rojas, I. (2014) · The Scientific World JOURNAL · doi:10.1155/2014/490824 · Cited by 98
Self-citationLARa: Creating a Dataset for Human Activity Recognition in Logistics Using Semantic Attributes
Niemann, F., Reining, C., Rueda, F. M., Nair, N. R., Steffens, J. A., Fink, G. A., & ten Hompel, M. (2020) · Sensors · doi:10.3390/s20154083 · Cited by 99
Sensor Based Human Activity Recognition Using Adaboost Ensemble Classifier
Subaşı, A., Dammas, D. H., Alghamdi, R. D., Makawi, R. A., Albiety, E. A., Brahimi, T., & Sarirete, A. (2018) · Procedia Computer Science · doi:10.1016/j.procs.2018.10.298 · Cited by 84
A general framework for sensor-based human activity recognition
Köping, L., Shirahama, K., & Grzegorzek, M. (2018) · Computers in Biology and Medicine · doi:10.1016/j.compbiomed.2017.12.025 · Cited by 89
Fast classification of univariate and multivariate time series through shapelet discovery
Grabocka, J., Wistuba, M., & Schmidt-Thieme, L. (2015) · Knowledge and Information Systems · doi:10.1007/s10115-015-0905-9 · Cited by 69
Feature extraction for robust physical activity recognition
Zhu, J., San-Segundo, R., & Pardo, J. M. (2017) · Human-centric Computing and Information Sciences · doi:10.1186/s13673-017-0097-2 · Cited by 68
Multi-sensor fusion based on multiple classifier systems for human activity identification
Nweke, H. F., Wah, T. Y., Mujtaba, G., Alo, U. R., & Al-Garadi, M. A. (2019) · Human-centric Computing and Information Sciences · doi:10.1186/s13673-019-0194-5 · Cited by 67
Activity Recognition Invariant to Sensor Orientation with Wearable Motion Sensors
Yurtman, A., & Barshan, B. (2017) · Sensors · doi:10.3390/s17081838 · Cited by 66
A perspective on human activity recognition from inertial motion data
Gomaa, W. E., & Khamis, M. A. (2023) · Neural Computing and Applications · doi:10.1007/s00521-023-08863-9 · Cited by 64
Influence of IMU position and orientation placement errors on ground reaction force estimation
Tan, T., Chiasson, D., Hu, H., & Shull, P. B. (2019) · Journal of Biomechanics · doi:10.1016/j.jbiomech.2019.109416 · Cited by 57
Human Work and Status Evaluation Based on Wearable Sensors in Human Factors and Ergonomics: A Review
Tsao, L., Li, L., & Liang Ma, A. (2018) · IEEE Transactions on Human-Machine Systems · doi:10.1109/thms.2018.2878824 · Cited by 48
Human activity recognition: A comprehensive review
Kaur, H., Rani, V., & Kumar, M. (2024) · Expert Systems · doi:10.1111/exsy.13680 · Cited by 56
Meng, L., Zhang, A., Chen, C., Wang, X., Jiang, X., Tao, L., Fan, J., Wu, X., Dai, C., Zhang, Y., et al. (2021) · Sensors · doi:10.3390/s21030799 · Cited by 45
Barshan, B., & Yurtman, A. (2020) · IEEE Internet of Things Journal · doi:10.1109/jiot.2020.2969840 · Cited by 42
Respiration Disorders Classification With Informative Features for m-Health Applications
Fekr, A. R., Janidarmian, M., Radecka, K., & Žilić, Ž. (2015) · IEEE Journal of Biomedical and Health Informatics · doi:10.1109/jbhi.2015.2458965 · Cited by 42
mDurance: A Novel Mobile Health System to Support Trunk Endurance Assessment
Baños, O., Moral-Muñoz, J. A., Diaz-Reyes, I., Arroyo‐Morales, M., Damas, M., Herrera‐Viedma, E., Hong, C. S., Lee, S., Pomares, H., Rojas, I., et al. (2015) · Sensors · doi:10.3390/s150613159 · Cited by 41
Self-citationMIMU-Wear: Ontology-based sensor selection for real-world wearable activity recognition
Villalonga, C., Pomares, H., Rojas, I., & Baños, O. (2017) · Neurocomputing · doi:10.1016/j.neucom.2016.09.125 · Cited by 40
Self-citationLiang, W., Wang, F., Fan, A., Zhao, W., Yao, W., & Yang, P. (2023) · Sensors · doi:10.3390/s23094229 · Cited by 48
Sensor-Based Gym Physical Exercise Recognition: Data Acquisition and Experiments
Hussain, A., Zafar, K., Baig, A. R., Almakki, R. S., AlSuwaidan, L., & Khan, S. (2022) · Sensors · doi:10.3390/s22072489 · Cited by 39
Deep Learning for Human Activity Recognition
San, P. P., Kakar, P., Li, X., Krishnaswamy, S. P., Yang, J.-B., & Nguyen, M. N. (2017) · Elsevier eBooks · doi:10.1016/b978-0-12-809393-1.00009-x · Cited by 34
Strączkiewicz, M., Glynn, N. W., & Harezlak, J. (2019) · Sensors · doi:10.3390/s19092095 · Cited by 36
Development of an IMU-based foot-ground contact detection (FGCD) algorithm
Kim, M., & Lee, D. (2016) · Ergonomics · doi:10.1080/00140139.2016.1174314 · Cited by 32
Pires, I. M., García, N. M., Pombo, N. G. C. C., Flórez‐Revuelta, F., & Spinsante, S. (2018) · Sensors · doi:10.3390/s18020640 · Cited by 32
Yatbaz, H. Y., Ever, E., & Yazıcı, A. (2021) · IEEE Sensors Journal · doi:10.1109/jsen.2021.3061458 · Cited by 32
Matrix and Tensor Completion on a Human Activity Recognition Framework
Savvaki, S., Tsagkatakis, G., Πανουσοπούλου, Α., & Tsakalides, P. (2017) · IEEE Journal of Biomedical and Health Informatics · doi:10.1109/jbhi.2017.2716112 · Cited by 31
Detecting and Correcting IMU Movements During Joint Angle Estimation
Yi, C., Rho, S., Wei, B., Yang, C., Ding, Z., Chen, Z., & Jiang, F. (2022) · IEEE Transactions on Instrumentation and Measurement · doi:10.1109/tim.2022.3167771 · Cited by 29
Yoshimura, N., Maekawa, T., Hara, T., Wada, A., & Namioka, Y. (2022) · Proceedings of the ACM on Interactive Mobile Wearable and Ubiquitous Technologies · doi:10.1145/3534572 · Cited by 30
An LSTM-based Descriptor for Human Activities Recognition using IMU Sensors
Ashry, S., Elbasiony, R. M., & Gomaa, W. E. (2018) · International Conference on Informatics in Control, Automation and Robotics (ICINCO) · doi:10.5220/0006902404940501 · Cited by 28
Multi-sensor Fusion Based on Asymmetric Decision Weighting for Robust Activity Recognition
Baños, O., Damas, M., Guillén, A., Herrera, L. J., Pomares, H., Rojas, I., & Villalonga, C. (2014) · Neural Processing Letters · doi:10.1007/s11063-014-9395-0 · Cited by 27
Self-citationDetermining the optimal number of body-worn sensors for human activity recognition
Ertuğrul, Ö. F., & Kaya, Y. (2016) · Soft Computing · doi:10.1007/s00500-016-2100-7 · Cited by 27
Yurtman, A., Barshan, B., & Fi̇dan, B. (2018) · Sensors · doi:10.3390/s18082725 · Cited by 28
Segmentation of shoulder rehabilitation exercises for single and multiple inertial sensor systems
Brennan, L. K., Bevilacqua, A., Kechadi, T., & Caulfield, B. (2020) · Journal of Rehabilitation and Assistive Technologies Engineering · doi:10.1177/2055668320915377 · Cited by 26
Alinia, P., Saeedi, R., Fallahzadeh, R., Rokni, A., & Ghasemzadeh, H. G. (2016) · IEEE Journal of Selected Topics in Signal Processing · doi:10.1109/jstsp.2016.2569472 · Cited by 25
PAMS: A new position-aware multi-sensor dataset for human activity recognition using smartphones
Esfahani, P., & Malazi, H. T. (2017) · CSI International Symposium on Computer Architecture and Digital Systems (CADS) · doi:10.1109/cads.2017.8310680 · Cited by 24
Hur, T., Bang, J., Kim, D., Baños, O., & Lee, S. (2017) · Sensors · doi:10.3390/s17040931 · Cited by 23
Patient-centric on-body sensor localization in smart health systems
Saeedi, R., Amini, N., & Ghasemzadeh, H. G. (2014) · Asilomar Conference on Signals, Systems and Computers (ACSSC) · doi:10.1109/acssc.2014.7094840 · Cited by 23
Collection of a Diverse, Realistic and Annotated Dataset for Wearable Activity Recognition
Cleland, I., Donnelly, M. P., Nugent, C., Hallberg, J., Espinilla, M., & García-Constantino, M. (2018) · IEEE International Conference on Pervasive Computing and Communications Workshops (PerCom Workshops) · doi:10.1109/percomw.2018.8480322 · Cited by 22
Derungs, A., & Amft, O. (2020) · Scientific Reports · doi:10.1038/s41598-020-68225-6 · Cited by 23
Impact of sensor misplacement on estimating metabolic equivalent of task with wearables
Alinia, P., Saeedi, R., Mortazavi, B. J., Rokni, A., & Ghasemzadeh, H. G. (2015) · Wearable and Implantable Body Sensor Networks · doi:10.1109/bsn.2015.7299385 · Cited by 21
Zheng, Z., Ma, H., Yan, W., Liu, H., & Yang, Z. (2021) · Entropy · doi:10.3390/e23050588 · Cited by 21
Multiwindow Fusion for Wearable Activity Recognition
Baños, O., Gálvez, J. M., Damas, M., Guillén, A., Herrera, L. J., Pomares, H., Rojas, I., Villalonga, C., Hong, C. S., & Lee, S. (2015) · Lecture notes in computer science · doi:10.1007/978-3-319-19222-2_24 · Cited by 21
Self-citationHandling Missing Sensors in Topology-Aware IoT Applications with Gated Graph Neural Network
Liu, S., Yao, S., Huang, Y., Liu, D., Shao, H., Zhao, Y., Li, J., Wang, T., Wang, R., Yang, C., et al. (2020) · Proceedings of the ACM on Interactive, Mobile, Wearable and Ubiquitous Technologies · doi:10.1145/3411818 · Cited by 20
On-Body Sensor Positions Hierarchical Classification
Sang, V. N. T., Yano, S., & Kondo, T. (2018) · Sensors · doi:10.3390/s18113612 · Cited by 20
Gait-based identification using wearable multimodal sensing and attention neural networks
Yi, S., Mei, Z., Ivanov, K., Mei, Z., He, T., & Zeng, H. (2024) · Sensors and Actuators A Physical · doi:10.1016/j.sna.2024.115478 · Cited by 19
A framework for unsupervised change detection in activity recognition
Bashir, S. A., Petrovski, A., & Doolan, D. C. (2017) · International Journal of Pervasive Computing and Communications · doi:10.1108/ijpcc-03-2017-0027 · Cited by 18
Sepahvand, M., & Abdali-Mohammadi, F. (2018) · IEEE Sensors Journal · doi:10.1109/jsen.2018.2877360 · Cited by 17
Sepahvand, M., & Abdali-Mohammadi, F. (2021) · Expert Systems with Applications · doi:10.1016/j.eswa.2021.115624 · Cited by 18
Alam, M. A. U., Roy, N., Gangopadhyay, A., & Galik, E. M. (2016) · Pervasive and Mobile Computing · doi:10.1016/j.pmcj.2016.06.015 · Cited by 17
Augmented Adversarial Learning for Human Activity Recognition with Partial Sensor Sets
Kang, H., Huang, Q., & Zhang, Q. (2022) · Proceedings of the ACM on Interactive, Mobile, Wearable and Ubiquitous Technologies · doi:10.1145/3550285 · Cited by 16
Chen, X., Jiang, X. F., Fang, J., Guo, S., Lin, J., Liao, M., Luo, G., & Fu, H. (2023) · Proceedings of the ACM on Interactive Mobile Wearable and Ubiquitous Technologies · doi:10.1145/3580832 · Cited by 18
Ubiquitous smart learning system for smart cities
Elhoseny, H., Elhoseny, M., Abdelrazek, S. M., Riad, A. M., & Hassanien, A. E. (2017) · International Conference on Intelligent Computing and Information Systems (ICICIS) · doi:10.1109/intelcis.2017.8260058 · Cited by 15
A Signal-Level Transfer Learning Framework for Autonomous Reconfiguration of Wearable Systems
Saeedi, R., & Gebremedhin, A. H. (2018) · IEEE Transactions on Mobile Computing · doi:10.1109/tmc.2018.2878673 · Cited by 15
Opportunistic Activity Recognition in IoT Sensor Ecosystems via Multimodal Transfer Learning
Baños, O., Calatroni, A., Damas, M., Pomares, H., Roggen, D., Rojas, I., & Villalonga, C. (2021) · Neural Processing Letters · doi:10.1007/s11063-021-10468-z · Cited by 15
Self-citationPost-stroke hand gesture recognition via one-shot transfer learning using prototypical networks
Sarwat, H., Alkhashab, A., Song, X., Jiang, S., Jia, J., & Shull, P. B. (2024) · Journal of NeuroEngineering and Rehabilitation · doi:10.1186/s12984-024-01398-7 · Cited by 14
A dataset for activity recognition in an unmodified kitchen using smart-watch accelerometers
Mohammad, Y. F. O., Matsumoto, K., & Hoashi, K. (2017) · International Conference on Mobile and Ubiquitous Multimedia (MUM) · doi:10.1145/3152832.3152844 · Cited by 14
Human Behaviour Analysis through Smartphones
Konsolakis, K., Hermens, H. J., Villalonga, C., Vollenbroek-Hutten, M. M. R., & Baños, O. (2018) · International Conference on Ubiquitous Computing and Ambient Intelligence (UCAmI) · doi:10.3390/proceedings2191243 · Cited by 13
Human Activity Recognition: A Dynamic Inductive Bias Selection Perspective
Hamidi, M., & Osmani, A. (2021) · Sensors · doi:10.3390/s21217278 · Cited by 13
Shen, Z., Li, J., Hu, H., Du, C., Ding, X., Pan, T., & Yu, X. (2025) · AI Sensors · doi:10.3390/aisens1020008 · Cited by 12
Multimodal video and IMU kinematic dataset on daily life activities using affordable devices
Martínez‐Zarzuela, M., González-Alonso, J., Antón‐Rodríguez, M., Pernas, F. J. D., Müller, H., & Simón-Martínez, C. (2023) · Scientific Data · doi:10.1038/s41597-023-02554-9 · Cited by 13
Improving Resilience of Behaviometric Based Continuous Authentication with Multiple Accelerometers
hamme, T. V., Preuveneers, D., & Joosen, W. (2017) · Lecture notes in computer science · doi:10.1007/978-3-319-61176-1_26 · Cited by 11
Incremental Learning for Simultaneous Augmentation of Feature and Class
Hou, C., Gu, S., Xu, C., & Qian, Y. (2023) · IEEE Transactions on Pattern Analysis and Machine Intelligence · doi:10.1109/tpami.2023.3307670 · Cited by 10
Yoshimura, N., Maekawa, T., & Hara, T. (2021) · International Joint Conference on Neural Networks (IJCNN) · doi:10.1109/ijcnn52387.2021.9533888 · Cited by 10
Al-Fatlawi, A. H., Fatlawi, H. K., & Ling, S. H. (2017) · Annual International Conference of the IEEE Engineering in Medicine and Biology Society (EMBC) · doi:10.1109/embc.2017.8037456 · Cited by 10
In Shift and In Variance: Assessing the Robustness of HAR Deep Learning Models Against Variability
Khaked, A. A., Oishi, N., Roggen, D., & Lago, P. (2025) · Sensors · doi:10.3390/s25020430 · Cited by 9
Chances of Interpretable Transfer Learning for Human Activity Recognition in Warehousing
Kirchhof, M., Schmid, L., Reining, C., ten Hompel, M., & Pauly, M. (2021) · Lecture notes in computer science · doi:10.1007/978-3-030-87672-2_11 · Cited by 9
Ruder, M. C., Hunt, M. A., Charlton, J. M., Tse, C. T. F., & Kobsar, D. (2022) · Journal of Biomechanics · doi:10.1016/j.jbiomech.2022.111263 · Cited by 9
A simple method to estimate the trajectory of a low cost mobile robotic platform using an IMU
Botero-Valencia, J., Rico-García, M., & Villegas-Ceballos, J. P. (2016) · International Journal on Interactive Design and Manufacturing (IJIDeM) · doi:10.1007/s12008-016-0340-5 · Cited by 9
Analysis of Motion Patterns for Recognition of Human Activities
Janidarmian, M., Fekr, A. R., Radecka, K., Žilić, Ž., & Ross, L. J. (2015) · Wireless Mobile Communication and Healthcare · doi:10.4108/eai.14-10-2015.2261719 · Cited by 8
On the Impact of Lateralization in Physiological Signals from Wearable Sensors
Alchieri, L., Abdalazim, N., Alecci, L., Gashi, S., Lascio, E. D., & Silvia Santini, B. (2022) · ACM International Joint Conference on Pervasive and Ubiquitous Computing (UbiComp) · doi:10.1145/3544793.3563427 · Cited by 7
A Lightweight Deep Human Activity Recognition Algorithm Using Multiknowledge Distillation
Chen, R., Luo, H., Zhao, F., Meng, X., Xie, Z., & Zhu, Y. (2024) · IEEE Sensors Journal · doi:10.1109/jsen.2024.3443308 · Cited by 7
Position Invariance for Wearables: Interchangeability and Single-Unit Usage via Machine Learning
Yurtman, A., Barshan, B., & Redif, S. (2020) · IEEE Internet of Things Journal · doi:10.1109/jiot.2020.3044754 · Cited by 7
Addressing Security and Privacy Challenges in Internet of ThingsPreprint
Mosenia, A. (2018) · arXiv (Cornell University) · doi:10.48550/arxiv.1807.06724 · Cited by 9
FIP: Endowing Robust Motion Capture on Daily Garment by Fusing Flex and Inertial Sensors
Zheng, R., Fang, J., Yuan, Y., Gao, X., Zuo, C., Guo, S., & Luo, Y. (2025) · CHI Conference on Human Factors in Computing Systems · doi:10.1145/3706598.3714140 · Cited by 6
Khaked, A. A., Oishi, N., Roggen, D., & Lago, P. (2023) · ACM International Joint Conference on Pervasive and Ubiquitous Computing (UbiComp) · doi:10.1145/3594739.3610742 · Cited by 9
Wang, H., Wang, X., Lu, C., Yuan, M., Wang, Y., Yu, H., & Li, H. (2024) · IEEE Access · doi:10.1109/access.2024.3422256 · Cited by 7
Hand Dynamics for Behavioral User Authentication
Garcia, F. T., Krombholz, K., Mayer, R. L., & Weippl, E. R. (2016) · International Conference on Availability, Reliability and Security (ARES) · doi:10.1109/ares.2016.107 · Cited by 6
On the Feasibility of On-body Roaming Models in Human Activity Recognition
Abdu-Aguye, M. G., Gomaa, W. E., Makihara, Y., & Yagi, Y. (2019) · International Conference on Informatics in Control, Automation and Robotics (ICINCO) · doi:10.5220/0007921606800690 · Cited by 6
Abdu-Aguye, M. G., Gomaa, W. E., Makihara, Y., & Yagi, Y. (2020) · International Joint Conference on Neural Networks (IJCNN) · doi:10.1109/ijcnn48605.2020.9207082 · Cited by 6
Pellatt, L., & Roggen, D. (2021) · International Symposium on Wearable Computers · doi:10.1145/3460421.3478813 · Cited by 7
Klonovs, J., Haque, M. A., Krueger, V., Nasrollahi, K., Andersen‐Ranberg, K., Moeslund, T. B., & Spaich, E. G. (2016) · SpringerBriefs in computer science · doi:10.1007/978-3-319-27024-1_4 · Cited by 6
Gyro-Mag: Attack-Resilient System Based on Sensor Estimation
Lee, S. (2025) · Sensors · doi:10.3390/s25072208 · Cited by 5
Inai, T., Kobayashi, Y., Sudo, M., Yamashiro, Y., & Ueda, T. (2024) · Sensors · doi:10.3390/s24165096 · Cited by 5
Adaptive Learning for Dynamic Features and Noisy Labels
Gu, S., Xu, C., Hu, D., & Hou, C. (2024) · IEEE Transactions on Pattern Analysis and Machine Intelligence · doi:10.1109/tpami.2024.3489217 · Cited by 5
WIMUSim: simulating realistic variabilities in wearable IMUs for human activity recognition
Oishi, N., Birch, P. M., Roggen, D., & Lago, P. (2025) · Frontiers in Computer Science · doi:10.3389/fcomp.2025.1514933 · Cited by 9
Low Back Biomechanics of Keg Handling Using Inertial Measurement Units
Brents, C. A., Hischke, M., Reiser, R., & Rosecrance, J. C. (2018) · Advances in intelligent systems and computing · doi:10.1007/978-3-319-96068-5_8 · Cited by 5
Latent space unsupervised semantic segmentation
Strommen, K. J., Tørresen, J., & Côté‐Allard, U. (2023) · Frontiers in Physiology · doi:10.3389/fphys.2023.1151312 · Cited by 5
Davidoviča, A., Semjonova, G., Kamynina, L., Lancere, L., Jonate, A., Tomsone, S., Kataševs, A., Okss, A., & Davidovičs, S. (2025) · Applied Sciences · doi:10.3390/app15031584 · Cited by 5
Human activity recognition using LZW-Coded Probabilistic Finite State Automata
Wilson, J. P., Najjar, N., Hare, J. Z., & Gupta, S. (2015) · Proceedings - IEEE International Conference on Robotics and Automation/Proceedings · doi:10.1109/icra.2015.7139613 · Cited by 5
Bailón, C., Damas, M., Pomares, H., & Baños, O. (2016) · Lecture notes in computer science · doi:10.1007/978-3-319-48746-5_5 · Cited by 5
Self-citationCarrillo‐Pérez, F., Diaz-Reyes, I., Damas, M., Baños, O., Soto-Hermoso, V. M., & Molina‐Molina, A. (2018) · International Conference on Sport Sciences Research and Technology Support (icSPORTS) · doi:10.5220/0006922600340039 · Cited by 5
Self-citationMuralidhar, N., Tabassum, A., Chen, L., Chinthavali, S., Ramakrishnan, N., & Prakash, B. A. (2020) · ACM Transactions on Intelligent Systems and Technology · doi:10.1145/3394118 · Cited by 5
Metadata
- Authors
- Banos, O., Toth, M., Damas, M., Pomares, H., & Rojas, I.
- Affiliations
- Department of Computer Architecture and Computer Technology, Research Center for Information and Communications Technologies-University of Granada (CITIC-UGR), C/Calle Periodista RafaelGomez Montero 2, Granada E18071, Spain
- University of the Basque Country (ES)
- Universidad de Granada (ES)
- Venue
- Sensors
- Publisher
- MDPI AG
- Published
- 2014-06-06
- Volume
- 14
- Issue
- 6
- Pages
- 9995-10023
- ISSN
- 1424-8220 (ISSN-L)
- PMC
- PMC4118358
- OpenAlex
- W2157091296
- Cited by
- 159
- References
- 52
- Citations by year
- 2026: 9 · 2025: 10 · 2024: 10 · 2023: 12 · 2022: 11 · 2021: 17 · 2020: 13 · 2019: 8 · 2018: 20 · 2017: 18 · 2016: 15 · 2015: 13 · 2014: 3
- FWCI
- 14.59
- Type
- journal article
- Language
- en
- Open access
- gold
- doi.org
- Licence
- Locations
- Sensors (publishedVersion, cc-by)
- PubMed Central (publishedVersion, cc-by)
- PubMed (publishedVersion)
- LA Referencia (Red Federada de Repositorios Institucionales de Publicaciones Científicas) (submittedVersion, cc-by)
- Communities in ADDI (Universidad del Pais Vasco) (submittedVersion, other-oa)
- Communities in ADDI (University of the Basque Country) (submittedVersion, other-oa)
- Institutional Repository of the University of Granada (University of Granada) (submittedVersion, cc-by-nc-nd)
- LA Referencia (Red Federada de Repositorios Institucionales de Publicaciones Científicas) (submittedVersion, cc-by-nc-nd)
- DOAJ (DOAJ: Directory of Open Access Journals) (submittedVersion, cc-by-sa)
- Hispana (submittedVersion, other-oa)
- Funders
- European Commission (264738, 228398)
- Topics
- Physical Sciences › Computer Science › Computer Vision and Pattern Recognition › Context-Aware Activity Recognition Systems
- Health Sciences › Medicine › Public Health, Environmental and Occupational Health › Physical Activity and Health
- Physical Sciences › Engineering › Biomedical Engineering › Advanced Sensor and Energy Harvesting Materials
- Keywords
- wearable activity recognition, sensor displacement, self-placement, sensor placement, wearable sensors
- MeSH terms
- Activities of Daily Living, Adult, Clothing, Equipment Design, Female, Humans, Male, Exercise, Monitoring, Ambulatory, Young Adult
About these checks
Registry, retraction, Cites and statistics results are computed, not judged, with one exception: a printed reference that no index lists is read once by a model before it counts as a citation error. Claims are extracted by a model and kept only when their quote appears verbatim in the text; each cited source is then checked, with a model’s help, for whether it says what the claim relies on. Those verdicts can be wrong — read the claim’s quote and the cited source before relying on one.
Statistics and arithmetic are recomputed, not judged.
Confidence bands are shown only for fields calibrated on our annotated test set. None is calibrated yet, so no band is shown.
What counts as a claim ›How we measure confidence ›How we check this ›
Are you an author, or do you see a problem with this page? Request a review
