

Convolutional Neural Network-Based Human Detection in Nighttime Images Using Visible Light Camera Sensors
Open accessThe DOI matches its Crossref record; 54 of the 56 references it cites were found in a registry or an index.
Abstract
Because intelligent surveillance systems have recently undergone rapid growth, research on accurately detecting humans in videos captured at a long distance is growing in importance. The existing research using visible light cameras has mainly focused on methods of human detection for daytime hours when there is outside light, but human detection during nighttime hours when there is no outside light is difficult. Thus, methods that employ additional near-infrared (NIR) illuminators and NIR cameras or thermal cameras have been used. However, in the case of NIR illuminators, there are limitations in terms of the illumination angle and distance. There are also difficulties because the illuminator power must be adaptively adjusted depending on whether the object is close or far away. In the case of thermal cameras, their cost is still high, which makes it difficult to install and use them in a variety of places. Because of this, research has been conducted on nighttime human detection using visible light cameras, but this has focused on objects at a short distance in an indoor environment or the use of video-based methods to capture multiple images and process them, which causes problems related to the increase in the processing time. To resolve these problems, this paper presents a method that uses a single image captured at night on a visible light camera to detect humans in a variety of environments based on a convolutional neural network. Experimental results using a self-constructed Dongguk night-time human detection database (DNHD-DB1) and two open databases (Korea advanced institute of science and technology (KAIST) and computer vision center (CVC) databases), as well as high-accuracy human detection in a variety of environments, show that the method has excellent performance compared to existing methods.
Overview
The claims and statistics of this paper haven’t been checked yet.
Free: it reads the open-access text and checks the first 5 claims that cite a source we can check. Create a free account to check every claim.
Integrity signals
Registry
Cites
Statistics
Figures

Verification
Claims the paper makes
The claims and statistics of this paper haven’t been checked yet.
Free: it reads the open-access text and checks the first 5 claims that cite a source we can check. Create a free account to check every claim.
Claims other papers make about this one
Each is checked against this paper’s own text: does it say what the citing paper says it does?
The source backs part of the claim, not all of it — or backs it for a different population, condition or comparison.
In the citing paper
“Studies such as Kim et al. [145] have demonstrated the effectiveness of CNNs in low-light conditions, a significant advancement for nighttime AV navigation.”
From Object Detection in Autonomous Vehicles under Adverse Weather: A Review of Traditional and Deep Learning Approaches (2024) · cites this paper as [145]
Experimental — accuracy not yet measuredThe cited source says what the claim attributes to it.
In the citing paper
“The research presented in [145] demonstrates a significant advancement in nighttime human detection using visible light cameras, particularly through the application of convolutional neural networks (CNNs).The method's effectiveness is evident in its superior performance across various contexts, including open and self-constructed databases such as DNHD-DB1, KAIST, and CVC.”
From Object Detection in Autonomous Vehicles under Adverse Weather: A Review of Traditional and Deep Learning Approaches (2024) · cites this paper as [145]
Self-check
Percentages, sums and reported differences re-computed from the paper’s own numbers.
The self-check needs the paper’s full text.
Citations
Cites
Very Deep Convolutional Networks for Large-Scale Image Recognition
Simonyan, K., & Zisserman, A. (2014) · arXiv · doi:10.48550/arxiv.1409.1556 · Cited by 114,148 · cited 2×
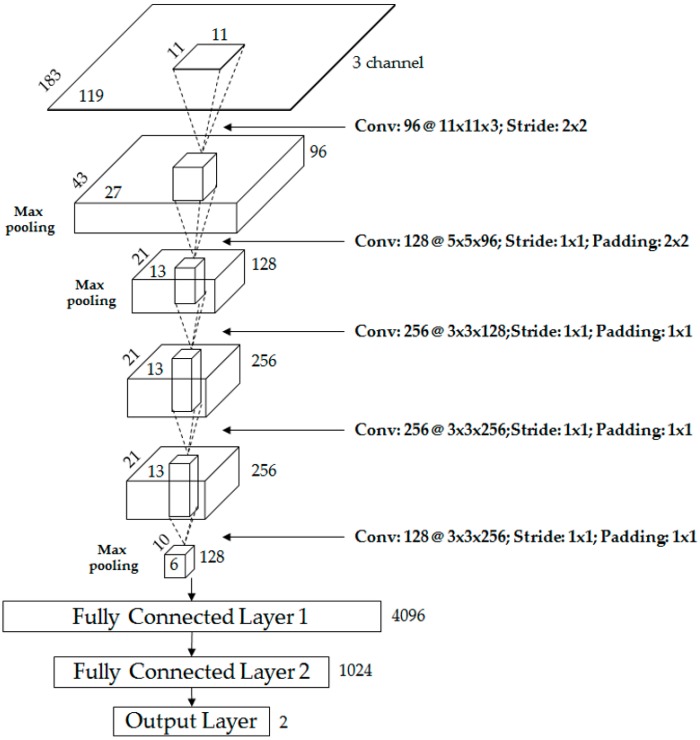
“The 1st convolutional layer’s filter size is relatively large, unlike those in previ us studies [52,53], because the input images are dark, with a fairly large amount of noise in their features.”
BackgroundImageNet classification with deep convolutional neural networks
Krizhevsky, A., Sutskever, I., & Hinton, G. E. (2017) · Communications of the ACM · doi:10.1145/3065386 · Cited by 112,155 · cited 10×
“In Equation (2), cx,y is a value obtained by normalization [47].”
BackgroundMethodInfluentialGradient-based learning applied to document recognition
Lecun, Y., Bottou, L., Bengio, Y., & Haffner, P. (1998) · Proceedings of the IEEE · doi:10.1109/5.726791 · Cited by 58,805 · cited 1×
“AlexNet [47] and other existing methods from the literature [48,49] used square input images with the same height and width.”
MethodGoing deeper with convolutions
Szegedy, C., Liu, W., Jia, Y., Sermanet, P., Reed, S., Anguelov, D., Erhan, D., Vanhoucke, V., & Rabinovich, A. (2015) · 2015 IEEE Conference on Computer Vision and Pattern Recognition (CVPR) · doi:10.1109/cvpr.2015.7298594 · Cited by 48,562
Histograms of Oriented Gradients for Human Detection
Dalal, N., & Triggs, B. (2005) · 2005 IEEE Computer Society Conference on Computer Vision and Pattern Recognition (CVPR'05) · doi:10.1109/cvpr.2005.177 · Cited by 33,584 · cited 7×
“As shown in Figure 9, the accuracies with the proposed m thod re higher t an those using previous methods [16,42].”
MethodInfluential(2014) · Cited by 33,419
(2010) · International Conference on Machine Learning · Cited by 13,995
(2011) · Cited by 6,993
DeepFace: Closing the Gap to Human-Level Performance in Face Verification
Taigman, Y., Yang, M., Ranzato, M., & Wolf, L. (2014) · 2014 IEEE Conference on Computer Vision and Pattern Recognition · doi:10.1109/cvpr.2014.220 · Cited by 6,542
A Dynamic Histogram Equalization for Image Contrast Enhancement
Abdullah-Al-Wadud, M., Kabir, M., Akber Dewan, M., & Chae, O. (2007) · IEEE Transactions on Consumer Electronics · doi:10.1109/tce.2007.381734 · Cited by 1,346 · cited 1×
“To resolve these problems, research has been performed on a variety of histogram processing and intensity mapping-based image enhancement methods [33–37].”
MethodMultispectral pedestrian detection: Benchmark dataset and baseline
Hwang, S., Park, J., Kim, N., Choi, Y., & Kweon, I. S. (2015) · 2015 IEEE Conference on Computer Vision and Pattern Recognition (CVPR) · doi:10.1109/cvpr.2015.7298706 · Cited by 1,249 · cited 3×
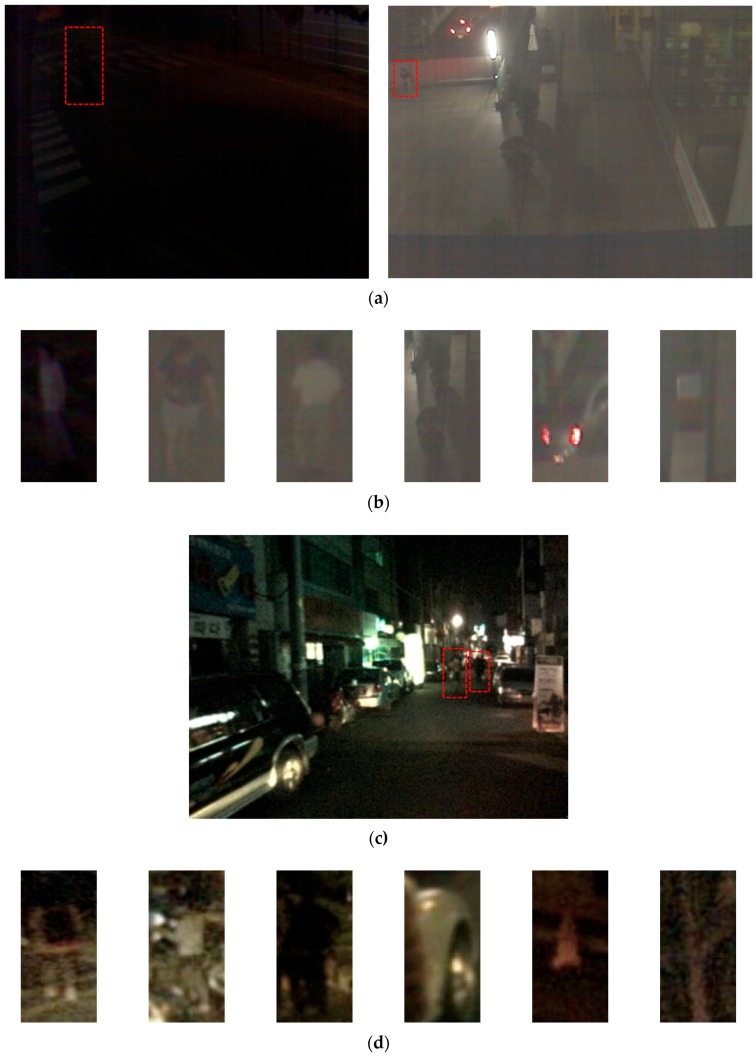
“In addition, in order to evaluate the human detection performance in nighttime images captured with a moving camera rather than a fixed camera, we used the KAIST [61] and CVC-14 databases [62] as shown in Figure 3c–f in the experiments.”
MethodMoving target classification and tracking from real-time video
Lipton, A. J., Fujiyoshi, H., & Patil, R. S. (2002) · Proceedings Fourth IEEE Workshop on Applications of Computer Vision. WACV'98 (Cat. No.98EX201) · doi:10.1109/acv.1998.732851 · Cited by 1,108
Detecting pedestrians using patterns of motion and appearance
Viola, Jones, & Snow (2003) · Proceedings Ninth IEEE International Conference on Computer Vision · doi:10.1109/iccv.2003.1238422 · Cited by 1,002
Human Detection Based on a Probabilistic Assembly of Robust Part Detectors
Mikolajczyk, K., Schmid, C., & Zisserman, A. (2004) · Lecture Notes in Computer Science · doi:10.1007/978-3-540-24670-1_6 · Cited by 608
Coltuc, D., Bolon, P., & Chassery, J.-M. (2006) · IEEE Transactions on Image Processing · doi:10.1109/tip.2005.864170 · Cited by 397
Pedestrian Detection and Tracking With Night Vision
Xu, F., Liu, X., & Fujimura, K. (2005) · IEEE Transactions on Intelligent Transportation Systems · doi:10.1109/tits.2004.838222 · Cited by 386 · cited 3×
“In the research of [15] as well, humans were assumed to have a higher temperature than the background, and a human’s size was estimated based on regions with high intensity.”
BackgroundMethodPedestrian Detection at Day/Night Time with Visible and FIR Cameras: A Comparison
González, A., Fang, Z., Socarras, Y., Serrat, J., Vázquez, D., Xu, J., & López, A. (2016) · Sensors · doi:10.3390/s16060820 · Cited by 322 · cited 1×
“In addition, in order to evaluate the human detection performance in nighttime images captured with a moving camera rather than a fixed camera, we used the KAIST [61] and CVC-14 databases [62] as shown in”
MethodReal-Time Pedestrian Detection with Deep Network Cascades
Angelova, A., Krizhevsky, A., Vanhoucke, V., Ogale, A., & Ferguson, D. (2015) · Procedings of the British Machine Vision Conference 2015 · doi:10.5244/c.29.32 · Cited by 239 · cited 1×
“With the development of hardware and algorithms, human detection for surveillance in complex environments has recently become possible, and in particular, the accuracy of human detection using convolution neural networks (CNNs) has greatly improved [12,13].”
BackgroundA low-light image enhancement method for both denoising and contrast enlarging
Li, L., Wang, R., Wang, W., & Gao, W. (2015) · 2015 IEEE International Conference on Image Processing (ICIP) · doi:10.1109/icip.2015.7351501 · Cited by 224 · cited 2×
“Denoising and image enhancement [38,39] Effectively removes noise that occurs during image enhancement - Because denoising requires many operations, the processing time is long compared to histogram methods - Has only produced experimental results for raising visibility through image enhancement, with no results produ…”
BackgroundMethodReal-Time Pedestrian Detection and Tracking at Nighttime for Driver-Assistance Systems
Ge, J., Luo, Y., & Tei, G. (2009) · IEEE Transactions on Intelligent Transportation Systems · doi:10.1109/tits.2009.2018961 · Cited by 170 · cited 2×
“In previous research [31], a monocular vision system for real-time pedestrian detection and tracking was proposed for nighttime driving with a NIR camera with illumination from full-beam headlights.”
BackgroundCao, L., Dikmen, M., Fu, Y., & Huang, T. S. (2008) · ACM International Conference on Multimedia (ACM MM) · doi:10.1145/1459359.1459470 · Cited by 166 · cited 1×
“As the feature extractor, the HOG method has been widely applied to various computer vision problems using face images or human body, such as the pedestrian detection [16,42], age estimation [43], face recognition [44], and gender recognition [45,46].”
MethodA real-time object detecting and tracking system for outdoor night surveillance
Huang, K., Wang, L., Tan, T., & Maybank, S. (2007) · Pattern Recognition · doi:10.1016/j.patcog.2007.05.017 · Cited by 128 · cited 3×
“Using visible light camera Uses local change in contrast over time [28,29] Uses low-cost visible light cameras - Can only be used in a fixed camera environment - Has trouble detecting humans who are standing still - Must use continuous video frames, which requires a fast capture speed, and it processes multiple images…”
BackgroundAdaptive enhancement and noise reduction in very low light-level video
Malm, H., Oskarsson, M., Warrant, E. J., Clarberg, P., Hasselgren, J., & Lejdfors, C. (2007) · IEEE/CVF International Conference on Computer Vision (ICCV) · doi:10.1109/iccv.2007.4409007 · Cited by 110 · cited 2×
“Denoising and image enhancement [38,39] Effectively removes noise that occurs during image enhancement - Because denoising requires many operations, the processing time is long compared to histogram methods - Has only produced experimental results for raising visibility through image enhancement, with no results produ…”
BackgroundMethodContent-Aware Dark Image Enhancement Through Channel Division
Rivera, A. R., Ryu, B., & Chae, O. (2012) · IEEE Transactions on Image Processing · doi:10.1109/tip.2012.2198667 · Cited by 102
Pedestrian detection in far infrared images
Olmeda, D., Premebida, C., Nunes, U., Armingol, J. M., & de la Escalera, A. (2013) · Integrated Computer-Aided Engineering · doi:10.3233/ica-130441 · Cited by 88
Improved human detection and classification in thermal images
Wang, W., Zhang, J., & Shen, C. (2010) · Proceedings - International Conference on Image Processing · doi:10.1109/icip.2010.5649946 · Cited by 79
Human Detection Based on the Generation of a Background Image by Using a Far-Infrared Light Camera
Jeon, E. H., Choi, J., Lee, J. E., Shin, K., Kim, Y. H., Le, T. T., & Park, K. R. (2015) · Sensors · doi:10.3390/s150306763 · Cited by 70
Self-citationNovel descriptors for geometrical 3D face analysis
Marcolin, F., & Vezzetti, E. (2016) · Multimedia Tools and Applications · doi:10.1007/s11042-016-3741-3 · Cited by 64
Pedestrian detection based on deep convolutional neural network with ensemble inference network
Fukui, H., Yamashita, T., Yamauchi, Y., Fujiyoshi, H., & Murase, H. (2015) · IEEE Intelligent Vehicles Symposium · doi:10.1109/ivs.2015.7225690 · Cited by 63 · cited 1×
“With the development of hardware and algorithms, human detection for surveillance in complex environments has recently become possible, and in particular, the accuracy of human detection using convolution neural networks (CNNs) has greatly improved [12,13].”
BackgroundRobust Pedestrian Detection by Combining Visible and Thermal Infrared Cameras
Lee, J. H., Choi, J., Jeon, E. H., Kim, Y. H., Le, T. T., Shin, K., Lee, H., & Park, K. R. (2015) · Sensors · doi:10.3390/s150510580 · Cited by 54
Self-citationAn effective approach to pedestrian detection in thermal imagery
Li, W., Zheng, D., Zhao, T., & Yang, M. (2012) · International Conference on Natural Computation (ICNC) · doi:10.1109/icnc.2012.6234621 · Cited by 49
Classification of Age Groups from Facial Image Using Histograms of Oriented Gradients
Hajizadeh, M., & Ebrahimnezhad, H. (2011) · Iranian Conference on Machine Vision and Image Processing · doi:10.1109/iranianmvip.2011.6121582 · Cited by 47 · cited 1×
“As the feature extractor, the HOG method has been widely applied to various computer vision problems using face images or human body, such as the pedestrian detection [16,42], age estimation [43], face recognition [44], and gender recognition [45,46].”
MethodImage contrast enhancement based on intensity-pair distribution
Jen, T.-C., Hsieh, B., & Wang, S. (2005) · Proceedings - International Conference on Image Processing · doi:10.1109/icip.2005.1529900 · Cited by 44
Artificial intelligence for humans
Heaton, J. (2013) · Cited by 43
Body-Based Gender Recognition Using Images from Visible and Thermal Cameras
Nguyen, D. T., & Park, K. R. (2016) · Sensors · doi:10.3390/s16020156 · Cited by 41 · cited 1×
“As the feature extractor, the HOG method has been widely applied to various computer vision problems using face images or human body, such as the pedestrian detection [16,42], age estimation [43], face recognition [44], and gender recognition [45,46].”
MethodSelf-citationContextually Learnt Detection of Unusual Motion-Based Behaviour in Crowded Public Spaces
Arandjelovic, O. (2013) · International Symposium on Computer and Information Sciences · doi:10.1007/978-1-4471-2155-8_51 · Cited by 36
Robust Face Recognition by Computing Distances From Multiple Histograms of Oriented Gradients
Karaaba, M. F., Surinta, O., Schomaker, L., & Wiering, M. (2015) · IEEE Symposium Series on Computational Intelligence (SSCI) · doi:10.1109/ssci.2015.39 · Cited by 34 · cited 1×
“As the feature extractor, the HOG method has been widely applied to various computer vision problems using face images or human body, such as the pedestrian detection [16,42], age estimation [43], face recognition [44], and gender recognition [45,46].”
MethodMultiple-object Tracking in Cluttered and Crowded Public Spaces
Martin, R., & Arandjelović, O. (2010) · Lecture notes in computer science · doi:10.1007/978-3-642-17277-9_10 · Cited by 33
Jeon, E. H., Kim, J. K., Hong, H. G., Batchuluun, G., & Park, K. R. (2016) · Sensors · doi:10.3390/s16040453 · Cited by 32
Self-citationNight-time Pedestrian Detection by Visual-Infrared Video Fusion
Chen, Y., & Han, C. (2008) · World Congress on Intelligent Control and Automation · doi:10.1109/wcica.2008.4593753 · Cited by 30 · cited 4×
“Although the research in [27] used the assumption that the human body has a higher temperature than the background, during a hot summer, the background can be hotter than or similar to the human body, even at night.”
BackgroundMethodInfluentialRobust Behavior Recognition in Intelligent Surveillance Environments
Batchuluun, G., Kim, Y. H., Kim, J. K., Hong, H. G., & Park, K. R. (2016) · Sensors · doi:10.3390/s16071010 · Cited by 25
Self-citationSerrano-Cuerda, J., Fernández‐Caballero, A., & López, M. T. (2014) · Applied Sciences · doi:10.3390/app4030331 · Cited by 23
A weakly supervised approach for object detection based on Soft-Label Boosting
Wang, W., Wang, Y., Chen, F., & Sowmya, A. (2013) · Proceedings · doi:10.1109/wacv.2013.6475037 · Cited by 21
Pedestrian detection in low resolution night vision images
Pawłowski, P., Piniarski, K., & Dąbrowski, A. (2015) · Signal Processing: Algorithms, Architectures, Arrangements, and Applications · doi:10.1109/spa.2015.7365157 · Cited by 21 · cited 12×
“The HOG method constructs histogram features of a sub-block of an image based on the accumulation of the direction and strength of the gradient information at every pixel within the sub-block.”
BackgroundMethodInfluentialA concurrent neural network approach to pedestrian detection in thermal imagery
Neagoe, V.-E., Ciotec, A.-D., & Barar, A.-P. (2012) · International Conference on Communications (COMM) · doi:10.1109/iccomm.2012.6262539 · Cited by 20
Real Time Pedestrian Tracking using Thermal Infrared Imagery
Li, J., & Gong, W. (2010) · Journal of Computers · doi:10.4304/jcp.5.10.1606-1613 · Cited by 17 · cited 1×
“Thus, there has been a large amount of research performed on human detection using far-infrared (FIR) cameras instead of the widely used visible light cameras [14–26].”
BackgroundStrict ordering on discrete images and applications
Coltuc, D., & Bolon, P. (2003) · Proceedings - International Conference on Image Processing · doi:10.1109/icip.1999.817089 · Cited by 16
Application of geometry to RGB images for facial landmark localisation - a preliminary approach
Vezzetti, E., Marcolin, F., Tornincasa, S., & Maroso, P. (2016) · International Journal of Biometrics · doi:10.1504/ijbm.2016.082597 · Cited by 15
A robust and enhanced approach for human detection in crowd
khatoon, R., Saqlain, S. M., & Bibi, S. (2012) · International Multi-Topic Conference · doi:10.1109/inmic.2012.6511457 · Cited by 14
Human Detection In Hours Of Darkness Using Gaussian Mixture Model Algorithm
Komagal, E., Seenivasan, V., Anand, K., & raj, C. P. A. (2014) · International Journal of Information Sciences and Techniques · doi:10.5121/ijist.2014.4311 · Cited by 12 · cited 3×
“In [ 14 ], a Gaussian mixture model ( GMM ) was used on FIR image frames to For these reasons, research is being performed on human detection at night using visible light images [28,29].”
MethodDiscrete features for rapid pedestrian detection in infrared images
Olmeda, D., Armingol, J. M., & de la Escalera, A. (2012) · IEEE/RSJ International Conference on Intelligent Robots and Systems (IROS) · doi:10.1109/iros.2012.6385928 · Cited by 11
Human detection in semi-dense scenes using HOG descriptor and mixture of SVMs
Rajaei, A., Boroujeni, H. S., & Charkari, N. M. (2013) · International Conference on Computer and Knowledge Engineering · doi:10.1109/iccke.2013.6682838 · Cited by 10
Object detection and tracking in night time video surveillance
Nazib, A., Oh, C.-M., & Lee, C.-W. (2013) · International Conference on Ubiquitous Robots and Ambient Intelligence · doi:10.1109/urai.2013.6677410 · Cited by 10 · cited 3×
“Using visible light camera Uses local change in contrast over time [28,29] Uses low-cost visible light cameras - Can only be used in a fixed camera environment - Has trouble detecting humans who are standing still - Must use continuous video frames, which requires a fast capture speed, and it processes multiple images…”
BackgroundReal-time pedestrian detection system with novel thermal features at night
Lin, C., Lin, S.-F., Hwang, C.-H., & Chen, Y.-C. (2014) · IEEE International Instrumentation and Measurement Technology Conference · doi:10.1109/i2mtc.2014.6860962 · Cited by 8
Research works printed but not linked: 2
- Oren, M., Papageorgiou, C., Sinha, P., Osuna, E., and Poggio, T. (1997, January 17–19). Pedestrian detection using wavelet templates. Proceedings of the IEEE Computer Society Conference on Computer Vision and Pattern Recognition, San Juan, Puerto Rico.
- Gonzalez, R.C., and Woods, R.E. (2010). Digital Image Processing, Prentice Hall. [3rd ed.].
Cited by
Gupta, A., Anpalagan, A., Guan, L., & Khwaja, A. S. (2021) · Array · doi:10.1016/j.array.2021.100057 · Cited by 565
Zhang, Y.-D., Dong, Z., Chen, X., Jia, W., Du, S., Muhammad, K., & Wang, S.-H. (2019) · Multimedia Tools and Applications · doi:10.1007/s11042-017-5243-3 · Cited by 395
“Here the hyperparameters are obtained by experiences, following the settings in open published literature [4, 7, 16].”
Sakaridis, C., Dai, D., & Van Gool, L. (2019) · 2019 IEEE/CVF International Conference on Computer Vision (ICCV) · doi:10.1109/iccv.2019.00747 · Cited by 281
“Several works pertain to human detection at nighttime, using FIR cameras [10, 37], visible light cameras [15], or a combination of both [4].”
BackgroundDark Model Adaptation: Semantic Image Segmentation from Daytime to Nighttime
Dai, D., & Gool, L. V. (2018) · 2018 21st International Conference on Intelligent Transportation Systems (ITSC) · doi:10.1109/itsc.2018.8569387 · Cited by 207
Sakaridis, C., Dai, D., & Van Gool, L. (2022) · IEEE Transactions on Pattern Analysis and Machine Intelligence · doi:10.1109/tpami.2020.3045882 · Cited by 186
Metadata
- Authors
- Kim, J., Hong, H., & Park, K.
- Affiliations
- Dongguk University (KR)
- Corresponding author
- Park, Kang
- ORCID
- Venue
- Sensors
- Publisher
- MDPI AG
- Published
- 2017-05-08
- Volume
- 17
- Issue
- 5
- Pages
- 1065
- ISSN
- 1424-8220 (ISSN-L)
- PMC
- PMC5469670
- OpenAlex
- W2613296094
- Semantic Scholar
- 03b2ac1d53b91f986b03e11eb50187aea6e73108
- Cited by
- 78
- References
- 56
- Citations by year
- 2026: 5 · 2025: 5 · 2024: 6 · 2023: 3 · 2022: 5 · 2021: 16 · 2020: 9 · 2019: 15 · 2018: 10 · 2017: 4
- FWCI
- 4.31
- Type
- journal article
- Language
- en
- Open access
- gold
- doi.org
- Licence
- Locations
- Sensors (publishedVersion, cc-by)
- Europe PMC (PubMed Central) (publishedVersion, cc-by)
- PubMed Central (publishedVersion, cc-by)
- PubMed (publishedVersion)
- DOAJ (DOAJ: Directory of Open Access Journals) (submittedVersion, cc-by-sa)
- Topics
- Physical Sciences › Computer Science › Computer Vision and Pattern Recognition › Advanced Neural Network Applications
- Physical Sciences › Computer Science › Computer Vision and Pattern Recognition › Video Surveillance and Tracking Methods
- Physical Sciences › Computer Science › Computer Vision and Pattern Recognition › Human Pose and Action Recognition
- Keywords
- visible camera, convolutional neural networks, intelligent surveillance
About these checks
Registry, retraction, Cites and statistics results are computed, not judged, with one exception: a printed reference that no index lists is read once by a model before it counts as a citation error. Claims are extracted by a model and kept only when their quote appears verbatim in the text; each cited source is then checked, with a model’s help, for whether it says what the claim relies on. Those verdicts can be wrong — read the claim’s quote and the cited source before relying on one.
Statistics and arithmetic are recomputed, not judged.
Confidence bands are shown only for fields calibrated on our annotated test set. None is calibrated yet, so no band is shown.
What counts as a claim ›How we measure confidence ›How we check this ›
Are you an author, or do you see a problem with this page? Request a review
Data sources
Bibliographic data: Semantic Scholar, OpenAlex, Crossref.
Contains information from the Semantic Scholar Academic Graph Datasets, made available under the ODC Attribution License (ODC-BY 1.0).
Semantic Scholar’s data is described in: Kinney, R., et al. (2023). The Semantic Scholar Open Data Platform. arXiv:2301.10140.
