

The DOI matches its Crossref record; 1 of the 1 references it cites were found in a registry or an index.
Assessing the Performance of GPS Precise Point Positioning Under Different Geomagnetic Storm Conditions during Solar Cycle 24
Open accessAbstract
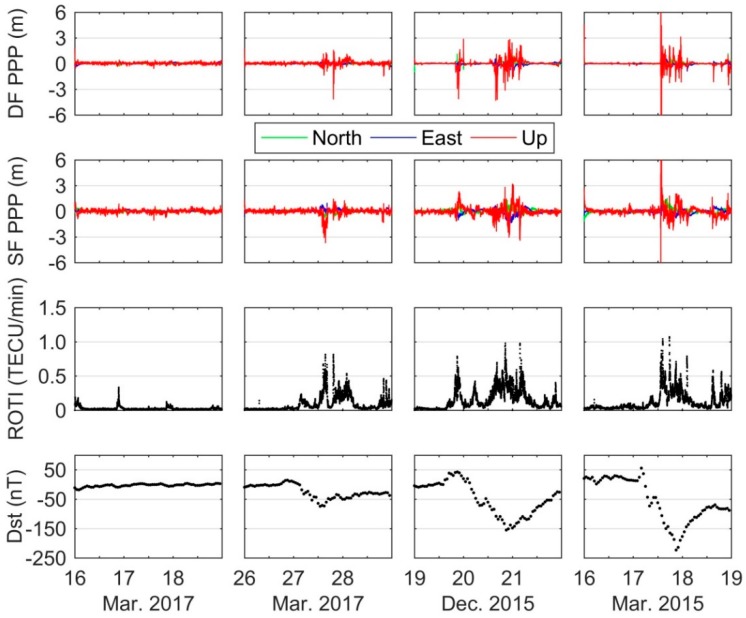
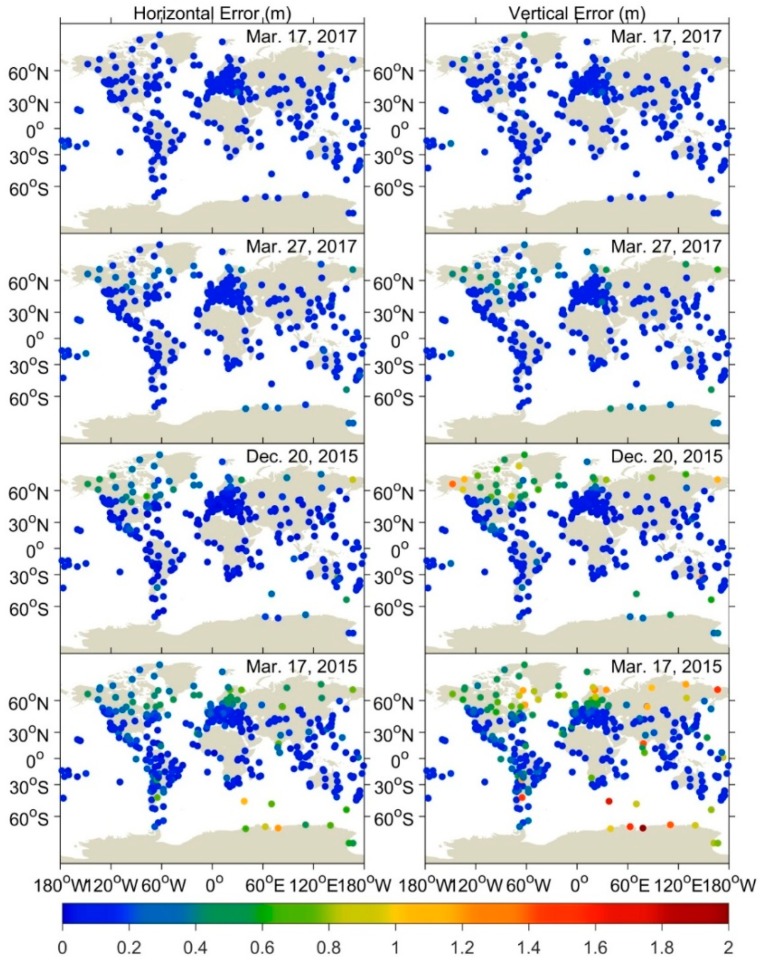
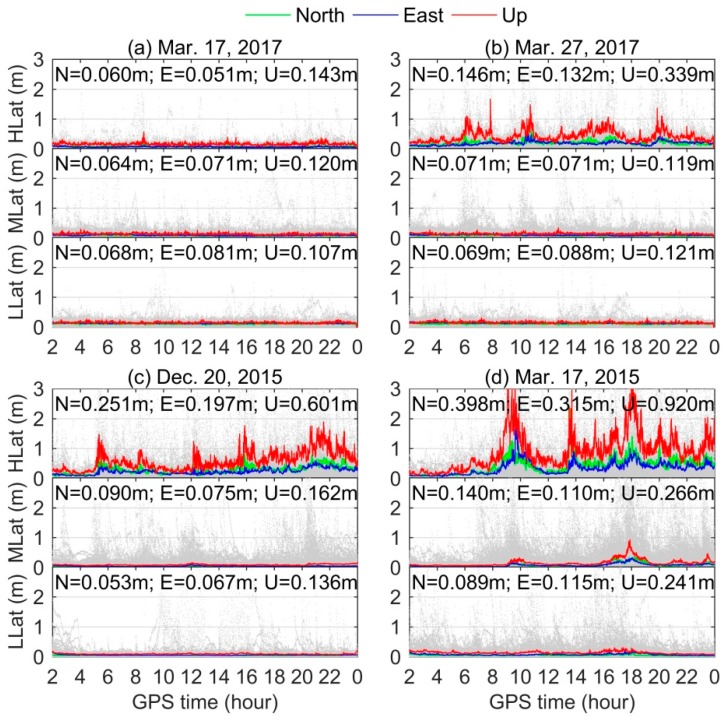
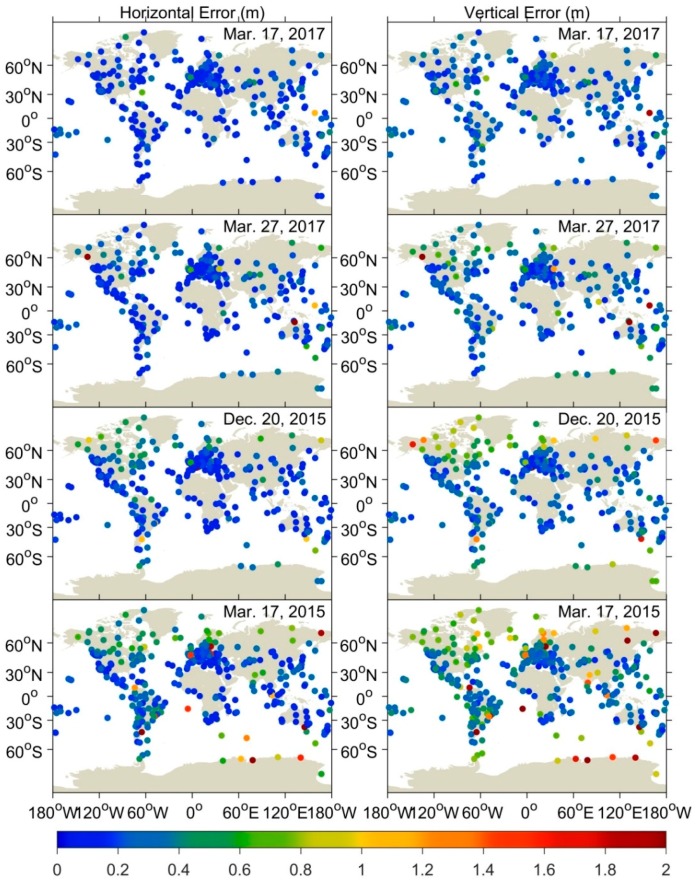
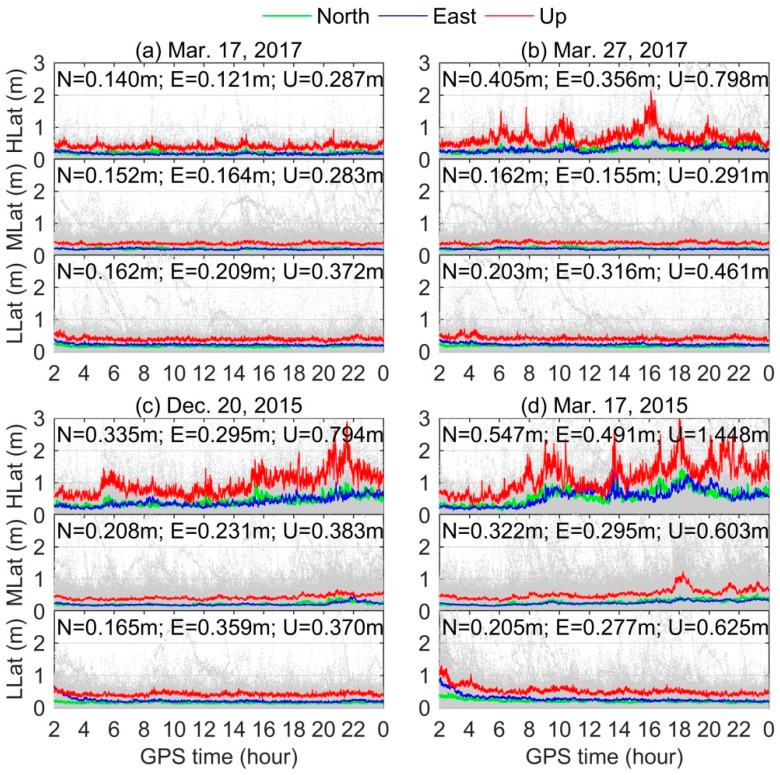
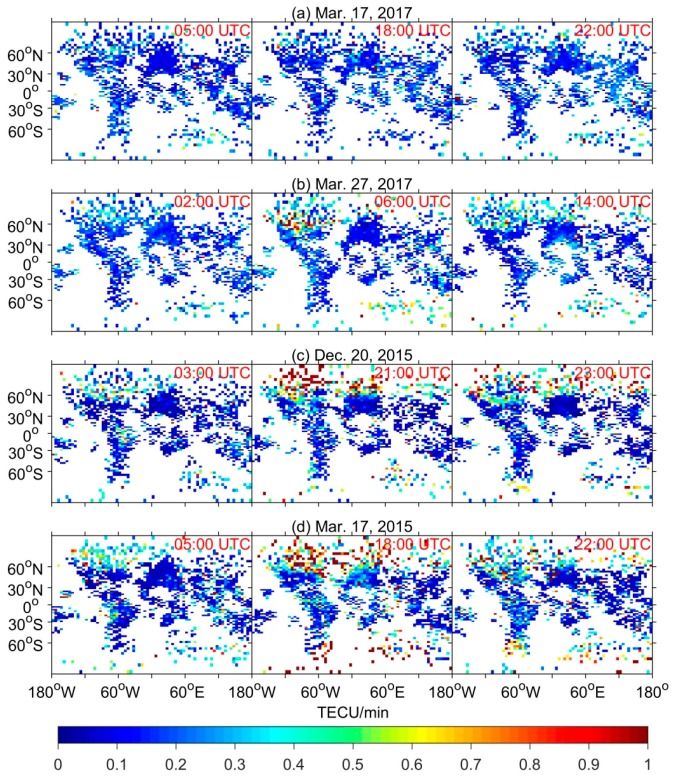
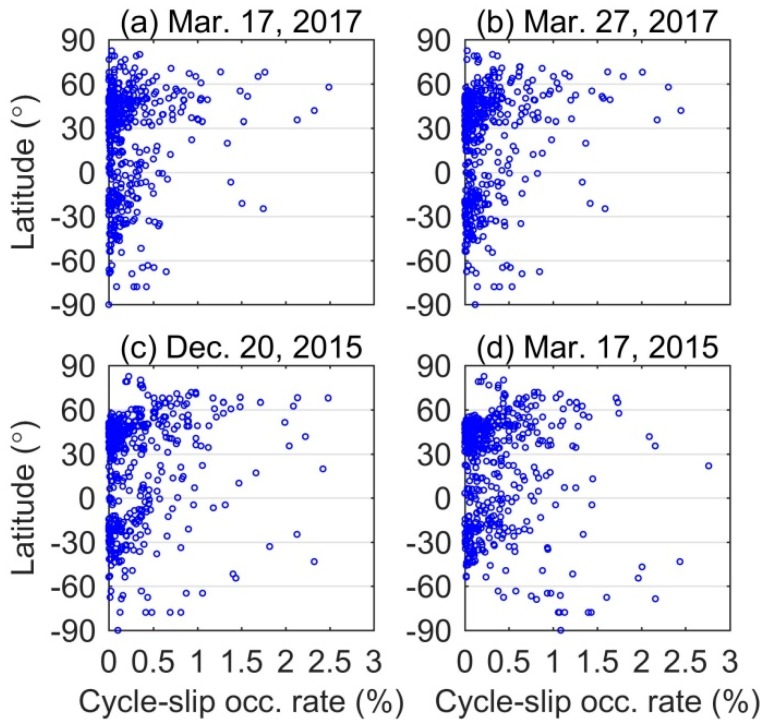
The geomagnetic storm, which is an abnormal space weather phenomenon, can sometimes severely affect GPS signal propagation, thereby impacting the performance of GPS precise point positioning (PPP). However, the investigation of GPS PPP accuracy over the global scale under different geomagnetic storm conditions is very limited. This paper for the first time presents the performance of GPS dual-frequency (DF) and single-frequency (SF) PPP under moderate, intense, and super storms conditions during solar cycle 24 using a large data set collected from about 500 international GNSS services (IGS) stations. The global root mean square (RMS) maps of GPS PPP results show that stations with degraded performance are mainly distributed at high-latitude, and the degradation level generally depends on the storm intensity. The three-dimensional (3D) RMS of GPS DF PPP for high-latitude during moderate, intense, and super storms are 0.393 m, 0.680 m and 1.051 m, respectively, with respect to only 0.163 m on quiet day. RMS errors of mid- and low-latitudes show less dependence on the storm intensities, with values less than 0.320 m, compared to 0.153 m on quiet day. Compared with DF PPP, the performance of GPS SF PPP is inferior regardless of quiet or disturbed conditions. The degraded performance of GPS positioning during geomagnetic storms is attributed to the increased ionospheric disturbances, which have been confirmed by our global rate of TEC index (ROTI) maps. Ionospheric disturbances not only lead to the deteriorated ionospheric correction but also to the frequent cycle-slip occurrence. Statistical results show that, compared with that on quiet day, the increased cycle-slip occurrence are 13.04%, 56.52%, and 69.57% under moderate, intense, and super storms conditions, respectively.
Overview
The claims and statistics of this paper haven’t been checked yet.
Run the check — free, no account needed. It reads the open-access text and checks the sources it cites.
Integrity signals
Registry
Cites
Statistics
Figures
Verification
Claims the paper makes
The claims and statistics of this paper haven’t been checked yet.
Run the check — free, no account needed. It reads the open-access text and checks the sources it cites.
Claims other papers make about this one
Each is checked against this paper’s own text: does it say what the citing paper says it does?
The cited source says what the claim attributes to it.
In the citing paper
“In the previous research, the notable positioning accuracy degradation at high-latitudes during the geomagnetic storm was attributed to the significant ionospheric disturbance, as depicted by the phase scintillation or ROTI indices, at high-latitudes (Luo et al., 2018;Yang et al., 2020).”
From The Mechanism for GNSS‐Based Kinematic Positioning Degradation at High‐Latitudes Under the March 2015 Great Storm (2022) · cites this paper as Luo et al., 2018
Self-check
Percentages, sums and reported differences re-computed from the paper’s own numbers.
The self-check needs the paper’s full text.
Citations
Cites
Marques, H. A., Marques, H. A. S., Aquino, M., Veettil, S. V., & Monico, J. F. G. (2018) · Journal of Space Weather and Space Climate · doi:10.1051/swsc/2017043 · Cited by 61
Research works printed but not linked: 36
- Gonzalez, 1994, What is a geomagnetic storm?, J. Geophys. Res. Space Phys., 99, 5771, 10.1029/93JA02867 · DOI
- Srivastava, 2004, Solar and interplanetary sources of major geomagnetic storms during 1996-2002, J. Geophys. Res. Space Phys., 109, 1, 10.1029/2003JA010175 · DOI
- Prasad, 2009, Geomagnetic storm effects on GPS based navigation, Ann. Geophys., 27, 2101, 10.5194/angeo-27-2101-2009 · DOI
- Skone, 2001, The impact of magnetic storms on GPS receiver performance, J. Geod., 75, 457, 10.1007/s001900100198 · DOI · Paper page
- Cherniak, I., and Zakharenkova, I. (2015). Dependence of the high-latitude plasma irregularities on the auroral activity indices: A case study of 17 March 2015 geomagnetic storm. Earth Planets Space, 67. · DOI
- Oksavik, 2015, Severe and localized GNSS scintillation at the poleward edge of the nightside auroral oval during intense substorm aurora, J. Geophys. Res. Space Phys., 120, 10607
- Carter, 2016, Global equatorial plasma bubble occurrence during the 2015 St. Patrick’s Day storm, J. Geophys. Res. A Space Phys., 121, 894, 10.1002/2015JA022194 · DOI
- Li, 2008, Effects of geomagnetic storm on GPS ionospheric scintillations at Sanya, J. Atmos. Sol. Terr. Phys., 70, 1034, 10.1016/j.jastp.2008.01.003 · DOI
- Luo, 2017, A study of Multi-GNSS ionospheric scintillation and cycle-slip over Hong Kong region for moderate solar flux conditions, Adv. Space Res., 60, 1039, 10.1016/j.asr.2017.05.038 · DOI
- Luo, 2018, Investigation of ionospheric scintillation effects on BDS precise point positioning at low-latitude regions, GPS Solut., 22, 1, 10.1007/s10291-018-0728-8 · DOI
- Rizos, 2002, Network RTK Research and Implementation: A Geodetic Perspective, J. Glob. Position Syst., 1, 144, 10.5081/jgps.1.2.144 · DOI
- Jacobsen, 2012, Observed effects of a geomagnetic storm on an RTK positioning network at high latitudes, J. Space Weather Space Clim., 2, A13, 10.1051/swsc/2012013 · DOI
- Wielgosz, 2005, Analysis of long-range network RTK during a severe ionospheric storm, J. Geod., 79, 524, 10.1007/s00190-005-0003-y · DOI
- Bergeot, 2011, Impact of the Halloween 2003 ionospheric storm on kinematic GPS positioning in Europe, GPS Solut., 15, 171, 10.1007/s10291-010-0181-9 · DOI
- Lejeune, 2012, Ionospheric effects on relative positioning within a dense GPS network, GPS Solut., 16, 105, 10.1007/s10291-011-0212-1 · DOI
- Jacobsen, 2016, Overview of the 2015 St. Patrick’s day storm and its consequences for RTK and PPP positioning in Norway, J. Space Weather Space Clim., 6, A9, 10.1051/swsc/2016004 · DOI
- Zumberge, 1997, Precise point positioning for the efficient and robust analysis of GPS data from large networks, J. Geophys. Res., 102, 5005, 10.1029/96JB03860 · DOI
- Lou, 2016, Multi-GNSS precise point positioning with raw single-frequency and dual-frequency measurement models, GPS Solut., 20, 849, 10.1007/s10291-015-0495-8 · DOI
- Echer, 2008, Interplanetary conditions causing intense geomagnetic storms (Dst ≤ -100 nT) during solar cycle 23 (1996-2006), J. Geophys. Res. Space Phys., 113, 1, 10.1029/2007JA012744 · DOI
- Kamide, 1998, Two-step development of geomagnetic storms, J. Geophys. Res., 103, 6917, 10.1029/97JA03337 · DOI
- Echer, 2013, Interplanetary origins of moderate (−100 nT <Dst ≤ −50 nT) geomagnetic storms during solar cycle 23 (1996–2008), J. Geophys. Res. Space Phys., 118, 385, 10.1029/2012JA018086 · DOI
- Zhang, 2007, Solar and interplanetary sources of major geomagnetic storms (Dst ≤ −100 nT) during 1996-2005, J. Geophys. Res. Space Phys., 112, 1, 10.1029/2007JA012321 · DOI
- Gu, 2015, Ionospheric effects in uncalibrated phase delay estimation and ambiguity-fixed PPP based on raw observable model, J. Geod., 89, 447, 10.1007/s00190-015-0789-1 · DOI
- Shi, 2012, An improved approach to model ionospheric delays for single-frequency Precise Point Positioning, Adv. Space Res., 49, 1698, 10.1016/j.asr.2012.03.016 · DOI
- Hopfield, 1971, Tropospheric effect on electromagnetically measured range: Prediction from surface weather data, Radio Sci., 6, 357, 10.1029/RS006i003p00357 · DOI
- Ma, 2006, A super bubble detected by dense GPS network at east Asian longitudes, Geophys. Res. Lett., 33, 1, 10.1029/2006GL027512 · DOI
- Xiong, 2016, The Swarm satellite loss of GPS signal and its relation to ionospheric plasma irregularities, Space Weather, 14, 563, 10.1002/2016SW001439 · DOI
- Nava, 2016, Middle- and low-latitude ionospheric response to 2015 St.Patrick’s Day, J. Geophys. Res. Space Phys., 121, 3421, 10.1002/2015JA022299 · DOI
- Pi, 1997, Monitoring of global ionospheric irregularities using the worldwide GPS Network, Geophys. Res. Lett., 24, 2283, 10.1029/97GL02273 · DOI
- Zakharov, 2016, Effect of magnetic storms and substorms on GPS slips at high latitudes, Cosm. Res., 54, 20, 10.1134/S0010952516010147 · DOI
- Astafyeva, 2014, Geomagnetic storms, super-storms, and their impacts on GPS-based navigation systems, Space Weather, 12, 508, 10.1002/2014SW001072 · DOI
- Yao, 2016, Analysis of the global ionospheric disturbances of the March 2015 great storm, J. Geophys. Res. Space Phys., 121, 12157, 10.1002/2016JA023352 · DOI
- Banville, 2013, Mitigating the impact of ionospheric cycle slips in GNSS observations, J. Geod., 87, 179, 10.1007/s00190-012-0604-1 · DOI
- Hoque, 2007, Higher order ionospheric effects in precise GNSS positioning, J. Geod., 81, 259, 10.1007/s00190-006-0106-0 · DOI
- Juan, 2018, Feasibility of precise navigation in high and low latitude regions under scintillation conditions, J. Space Weather Space Clim., 8, A05, 10.1051/swsc/2017047 · DOI
- Pireaux, 2010, Higher-order ionospheric effects in GPS time and frequency transfer, GPS Solut., 14, 267, 10.1007/s10291-009-0152-1 · DOI
Cited by
Sorted by citations
Nie, W., Rovira‐Garcia, A., Li, M., Fang, Z., Wang, Y., Zheng, D., & Xu, T. (2022) · Space Weather · doi:10.1029/2022sw003132 · Cited by 47
Space weather: risk factors for Global Navigation Satellite Systems
Demyanov, V., & Yasyukevich, Y. (2021) · Solar-Terrestrial Physics · doi:10.12737/stp-72202104 · Cited by 42
Metadata
- Authors
- Luo, X., Gu, S., Lou, Y., Xiong, C., Chen, B., & Jin, X.
- Affiliations
- Wuhan University (CN)
- GFZ Helmholtz Centre for Geosciences (DE)
- Central South University (CN)
- Corresponding author
- Gu, Shengfeng
- Venue
- Sensors
- Publisher
- MDPI AG
- Published
- 2018-06-01
- Volume
- 18
- Issue
- 6
- Pages
- 1784
- ISSN
- 1424-8220 (ISSN-L)
- PMC
- PMC6022218
- OpenAlex
- W2805795343
- Cited by
- 78
- References
- 1
- Citations by year
- 2026: 8 · 2025: 17 · 2024: 12 · 2023: 7 · 2022: 13 · 2021: 10 · 2020: 6 · 2019: 5
- FWCI
- 4.27
- Type
- journal article
- Language
- en
- Open access
- gold
- dx.doi.org
- Licence
- Locations
- Sensors (publishedVersion, cc-by)
- Europe PMC (PubMed Central) (publishedVersion, cc-by)
- PubMed Central (publishedVersion, cc-by)
- PubMed (publishedVersion)
- DOAJ (DOAJ: Directory of Open Access Journals) (submittedVersion, cc-by-sa)
- Publication Database GFZ (GFZ German Research Centre for Geosciences) (submittedVersion)
- Publication Database GFZ (GFZ German Research Centre for Geosciences) (submittedVersion, other-oa)
- Publication Database GFZ (GFZ German Research Centre for Geosciences) (submittedVersion, cc-by)
- Funders
- National Aeronautics and Space Administration
- Topics
- Physical Sciences › Engineering › Aerospace Engineering › GNSS positioning and interference
- Physical Sciences › Earth and Planetary Sciences › Space and Planetary Science › Ionosphere and magnetosphere dynamics
- Physical Sciences › Mathematics › Applied Mathematics › Statistical and numerical algorithms
- Keywords
- precise point positioning, geomagnetic storms, solar cycle 24, ionospheric disturbances, total electron content, cycle slips, single-frequency PPP, positioning accuracy, space weather
About these checks
Registry, retraction, Cites and statistics results are computed, not judged, with one exception: a printed reference that no index lists is read once by a model before it counts as a citation error. Claims are extracted by a model and kept only when their quote appears verbatim in the text; each cited source is then checked, with a model’s help, for whether it says what the claim relies on. Those verdicts can be wrong — read the claim’s quote and the cited source before relying on one.
Statistics and arithmetic are recomputed, not judged.
Confidence bands are shown only for fields calibrated on our annotated test set. None is calibrated yet, so no band is shown.
What counts as a claim ›How we measure confidence ›How we check this ›
Are you an author, or do you see a problem with this page? Request a review
How to cite
Cite CoChat for the checks on this page, and the paper for its own findings.
- This page
- CoChat. (2026). Citation check: Assessing the Performance of GPS Precise Point Positioning Under Different Geomagnetic Storm Conditions during Solar Cycle 24. https://app.cochat.ai/papers/10.3390/s18061784
- The paper
- Luo, X., Gu, S., Lou, Y., Xiong, C., Chen, B., & Jin, X. (2018). Assessing the Performance of GPS Precise Point Positioning Under Different Geomagnetic Storm Conditions during Solar Cycle 24. Sensors. https://doi.org/10.3390/s18061784
