

Feature Representation and Data Augmentation for Human Activity Classification Based on Wearable IMU Sensor Data Using a Deep LSTM Neural Network
Open accessThe DOI matches its Crossref record; 50 of the 50 references it cites were found in a registry or an index.
Abstract
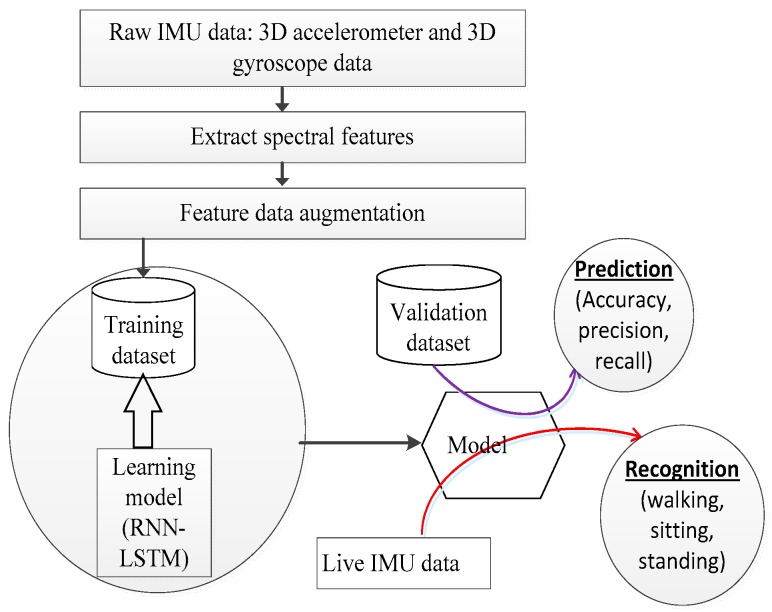
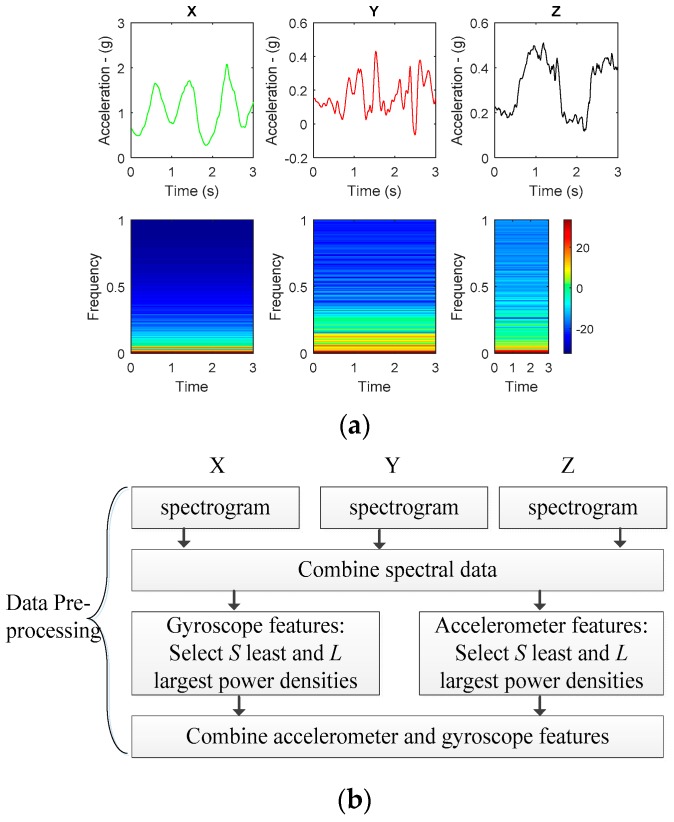
Wearable inertial measurement unit (IMU) sensors are powerful enablers for acquisition of motion data. Specifically, in human activity recognition (HAR), IMU sensor data collected from human motion are categorically combined to formulate datasets that can be used for learning human activities. However, successful learning of human activities from motion data involves the design and use of proper feature representations of IMU sensor data and suitable classifiers. Furthermore, the scarcity of labelled data is an impeding factor in the process of understanding the performance capabilities of data-driven learning models. To tackle these challenges, two primary contributions are in this article: first; by using raw IMU sensor data, a spectrogram-based feature extraction approach is proposed. Second, an ensemble of data augmentations in feature space is proposed to take care of the data scarcity problem. Performance tests were conducted on a deep long term short term memory (LSTM) neural network architecture to explore the influence of feature representations and the augmentations on activity recognition accuracy. The proposed feature extraction approach combined with the data augmentation ensemble produces state-of-the-art accuracy results in HAR. A performance evaluation of each augmentation approach is performed to show the influence on classification accuracy. Finally, in addition to using our own dataset, the proposed data augmentation technique is evaluated against the University of California, Irvine (UCI) public online HAR dataset and yields state-of-the-art accuracy results at various learning rates.
Overview
The claims and statistics of this paper haven’t been checked yet.
Free: it reads the open-access text and checks the first 5 claims that cite a source we can check. Create a free account to check every claim.
Integrity signals
Registry
Cites
Statistics
Figures
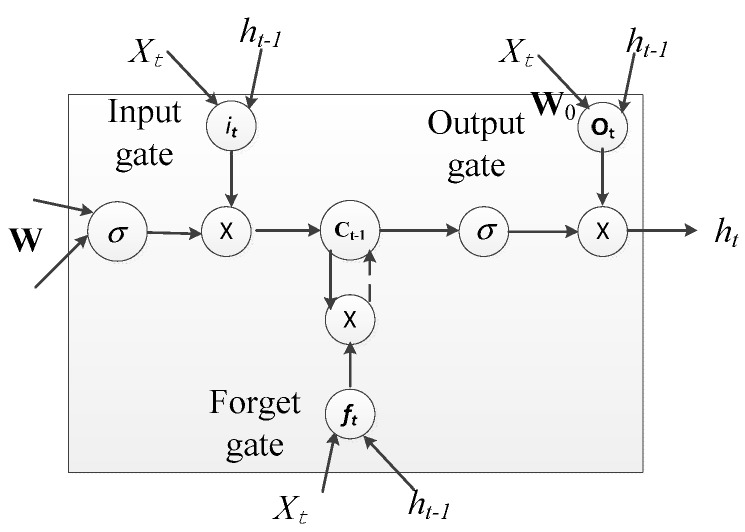
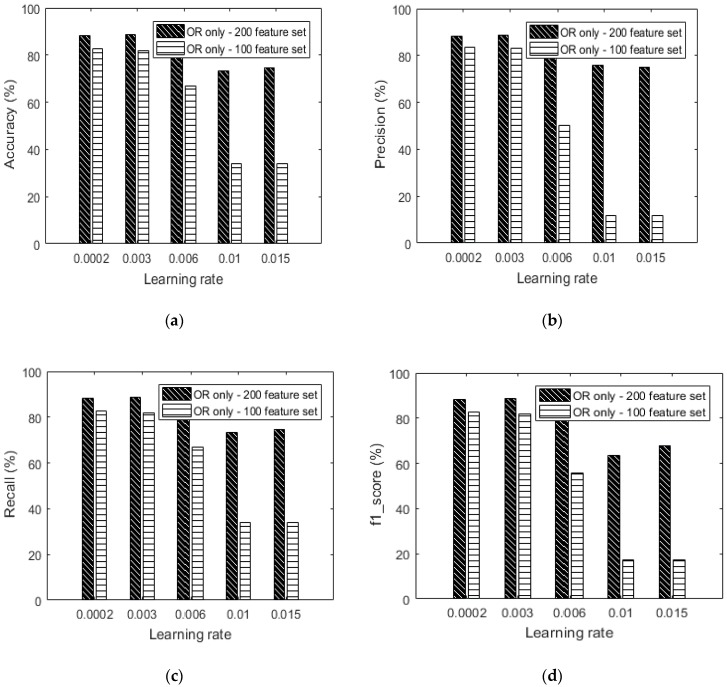
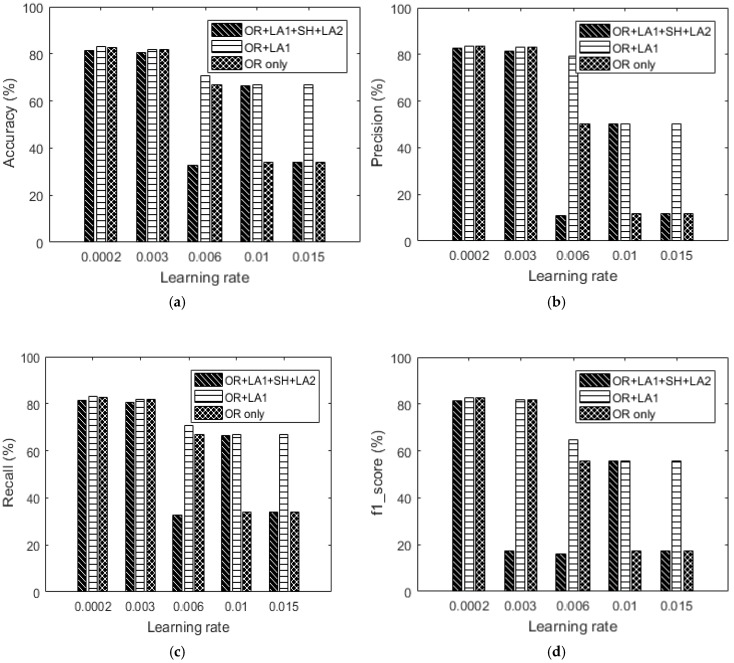
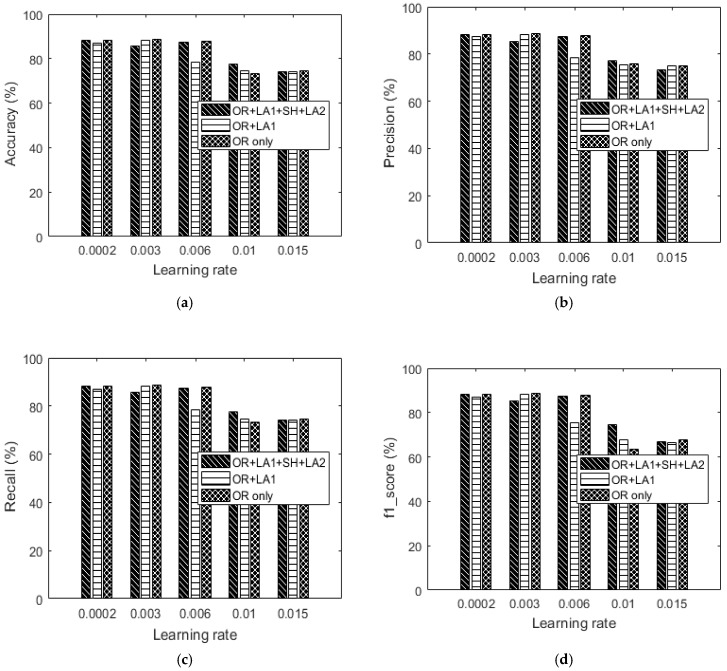
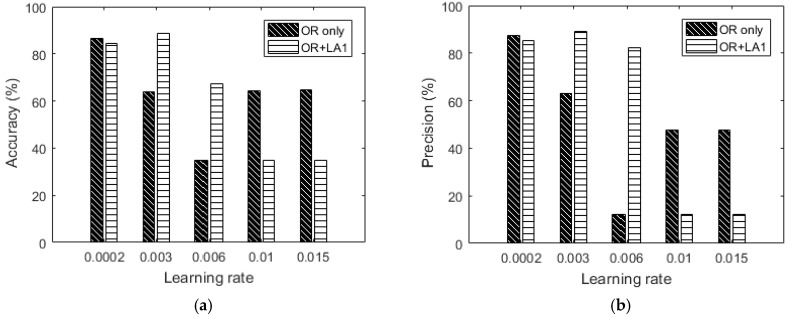
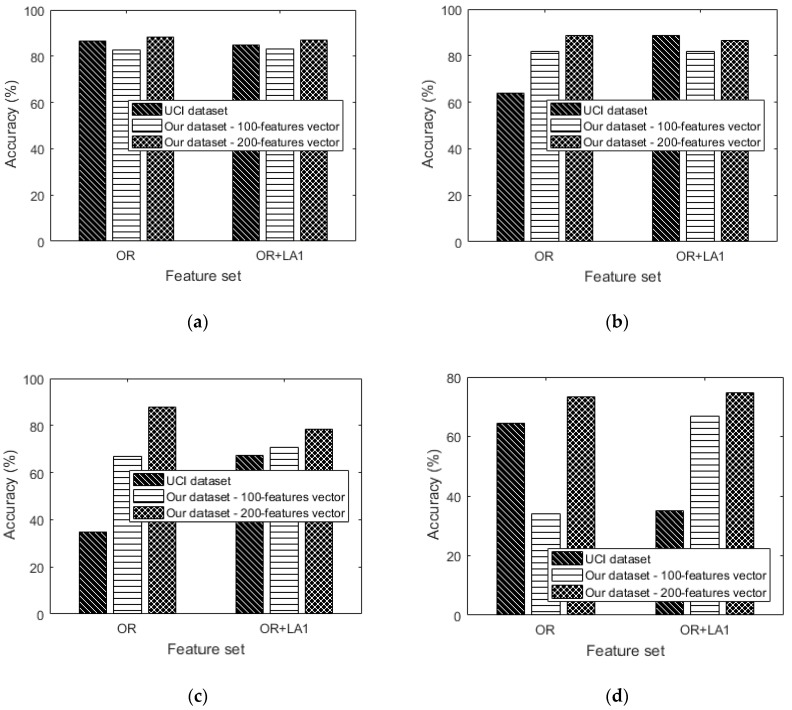
Verification
Claims the paper makes
The claims and statistics of this paper haven’t been checked yet.
Free: it reads the open-access text and checks the first 5 claims that cite a source we can check. Create a free account to check every claim.
Claims other papers make about this one
Each is checked against this paper’s own text: does it say what the citing paper says it does?
The cited source says what the claim attributes to it.
In the citing paper
“In sensor-based HAR leveraging the temporal nature of IMU signals allows for the application of augmentation methods grounded in signal processing [32,34,99,132,141,178,193].”
From Past, Present, and Future of Sensor-based Human Activity Recognition Using Wearables: A Surveying Tutorial on a Still Challenging Task (2025) · cites this paper as [178]
Experimental — accuracy not yet measuredIn the citing paper
“In general, using the dataset augmented with synthetic training samples yields higher classification accuracy when compared to using the original dataset [36,56,261,262].”
From Deep Learning in Human Activity Recognition with Wearable Sensors: A Review on Advances (2022) · cites this paper as [261]
Self-check
Percentages, sums and reported differences re-computed from the paper’s own numbers.
The self-check needs the paper’s full text.
Citations
Cites
SMOTE synthetic minority over-sampling technique
Chawla, N. V., Bowyer, K. W., Hall, L. O., & Kegelmeyer, W. P. (2002) · Journal of Artificial Intelligence Research · doi:10.1613/jair.953 · Cited by 32,865 · cited 1×
“The synthetic minority over-sampling technique (SMOTE) by [49] is the most popular of these.”
MethodHe, H., & Garcia, E. A. (2009) · IEEE Transactions on Knowledge and Data Engineering · doi:10.1109/tkde.2008.239 · Cited by 10,359
Saito, T., & Rehmsmeier, M. (2015) · PLOS ONE · doi:10.1371/journal.pone.0118432 · Cited by 5,309 · cited 1×
“This phenomenon is common in binary classification [19,20] where only two classes are involved.”
BackgroundTwo-dimensional pca: a new approach to appearance-based face representation and recognition
Yang, J., Zhang, D., Frangi, A. F., & Yang, J.-Y. (2004) · IEEE Transactions on Pattern Analysis and Machine Intelligence · doi:10.1109/tpami.2004.1261097 · Cited by 3,563
Activity recognition using cell phone accelerometers
Kwapisz, J. R., Weiss, G. M., & Moore, S. A. (2011) · ACM SIGKDD Explorations Newsletter · doi:10.1145/1964897.1964918 · Cited by 2,912 · cited 2×
“…standard deviation [36,37], root mean square [38,39], zero or mean crossing rate [40], derivative, peak counts [41,42] Human activity recognition [37,38], speech recognition [39], eye movement analysis [42] Frequency-domain Discrete fast Fourier transforms coefficient, spectral energy [7,43]…”
BackgroundThe recognition of human movement using temporal templates
Bobick, A. F., & Davis, J. W. (2001) · IEEE Transactions on Pattern Analysis and Machine Intelligence · doi:10.1109/34.910878 · Cited by 2,811 · cited 1×
“Various feature extraction approaches in image processing include using the spatio-temporal interest point (STIP) [27] detector, motion–energy images (MEI) and motion history images (MHI) [28].”
BackgroundOpensmile: the munich versatile and fast open-source audio feature extractor
Eyben, F., Wöllmer, M., & Schuller, B. (2010) · Proceedings of the 18th ACM international conference on Multimedia · doi:10.1145/1873951.1874246 · Cited by 2,642 · cited 1×
“Time-domain Mean [35], variance, standard deviation [36,37], root mean square [38,39], zero or mean crossing rate [40], derivative, peak counts [41,42] Human activity recognition [37,38], speech recognition [39], eye movement analysis [42]”
BackgroundLaptev, I. (2005) · International Journal of Computer Vision · doi:10.1007/s11263-005-1838-7 · Cited by 2,629
(2013) · RECERCAT (Consorci de Serveis Universitaris de Catalunya) · Cited by 1,959
Activity recognition from accelerometer data
Ravi, N., Dandekar, N., Mysore, P., & Littman, M. L. (2005) · Innovative Applications of Artificial Intelligence · Cited by 1,775
Research works printed but not linked: 5
- Eyobu, O.S., Kim, Y., and Han, D.S. (2017, January 21–23). Activity Recognition for Infant Health Care Based on Wireless Inertial Measurement Unit Motion Data. Proceedings of the Korean Institute of Communication Sciences Conference, Jeju, Korea.
- Ohashi, H., Al-Nasser, M., Ahmed, S., Akiyama, T., Sato, T., Nguyen, P., Nakamura, K., and Dengel, A. (2017, January 6–11). Augmenting Wearable Sensor Data with Physical Constraint for DNN-Based Human-Action Recognition. Presented at ICML 2017 Times Series Workshop, Sydney, Australia.
- Bächlin, M., Förster, K., and Tröster, G. (October, January 30). SwimMaster: A wearable assistant for swimmer. Proceedings of the 11th International Conference on Ubiquitous Computing, Orlando, FL, USA.
- Cui, Z., Chen, W., and Chen, Y. (arXiv, 2016). Multi-scale convolutional neural networks for time series classification, arXiv.
- DeVries, T., and Taylor, G.W. (arXiv, 2017). Dataset Augmentation in Feature Space, arXiv.
Cited by
Time Series Data Augmentation for Deep Learning: A Survey
Wen, Q., Sun, L., Yang, F., Song, X., Gao, J., Wang, X., & Xu, H. (2021) · Proceedings of the Thirtieth International Joint Conference on Artificial Intelligence · doi:10.24963/ijcai.2021/631 · Cited by 727
An empirical survey of data augmentation for time series classification with neural networks
Iwana, B. K., & Uchida, S. (2021) · PLOS ONE · doi:10.1371/journal.pone.0254841 · Cited by 725
“For most datasets, this is not a problem, but ones with long time series, such as HandOutlines with 2,709 time steps, can take extraordinary amounts of time compared to the transformation-based methods.”
MethodInfluentialQiu, S., Zhao, H., Jiang, N., Wang, Z., Liu, L., An, Y., Zhao, H., Miao, X., Liu, R., & Fortino, G. (2022) · Information Fusion · doi:10.1016/j.inffus.2021.11.006 · Cited by 671
Deep Learning in Human Activity Recognition with Wearable Sensors: A Review on Advances
Zhang, S., Li, Y., Zhang, S., Shahabi, F., Xia, S., Deng, Y., & Alshurafa, N. (2022) · Sensors · doi:10.3390/s22041476 · Cited by 625
A CNN-LSTM Approach to Human Activity Recognition
Mutegeki, R., & Han, D. S. (2020) · 2020 International Conference on Artificial Intelligence in Information and Communication (ICAIIC) · doi:10.1109/icaiic48513.2020.9065078 · Cited by 452
“Eyobu and Han [8] employed an LSTM network to classify a dataset with frequency domain features extracted, as opposed to the raw signal which differs from our approach.”
BackgroundMethodInfluentialSelf-citation
Metadata
- Authors
- Steven Eyobu, O., & Han, D. S.
- Affiliations
- School of Electronics Engineering, Kyungpook National University, 80 Daehak-ro, Buk-gu, Daegu 41566, Korea
- Kyungpook National University (KR)
- Corresponding author
- Han, Dong Seog
- Venue
- Sensors
- Publisher
- MDPI AG
- Published
- 2018-08-31
- Volume
- 18
- Issue
- 9
- Pages
- 2892
- ISSN
- 1424-8220 (ISSN-L)
- PMC
- PMC6165524
- OpenAlex
- W2889505988
- Cited by
- 259
- References
- 50
- Citations by year
- 2026: 15 · 2025: 27 · 2024: 36 · 2023: 45 · 2022: 32 · 2021: 55 · 2020: 31 · 2019: 17 · 2018: 1
- FWCI
- 13.01
- Type
- journal article
- Language
- en
- Open access
- gold
- dx.doi.org
- Licence
- Locations
- Sensors (publishedVersion, cc-by)
- Europe PMC (PubMed Central) (publishedVersion, other-oa)
- PubMed Central (publishedVersion, cc-by)
- PubMed (publishedVersion)
- DOAJ (DOAJ: Directory of Open Access Journals) (submittedVersion, cc-by-sa)
- Funders
- Institute for Information and communications Technology Promotion (R7124-16- 0004)
- Topics
- Physical Sciences › Computer Science › Computer Vision and Pattern Recognition › Context-Aware Activity Recognition Systems
- Physical Sciences › Engineering › Biomedical Engineering › Gait Recognition and Analysis
- Physical Sciences › Computer Science › Signal Processing › Time Series Analysis and Forecasting
- Keywords
- human activity recognition, inertial measurement unit, spectrogram feature extraction, data augmentation, feature representation, LSTM neural network, labeled data scarcity, UCI HAR dataset
- MeSH terms
- Wearable Electronic Devices, Deep Learning, Humans, Human Activities, Movement, Neural Networks, Computer
About these checks
Registry, retraction, Cites and statistics results are computed, not judged, with one exception: a printed reference that no index lists is read once by a model before it counts as a citation error. Claims are extracted by a model and kept only when their quote appears verbatim in the text; each cited source is then checked, with a model’s help, for whether it says what the claim relies on. Those verdicts can be wrong — read the claim’s quote and the cited source before relying on one.
Statistics and arithmetic are recomputed, not judged.
Confidence bands are shown only for fields calibrated on our annotated test set. None is calibrated yet, so no band is shown.
What counts as a claim ›How we measure confidence ›How we check this ›
Are you an author, or do you see a problem with this page? Request a review
How to cite
Cite CoChat for the checks on this page, and the paper for its own findings.
- This page
- CoChat. (2026). Citation check: Feature Representation and Data Augmentation for Human Activity Classification Based on Wearable IMU Sensor Data Using a Deep LSTM Neural Network. https://app.cochat.ai/papers/10.3390/s18092892
- The paper
- Steven Eyobu, O., & Han, D. S. (2018). Feature Representation and Data Augmentation for Human Activity Classification Based on Wearable IMU Sensor Data Using a Deep LSTM Neural Network. Sensors. https://doi.org/10.3390/s18092892
Data sources
Bibliographic data: Semantic Scholar, OpenAlex, Crossref.
Contains information from the Semantic Scholar Academic Graph Datasets, made available under the ODC Attribution License (ODC-BY 1.0).
Semantic Scholar’s data is described in: Kinney, R., et al. (2023). The Semantic Scholar Open Data Platform. arXiv:2301.10140.
