

Fatigue Crack Evaluation with the Guided Wave–Convolutional Neural Network Ensemble and Differential Wavelet Spectrogram
Open accessThe DOI matches its Crossref record; 52 of the 52 references it cites were found in a registry or an index.
Abstract
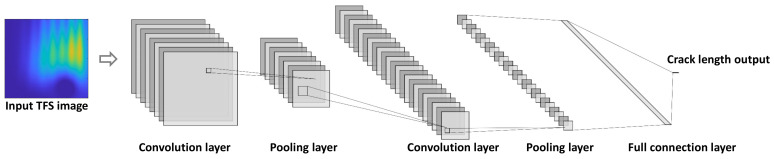
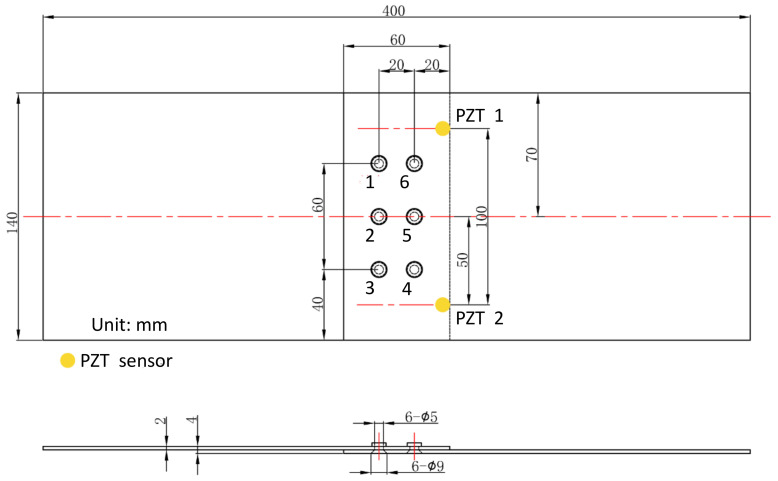
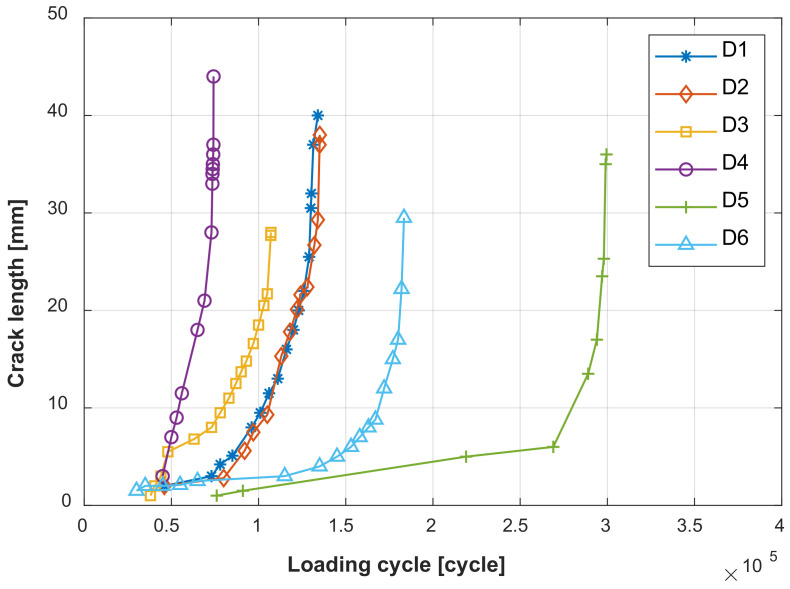
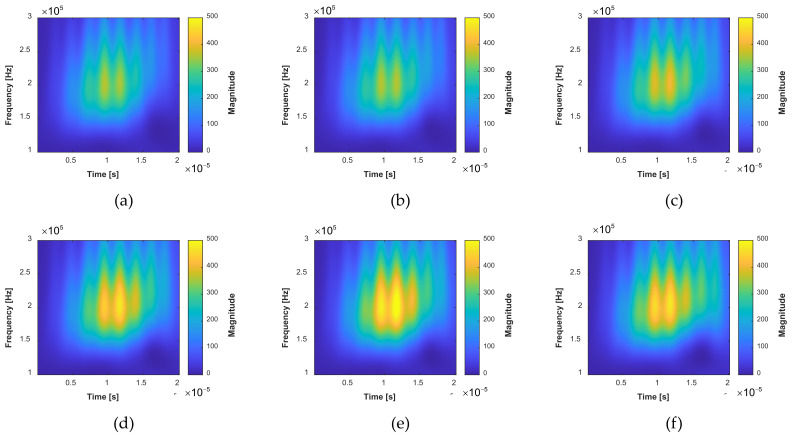
On-line fatigue crack evaluation is crucial for ensuring the structural safety and reducing the maintenance costs of safety-critical systems. Among structural health monitoring (SHM), guided wave (GW)-based SHM has been deemed as one of the most promising techniques. However, the traditional damage index-based method and machine learning methods require manual processing and selection of GW features, which depend highly on expert knowledge and are easily affected by complicated uncertainties. Therefore, this paper proposes a fatigue crack evaluation framework with the GW–convolutional neural network (CNN) ensemble and differential wavelet spectrogram. The differential time–frequency spectrogram between the baseline signal and the monitoring signal is processed as the CNN input with the complex Gaussian wavelet transform. Then, an ensemble of CNNs is trained to jointly determine the crack length. Real fatigue tests on complex lap joint structures were carried out to validate the proposed method, in which several structures were tested preliminarily for collecting the training dataset and a new structure was adopted for testing. The root mean square error of the training dataset is 1.4 mm. Besides, the root mean square error of the evaluated crack length in the testing lap joint structure was 1.7 mm, showing the effectiveness of the proposed method.
Overview
The claims and statistics of this paper haven’t been checked yet.
Free: it reads the open-access text and checks the first 5 claims that cite a source we can check. Create a free account to check every claim.
Integrity signals
Registry
Cites
Statistics
Figures







Verification
Claims the paper makes
The claims and statistics of this paper haven’t been checked yet.
Free: it reads the open-access text and checks the first 5 claims that cite a source we can check. Create a free account to check every claim.
Claims other papers make about this one
Each is checked against this paper’s own text: does it say what the citing paper says it does?
The cited source says what the claim attributes to it.
In the citing paper
“Currently, the most commonly used SHM methods are vibration-based SHM [14,15,16,17,18], AE-based SHM [9,19,20], Guided Wave (GW) based SHM [21,22,23,24,25], and Electro-Mechanical Impedance (EMI) based SHM [26,27].”
From Deep Learning for Structural Health Monitoring: Data, Algorithms, Applications, Challenges, and Trends (2023) · cites this paper as [21]
Self-check
Percentages, sums and reported differences re-computed from the paper’s own numbers.
The self-check needs the paper’s full text.
Citations
Cites
ImageNet classification with deep convolutional neural networks
Krizhevsky, A., Sutskever, I., & Hinton, G. E. (2017) · Communications of the ACM · doi:10.1145/3065386 · Cited by 112,155 · cited 1×
“The dropout layer randomly sets input elements to zero with a given probability during training to deactivate a part of neurons on a particular layer [47].”
BackgroundDeep learning and its applications to machine health monitoring
Zhao, R., Yan, R., Chen, Z., Mao, K., Wang, P., & Gao, R. X. (2019) · Mechanical Systems and Signal Processing · doi:10.1016/j.ymssp.2018.05.050 · Cited by 2,894
Review of Deep Learning Algorithms and Architectures
Shrestha, A., & Mahmood, A. (2019) · IEEE Access · doi:10.1109/access.2019.2912200 · Cited by 1,883 · cited 1×
“Recently, deep learning has already made a huge impact in areas such as cancer diagnosis, precision medicine, self-driving cars, predictive forecasting, and speech recognition [21].”
BackgroundAzimi, M., Eslamlou, A., & Pekcan, G. (2020) · Sensors · doi:10.3390/s20102778 · Cited by 769 · cited 1×
“More and more attention is paid to deep learning-based diagnosis due to its strong feature extraction and features fusion capability [22], especially for the fault diagnosis of rotary machines [23–25] and vision-based crack detection in infrastructures [26,27].”
BackgroundTHE CONTINUOUS WAVELET TRANSFORM: MOVING BEYOND UNI‐ AND BIVARIATE ANALYSIS
Aguiar‐Conraria, L., & Soares, M. J. (2014) · Journal of Economic Surveys · doi:10.1111/joes.12012 · Cited by 714 · cited 1×
“The continuous wavelet transform [42] is a powerful tool to explore the characteristics of nonperiodic and transient signals such as GW signals in the time–frequency domain.”
MethodPiezoelectric Transducer-Based Structural Health Monitoring for Aircraft Applications
Qing, X., Li, W., Wang, Y., & Sun, H. (2019) · Sensors · doi:10.3390/s19030545 · Cited by 446 · cited 3×
“Among them, the guided wave (GW)-based SHM [11–13] has been deemed as one of the most promising techniques due to its sensitivity to small damages and capability of monitoring a region that is sometimes inaccessible [14].”
BackgroundMethodAtha, D. J., & Jahanshahi, M. R. (2018) · Structural Health Monitoring · doi:10.1177/1475921717737051 · Cited by 372
Improvement of learning for CNN with ReLU activation by sparse regularization
Ide, H., & Kurita, T. (2017) · 2017 International Joint Conference on Neural Networks (IJCNN) · doi:10.1109/ijcnn.2017.7966185 · Cited by 317 · cited 1×
“Usually, the rectified linear unit (ReLU) activation function is preferred in deep learning because it has a simpler derivative result, leading to faster training and avoiding the gradient diffusion problem [46].”
BackgroundConvolutional Discriminative Feature Learning for Induction Motor Fault Diagnosis
Sun, W., Zhao, R., Yan, R., Shao, S., & Chen, X. (2017) · IEEE Transactions on Industrial Informatics · doi:10.1109/tii.2017.2672988 · Cited by 295 · cited 1×
“More and more attention is paid to deep learning-based diagnosis due to its strong feature extraction and features fusion capability [22], especially for the fault diagnosis of rotary machines [23–25] and vision-based crack detection in infrastructures [26,27].”
BackgroundPIEZOELECTRIC WAFER ACTIVE SENSORS
Giurgiutiu, V. (2008) · Structural Health Monitoring · doi:10.1016/b978-012088760-6.50008-8 · Cited by 275
Research works printed but not linked: 1
- Kingma, D.P., and Ba, J.L. (2017). Adam: A Method for Stochastic Optimization. arXiv, Available online: https://arxiv.org/abs/1412.6980. · arXiv
Cited by
Jia, J., & Li, Y. (2023) · Sensors · doi:10.3390/s23218824 · Cited by 182
“Chen et al. [21] used two PZT sensors to collect the GW signal of the original state of the aluminum plate and the GW signal during the gradual generation of fatigue cracks.”
MethodYousry, Y. M., Wong, V., Ji, R., Chen, Y., Chen, S., Zhang, X., Lim, D. B. K., Shen, L., & Yao, K. (2023) · Advanced Functional Materials · doi:10.1002/adfm.202213582 · Cited by 78
Wang, Y., Cui, X., Liu, Q., Zhao, B., Liao, Y., & Qing, X. (2023) · Composite Structures · doi:10.1016/j.compstruct.2023.117742 · Cited by 20
FEM Simulation-Based Adversarial Domain Adaptation for Fatigue Crack Detection Using Lamb Wave
Wang, L., Liu, G., Zhang, C., Yang, Y., & Qiu, J. (2023) · Sensors · doi:10.3390/s23041943 · Cited by 14
An improved probabilistic diagnosis imaging algorithm for quantifying Hole-edge crack growth
Sun, H., Hou, J., Chen, W., Wang, Y., & Qing, X. (2023) · Measurement · doi:10.1016/j.measurement.2023.112881 · Cited by 11
Metadata
- Authors
- Chen, J., Wu, W., Ren, Y., & Yuan, S.
- Affiliations
- State Key Laboratory of Mechanical Structure Mechanics and Control (CN)
- Corresponding author
- Yuan, Shenfang
- Venue
- Sensors
- Publisher
- MDPI AG
- Published
- 2021-12-31
- Volume
- 22
- Issue
- 1
- Pages
- 307
- ISSN
- 1424-8220 (ISSN-L)
- PMC
- PMC8749601
- OpenAlex
- W4205829692
- Cited by
- 29
- References
- 51
- Citations by year
- 2026: 5 · 2025: 9 · 2024: 6 · 2023: 8 · 2022: 1
- FWCI
- 1.83
- Type
- journal article
- Language
- en
- Open access
- gold
- doi.org
- Licence
- Locations
- Sensors (publishedVersion, cc-by)
- PubMed Central (publishedVersion, cc-by)
- PubMed (publishedVersion)
- DOAJ (DOAJ: Directory of Open Access Journals) (submittedVersion, cc-by-sa)
- Funders
- Foundation for Innovative Research Groups of the National Natural Science Foundation of China (51921003)
- Key Program of National Natural Science Foundation of China (51635008)
- Jiangsu Provincial Key Research and Development Program of China (BE2018123)
- Research Fund of State Key Laboratory of Mechanics and Control of Mechanical Structures (Nan-jing University of Aeronautics and astronautics) (MCMS-I-0521K01)
- Priority Academic Program Development of Jiangsu Higher Education Institutions of China (none)
- Topics
- Physical Sciences › Engineering › Mechanics of Materials › Ultrasonics and Acoustic Wave Propagation
- Physical Sciences › Engineering › Civil and Structural Engineering › Structural Health Monitoring Techniques
- Physical Sciences › Engineering › Mechanical Engineering › Non-Destructive Testing Techniques
- Keywords
- guided wave inspection, ensemble convolutional neural networks, crack sizing, structural health monitoring, lap joints, time-frequency analysis
- MeSH terms
- Machine Learning, Normal Distribution, Neural Networks, Computer, Wavelet Analysis
About these checks
Registry, retraction, Cites and statistics results are computed, not judged, with one exception: a printed reference that no index lists is read once by a model before it counts as a citation error. Claims are extracted by a model and kept only when their quote appears verbatim in the text; each cited source is then checked, with a model’s help, for whether it says what the claim relies on. Those verdicts can be wrong — read the claim’s quote and the cited source before relying on one.
Statistics and arithmetic are recomputed, not judged.
Confidence bands are shown only for fields calibrated on our annotated test set. None is calibrated yet, so no band is shown.
What counts as a claim ›How we measure confidence ›How we check this ›
Are you an author, or do you see a problem with this page? Request a review
Data sources
Bibliographic data: Semantic Scholar, OpenAlex, Crossref.
Contains information from the Semantic Scholar Academic Graph Datasets, made available under the ODC Attribution License (ODC-BY 1.0).
Semantic Scholar’s data is described in: Kinney, R., et al. (2023). The Semantic Scholar Open Data Platform. arXiv:2301.10140.
