

The DOI matches its Crossref record; the references it cites are not checked yet.
Distinct Transcriptional Changes in Response to Patulin Underlie Toxin Biosorption Differences in Saccharomyces cerevisiae
Open accessAbstract
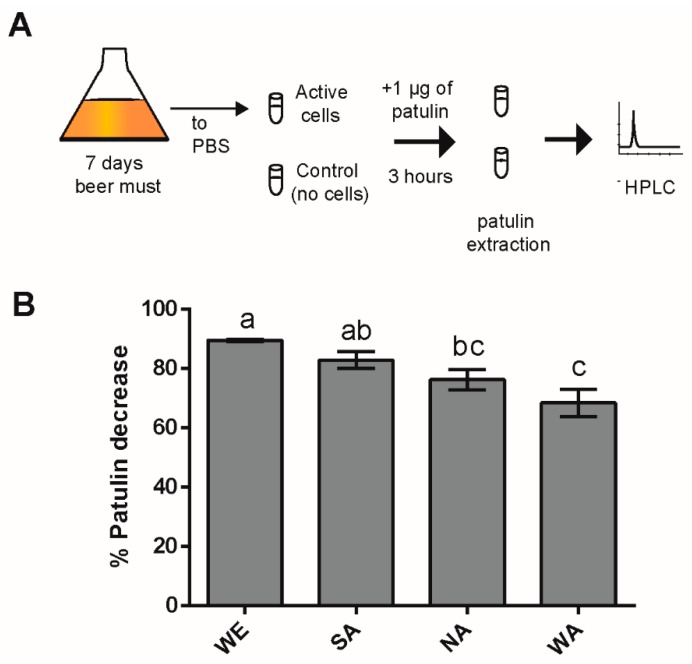
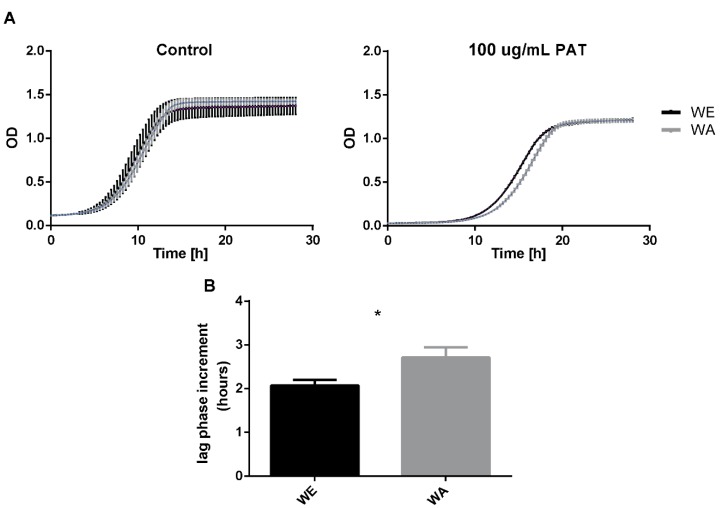
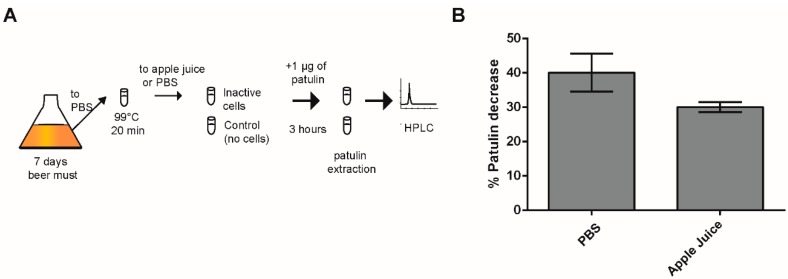
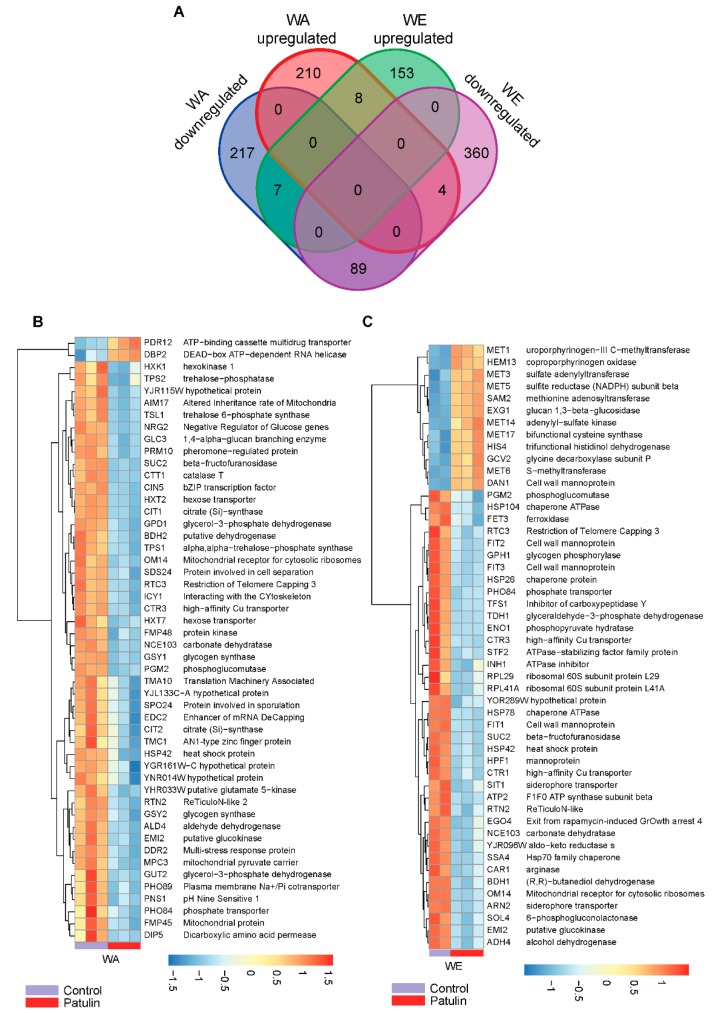
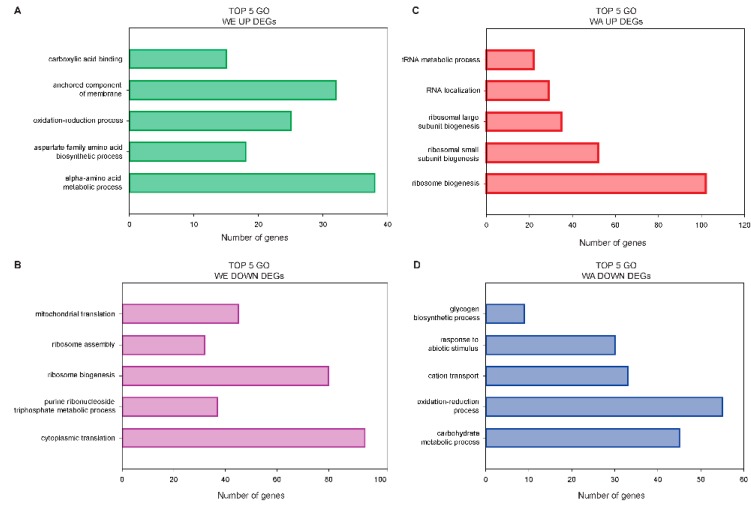
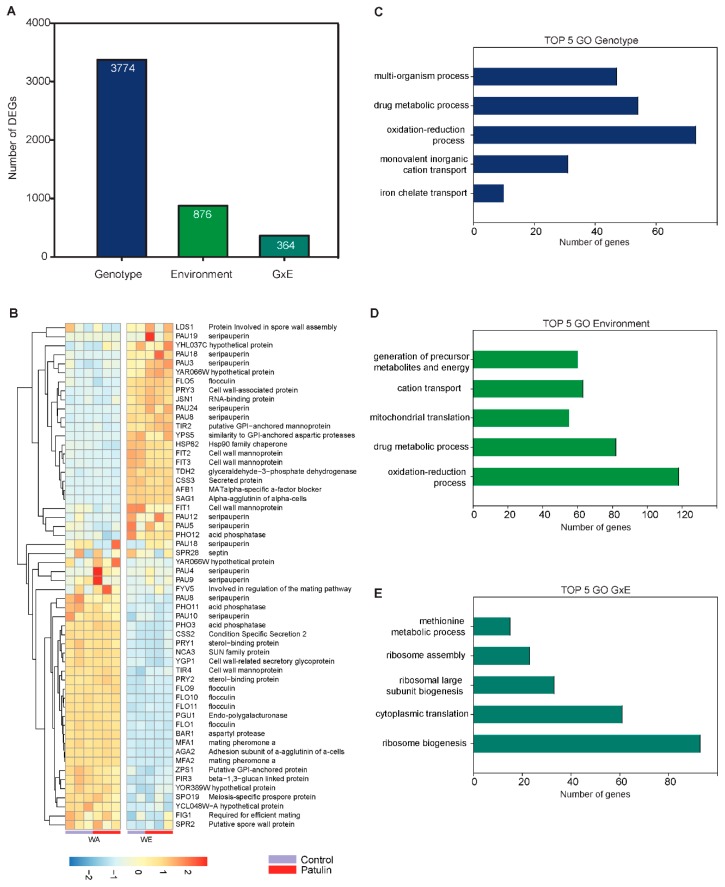
Patulin (4-hydroxy-4H-furo[3,2c]pyran-2[6H]-one) is a mycotoxin produced by a suite of fungi species. Patulin is toxic to humans and is a sporadic contaminant in products that were made from fungi-infected fruits. The baker yeast Saccharomyces cerevisiae (S. cerevisiae) has been shown to decrease patulin levels likely by converting it to the less harmful E-ascladiol, yet this capacity is dependent on the strain utilized. In this study we show that four representative strains of different S. cerevisiae lineages differ in their ability to tolerate and decrease patulin levels in solution, demonstrating that some strains are better suitable for patulin biocontrol. Indeed, we tested the biocontrol capacities of the best patulin-reducer strain (WE) in contaminated apple juice and demonstrated their potential role as an efficient natural biocontrol solution. To investigate the mechanisms behind the differences between strains, we explored transcriptomic changes of the top (WE strain) and worst (WA strain) patulin-biocontroller strains after being exposed to this toxin. Large and significant gene expression differences were found between these two strains, the majority of which represented genes associated with protein biosynthesis, cell wall composition and redox homeostasis. Interestingly, the WE isolate exhibited an overrepresentation of up-regulated genes involved in membrane components, suggesting an active role of the membrane towards patulin detoxification. In contrast, WA upregulated genes were associated with RNA metabolism and ribosome biogenesis, suggesting a patulin impact upon transcription and translation activity. These results suggest that different genotypes of S. cerevisiae encounter different stresses from patulin toxicity and that different rates of detoxification of this toxin might be related with the plasma membrane composition. Altogether, our data demonstrates the different molecular mechanisms in S. cerevisiae strains withstanding patulin exposure and opens new avenues for the selection of new patulin biocontroller strains.
Overview
The claims and statistics of this paper haven’t been checked yet.
Run the check — free, no account needed. It reads the open-access text and checks the sources it cites.
Integrity signals
Registry
Cites
Statistics
Figures
Verification
Claims the paper makes
The claims and statistics of this paper haven’t been checked yet.
Run the check — free, no account needed. It reads the open-access text and checks the sources it cites.
Claims other papers make about this one
Each is checked against this paper’s own text: does it say what the citing paper says it does?
The source backs part of the claim, not all of it — or backs it for a different population, condition or comparison.
In the citing paper
“The mycotoxin-removing activity is due to adsorption to S. cerevisiae cell walls, stress responses to the toxin (e.g., changes in plasma membrane composition following patulin exposure), as well as direct transcriptional downregulation of polyketide synthesis (Armando et al. 2012b; Cubaiu et al. 2012; Oporto et al. 2019).”
From Biocontrol yeasts: mechanisms and applications (2019) · cites this paper as Oporto et al. 2019
Experimental — accuracy not yet measured
Self-check
Percentages, sums and reported differences re-computed from the paper’s own numbers.
The self-check needs the paper’s full text.
Citations
The citation lists are queued
They are fetched later and appear here then.
References 63 · Cited by 12
Research works printed but not linked: 62
- Capcarova, 2016, Environment contamination by mycotoxins and their occurrence in food and feed: Physiological aspects and economical approach, J. Environ. Sci. Health B, 51, 236, 10.1080/03601234.2015.1120617 · DOI
- Dalie, 2010, Potential of Pediococcus pentosaceus (L006) isolated from maize leaf to suppress fumonisin-producing fungal growth, J. Food Prot., 73, 1129, 10.4315/0362-028X-73.6.1129 · DOI
- Wu, 2014, Public health impacts of foodborne mycotoxins, Annu. Rev. Food Sci. Technol., 5, 351, 10.1146/annurev-food-030713-092431 · DOI
- Mansilla, 2010, Mycotoxins in fruits and their processed products: Analysis, occurrence and health implications, J. Adv. Res., 1, 113, 10.1016/j.jare.2010.03.002 · DOI
- Moss, 2008, Fungi, quality and safety issues in fresh fruits and vegetables, J. Appl. Microbiol., 104, 1239, 10.1111/j.1365-2672.2007.03705.x · DOI
- Llewellyn, 1998, Immunological evaluation of the mycotoxin patulin in female B6C3F1 mice, Food Chem. Toxicol., 36, 1107, 10.1016/S0278-6915(98)00084-2 · DOI
- Mahfoud, 2002, The mycotoxin patulin alters the barrier function of the intestinal epithelium: Mechanism of action of the toxin and protective effects of glutathione, Toxicol. Appl. Pharmacol., 181, 209, 10.1006/taap.2002.9417 · DOI
- Puel, 2010, Biosynthesis and Toxicological Effects of Patulin, Toxins, 2, 613, 10.3390/toxins2040613 · DOI
- Zhong, L., Carere, J., Lu, Z., Lu, F., and Zhou, T. (2018). Patulin in Apples and Apple-Based Food Products: The Burdens and the Mitigation Strategies. Toxins, 10. · DOI
- Bandoh, 2009, Patulin distribution in decayed apple and its reduction, Int. Biodeter. Biodegr., 63, 379, 10.1016/j.ibiod.2008.10.010 · DOI
- Ioi, J.D., Zhou, T., Tsao, R., and Marcone, M.F. (2017). Mitigation of Patulin in Fresh and Processed Foods and Beverages. Toxins, 9. · DOI
- Errampalli, 2004, Effect of fludioxonil on germination and growth of Penicillium expansum and decay in apple cvs. Empire and Gala, Crop Prot., 23, 811, 10.1016/j.cropro.2003.12.010 · DOI
- Sharma, 2009, Biological control of postharvest diseases of fruits and vegetables by microbial antagonists: A review, Biol. Control., 50, 205, 10.1016/j.biocontrol.2009.05.001 · DOI · Paper page
- Funes, 2013, Application of pulsed light to patulin reduction in McIlvaine buffer and apple products, Food Control, 30, 405, 10.1016/j.foodcont.2012.09.001 · DOI
- Dong, 2010, Reduction of patulin in apple cider by UV radiation, J. Food Prot., 73, 69, 10.4315/0362-028X-73.1.69 · DOI
- Sands, 1976, Use of activated charcoal for the removal of patulin from cider, Appl. Environ. Microbiol., 32, 388, 10.1128/aem.32.3.388-391.1976 · DOI
- Topcu, 2010, Detoxification of aflatoxin B1 and patulin by Enterococcus faecium strains, Int. J. Food Microbiol., 139, 202, 10.1016/j.ijfoodmicro.2010.03.006 · DOI
- Yue, 2011, Reducing patulin contamination in apple juice by using inactive yeast, J. Food Prot., 74, 149, 10.4315/0362-028X.JFP-10-326 · DOI
- Coelho, 2008, Patulin biodegradation using Pichia ohmeri and Saccharomyces cerevisiae, World Mycotoxin J., 1, 325, 10.3920/WMJ2008.1040 · DOI
- Stinson, 1978, Disappearance of patulin during alcoholic fermentation of apple juice, Appl. Environ. Microbiol., 36, 620, 10.1128/aem.36.4.620-622.1978 · DOI
- Moss, 2002, Fate of patulin in the presence of the yeast Saccharomyces cerevisiae, Food Addit. Contam., 19, 387, 10.1080/02652030110091163 · DOI
- Tannous, 2017, Patulin transformation products and last intermediates in its biosynthetic pathway, E- and Z-ascladiol, are not toxic to human cells, Arch. Toxicol., 91, 2455, 10.1007/s00204-016-1900-y · DOI
- Ramalingam, 2019, The effects of mycotoxin patulin on cells and cellular components, Trends Food Sci. Technol., 83, 99, 10.1016/j.tifs.2018.10.010 · DOI
- Pfenning, 2016, The mycotoxin patulin reacts with DNA bases with and without previous conjugation to GSH: Implication for related α, β-unsaturated carbonyl compounds?, Arch. Toxicol., 90, 433, 10.1007/s00204-014-1443-z · DOI
- Ianiri, 2016, Transcriptomic responses of the basidiomycete yeast Sporobolomyces sp. to the mycotoxin patulin, BMC Genom., 17, 210, 10.1186/s12864-016-2550-4 · DOI
- Iwahashi, 2006, Mechanisms of Patulin Toxicity under Conditions That Inhibit Yeast Growth, J. Agric. Food Chem., 54, 1936, 10.1021/jf052264g · DOI
- Yiannikouris, 2004, Alkali Extraction of β-d-Glucans from Saccharomyces cerevisiae Cell Wall and Study of Their Adsorptive Properties toward Zearalenone, J. Agric. Food Chem., 52, 3666, 10.1021/jf035127x · DOI
- Yiannikouris, 2006, Chemical and Conformational Study of the Interactions Involved in Mycotoxin Complexation with β-d-Glucans, Biomacromolecules, 7, 1147, 10.1021/bm050968t · DOI
- Guo, 2012, Binding mechanism of patulin to heat-treated yeast cell, Lett. Appl. Microbiol., 55, 453, 10.1111/j.1472-765x.2012.03314.x · DOI
- Luo, Y., Wang, J., Liu, B., Wang, Z., Yuan, Y., and Yue, T. (2015). Effect of Yeast Cell Morphology, Cell Wall Physical Structure and Chemical Composition on Patulin Adsorption. PLoS ONE, 10. · DOI
- Castoria, 2011, Conversion of the Mycotoxin Patulin to the Less Toxic Desoxypatulinic Acid by the Biocontrol Yeast Rhodosporidium kratochvilovae Strain LS11, J. Agric. Food Chem., 59, 11571, 10.1021/jf203098v · DOI
- Cubillos, 2016, Exploiting budding yeast natural variation for industrial processes, Curr. Genet., 62, 745, 10.1007/s00294-016-0602-6 · DOI
- Liti, 2009, Population genomics of domestic and wild yeasts, Nature, 458, 337, 10.1038/nature07743 · DOI
- Wang, 2015, A new insight into the adsorption mechanism of patulin by the heat-inactive lactic acid bacteria cells, Food Control, 50, 104, 10.1016/j.foodcont.2014.08.041 · DOI
- Bergstrom, 2014, A high-definition view of functional genetic variation from natural yeast genomes, Mol. Biol. Evol., 31, 872, 10.1093/molbev/msu037 · DOI
- Jara, M., Cubillos, F.A., Garcia, V., Salinas, F., Aguilera, O., Liti, G., and Martinez, C. (2014). Mapping genetic variants underlying differences in the central nitrogen metabolism in fermenter yeasts. PLoS ONE, 9. · DOI
- Araos, 2016, RIM15 antagonistic pleiotropy is responsible for differences in fermentation and stress response kinetics in budding yeast, FEMS Yeast Res., 16, fow021, 10.1093/femsyr/fow021 · DOI
- Zimmer, A., Durand, C., Loira, N., Durrens, P., Sherman, D.J., and Marullo, P. (2014). QTL dissection of Lag phase in wine fermentation reveals a new translocation responsible for Saccharomyces cerevisiae adaptation to sulfite. PLoS ONE, 9. · DOI
- Quispe, 2017, Genetic basis of mycotoxin susceptibility differences between budding yeast isolates, Sci. Rep., 7, 9173, 10.1038/s41598-017-09471-z · DOI
- Peter, 2018, Genome evolution across 1011 Saccharomyces cerevisiae isolates, Nature, 556, 339, 10.1038/s41586-018-0030-5 · DOI · Paper page
- Dickens, 1961, Carcinogenic activity of a series of reactive lactones and related substances, Br. J. Cancer, 15, 85, 10.1038/bjc.1961.10 · DOI
- Hanna, 2017, Induction of proteotoxic stress by the mycotoxin patulin, Toxicol. Lett., 276, 85, 10.1016/j.toxlet.2017.05.015 · DOI
- Hansen, 2000, Cysteine is essential for transcriptional regulation of the sulfur assimilation genes in Saccharomyces cerevisiae, Mol. Gen. Genet., 263, 535, 10.1007/s004380051199 · DOI
- Thorsen, 2007, Quantitative transcriptome, proteome, and sulfur metabolite profiling of the Saccharomyces cerevisiae response to arsenite, Physiol. Genom., 30, 35, 10.1152/physiolgenomics.00236.2006 · DOI
- Momose, 2001, Bioassay of cadmium using a DNA microarray: Genome-wide expression patterns of Saccharomyces cerevisiae response to cadmium, Environ. Toxicol. Chem., 20, 2353
- Piper, 1998, The pdr12 ABC transporter is required for the development of weak organic acid resistance in yeast, EMBO J., 17, 4257, 10.1093/emboj/17.15.4257 · DOI
- Saldanha, 2004, Nutritional homeostasis in batch and steady-state culture of yeast, Mol. Biol. Cell, 15, 4089, 10.1091/mbc.e04-04-0306 · DOI
- Suzuki, 2009, Mycotoxin Toxicity in Saccharomyces cerevisiae Differs Depending on Gene Mutations, Food Sci. Technol. Res., 15, 453, 10.3136/fstr.15.453 · DOI
- Abe, 2007, Induction of DAN/TIR yeast cell wall mannoprotein genes in response to high hydrostatic pressure and low temperature, FEBS Lett., 581, 4993, 10.1016/j.febslet.2007.09.039 · DOI
- Protchenko, 2001, Three Cell Wall Mannoproteins Facilitate the Uptake of Iron in Saccharomyces cerevisiae, J. Biol. Chem., 276, 49244, 10.1074/jbc.M109220200 · DOI
- Cubillos, 2011, Assessing the complex architecture of polygenic traits in diverged yeast populations, Mol. Ecol., 20, 1401, 10.1111/j.1365-294X.2011.05005.x · DOI
- Cubillos, 2009, Generation of a large set of genetically tractable haploid and diploid Saccharomyces strains, FEMS Yeast Res., 9, 1217, 10.1111/j.1567-1364.2009.00583.x · DOI
- Hall, 2013, Growth Rates Made Easy, Mol. Biol. Evol., 31, 232, 10.1093/molbev/mst187 · DOI · Paper page
- Bovo, 2012, Efficiency of Lactic Acid Bacteria Strains for Decontamination of Aflatoxin M1 in Phosphate Buffer Saline Solution and in Skimmed Milk, Food Bioprocess Technol., 6, 2230, 10.1007/s11947-011-0770-9 · DOI
- Oliveira, 2014, Cereal fungal infection, mycotoxins, and lactic acid bacteria mediated bioprotection: From crop farming to cereal products, Food Microbiol., 37, 78, 10.1016/j.fm.2013.06.003 · DOI
- Shedlovskiy, 2017, One-step hot formamide extraction of RNA from Saccharomyces cerevisiae, RNA Biol., 14, 1722, 10.1080/15476286.2017.1345417 · DOI
- Chen, 2018, Fastp: An ultra-fast all-in-one FASTQ preprocessor, Bioinformatics, 34, i884, 10.1093/bioinformatics/bty560 · DOI · Paper page
- Dobin, 2013, STAR: Ultrafast universal RNA-seq aligner, Bioinformatics, 29, 15, 10.1093/bioinformatics/bts635 · DOI · Paper page
- Liao, 2013, FeatureCounts: An efficient general purpose program for assigning sequence reads to genomic features, Bioinformatics, 30, 923, 10.1093/bioinformatics/btt656 · DOI · Paper page
- Love, 2014, Moderated estimation of fold change and dispersion for RNA-seq data with DESeq2, Genome Biol., 15, 550, 10.1186/s13059-014-0550-8 · DOI · Paper page
- Robinson, 2010, EdgeR: A Bioconductor package for differential expression analysis of digital gene expression data, Bioinformatics, 26, 139, 10.1093/bioinformatics/btp616 · DOI · Paper page
- Zhou, 2019, Metascape provides a biologist-oriented resource for the analysis of systems-level datasets, Nat. Commun., 10, 1523, 10.1038/s41467-019-09234-6 · DOI · Paper page
Metadata
- Authors
- Oporto, C., Villarroel, C., Tapia, S., García, V., & Cubillos, F.
- Affiliations
- Universidad de Santiago de Chile (CL)
- Millennium Institute for Integrative Biology (CL)
- Corresponding author
- Cubillos, Francisco
- Venue
- Toxins
- Publisher
- MDPI AG
- Published
- 2019-07-10
- Volume
- 11
- Issue
- 7
- Pages
- 400
- ISSN
- 2072-6651 (ISSN-L)
- PMC
- PMC6669508
- OpenAlex
- W2956218466
- Cited by
- 12
- References
- 63
- Citations by year
- 2025: 1 · 2024: 2 · 2023: 1 · 2022: 2 · 2021: 2 · 2020: 3 · 2019: 1
- FWCI
- 1.47
- Type
- journal article
- Language
- en
- Open access
- gold
- dx.doi.org
- Licence
- Locations
- Toxins (publishedVersion, cc-by)
- PubMed Central (publishedVersion, cc-by)
- PubMed (publishedVersion)
- DIGITAL.CSIC (Spanish National Research Council (CSIC)) (submittedVersion)
- DOAJ (DOAJ: Directory of Open Access Journals) (submittedVersion, cc-by-sa)
- Funders
- Comisión Nacional de Investigación Científica y Tecnológica (FONDECYT 1180161, FONDECYT 3170404, FONDECYT 11140097)
- Iniciativa Científica Milenio MINECON (Instituto Milenio iBio)
- Topics
- Life Sciences › Agricultural and Biological Sciences › Plant Science › Mycotoxins in Agriculture and Food
- Life Sciences › Biochemistry, Genetics and Molecular Biology › Molecular Biology › Fungal and yeast genetics research
- Life Sciences › Biochemistry, Genetics and Molecular Biology › Genetics › Bacterial Genetics and Biotechnology
- Keywords
- patulin, Saccharomyces cerevisiae, detoxification, biological control, transcriptomics, strain differences, plasma membrane composition, redox homeostasis, cell wall composition, ribosome biogenesis, RNA metabolism
- MeSH terms
- Fruit and Vegetable Juices, RNA-Seq, Food Contamination, Hot Temperature, Patulin, Saccharomyces cerevisiae, Transcription, Genetic, Gene Expression Regulation, Fungal, Malus, Gene-Environment Interaction
About these checks
Registry, retraction, Cites and statistics results are computed, not judged, with one exception: a printed reference that no index lists is read once by a model before it counts as a citation error. Claims are extracted by a model and kept only when their quote appears verbatim in the text; each cited source is then checked, with a model’s help, for whether it says what the claim relies on. Those verdicts can be wrong — read the claim’s quote and the cited source before relying on one.
Statistics and arithmetic are recomputed, not judged.
Confidence bands are shown only for fields calibrated on our annotated test set. None is calibrated yet, so no band is shown.
What counts as a claim ›How we measure confidence ›How we check this ›
Are you an author, or do you see a problem with this page? Request a review
How to cite
Cite CoChat for the checks on this page, and the paper for its own findings.
- This page
- CoChat. (2026). Citation check: Distinct Transcriptional Changes in Response to Patulin Underlie Toxin Biosorption Differences in Saccharomyces cerevisiae. https://app.cochat.ai/papers/10.3390/toxins11070400
- The paper
- Oporto, C., Villarroel, C., Tapia, S., García, V., & Cubillos, F. (2019). Distinct Transcriptional Changes in Response to Patulin Underlie Toxin Biosorption Differences in Saccharomyces cerevisiae. Toxins. https://doi.org/10.3390/toxins11070400
