

Mapping the Immune Cell Microenvironment with Spatial Profiling in Muscle Tissue Injected with the Venom of Daboia russelii
Open accessThe DOI matches its Crossref record; 45 of the 46 references it cites were found in a registry or an index, and 1 are not checked yet.
Abstract
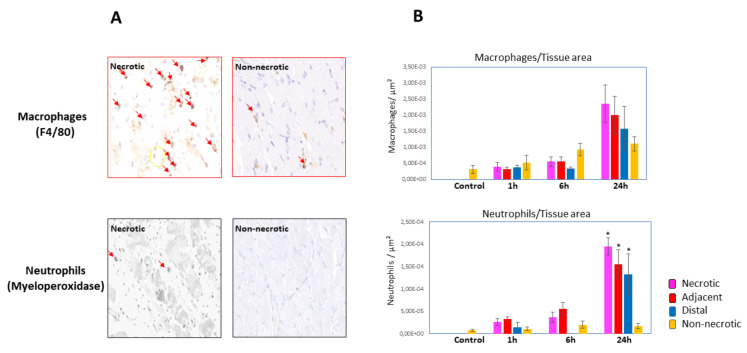
Pathological and inflammatory events in muscle after the injection of snake venoms vary in different regions of the affected tissue and at different time intervals. In order to study such heterogeneity in the immune cell microenvironment, a murine model of muscle necrosis based on the injection of the venom of Daboia russelii was used. Histological and immunohistochemical methods were utilized to identify areas in muscle tissue with a different extent of muscle cell damage, based on the presence of hypercontracted muscle cells, a landmark of necrosis, and on the immunostaining for desmin. A gradient of inflammatory cells (neutrophils and macrophages) was observed from heavily necrotic areas to less damaged and non-necrotic areas. GeoMx® Digital Spatial Profiler (NanoString, Seattle, WA, USA) was used for assessing the presence of markers of various immune cells by comparing high-desmin (nondamaged) and low-desmin (damaged) regions of muscle. Markers of monocytes, macrophages, M2 macrophages, dendritic cells, neutrophils, leukocyte adhesion and migration markers, and hematopoietic precursor cells showed higher levels in low-desmin regions, especially in samples collected 24 hr after venom injection, whereas several markers of lymphocytes did not. Moreover, apoptosis (BAD) and extracellular matrix (fibronectin) markers were also increased in low-desmin regions. Our findings reveal a hitherto-unknown picture of immune cell microheterogeneity in venom-injected muscle which greatly depends on the extent of muscle cell damage and the time lapse after venom injection.
Overview
The claims and statistics of this paper haven’t been checked yet.
Free: it reads the open-access text and checks the first 5 claims that cite a source we can check. Create a free account to check every claim.
Integrity signals
Registry
Cites
Statistics
Figures



Verification
Claims the paper makes
The claims and statistics of this paper haven’t been checked yet.
Free: it reads the open-access text and checks the first 5 claims that cite a source we can check. Create a free account to check every claim.
Claims other papers make about this one
Each is checked against this paper’s own text: does it say what the citing paper says it does?
The source backs part of the claim, not all of it — or backs it for a different population, condition or comparison.
In the citing paper
“These cell culture models fail to replicate the complex, multidimensional microenvironment of snakebite envenomation, involving vascular leakage, ischemia, and immune cell infiltration”
From Role of Regulated Cell Death Pathways in Snakebite Envenomation: Mechanisms, Crosstalk, and Therapeutic Opportunities (2026) · cites this paper as [97]
Experimental — accuracy not yet measured
Self-check
Percentages, sums and reported differences re-computed from the paper’s own numbers.
The self-check needs the paper’s full text.
Citations
Cites
Arnold, L., Henry, A., Poron, F., Baba-Amer, Y., van Rooijen, N., Plonquet, A., Gherardi, R. K., & Chazaud, B. (2007) · The Journal of Experimental Medicine · doi:10.1084/jem.20070075 · Cited by 2,002 · cited 1×
“The phenotype of macrophages in necrotic muscle varies along time, with proinflammatory M1 macrophage predominating in the first wave of infiltration, and M2 proregenerative macrophages being predominant later on in the process [36].”
BackgroundThe Neutrophil’s Role During Health and Disease
Liew, P. X., & Kubes, P. (2019) · Physiological Reviews · doi:10.1152/physrev.00012.2018 · Cited by 1,175 · cited 1×
“, selectins, integrins and proteins of the immunoglobulin superfamily [33,34].”
BackgroundMethod of the Year: spatially resolved transcriptomics
Marx, V. (2021) · Nature Methods · doi:10.1038/s41592-020-01033-y · Cited by 1,132
Multiplex digital spatial profiling of proteins and RNA in fixed tissue
Merritt, C. R., Ong, G. T., Church, S. E., Barker, K., Danaher, P., Geiss, G., Hoang, M., Jung, J., Liang, Y., McKay-Fleisch, J., et al. (2020) · Nature Biotechnology · doi:10.1038/s41587-020-0472-9 · Cited by 1,072 · cited 4×
“To this end, we used Geomix® Digital Spatial Profiler [28], in combination with histology and immunohistochemistry, to assess the host immune responses in the wound microenvironment of mouse skeletal muscle to the action of the venom of the Asian viperid snake Daboia russelii.”
BackgroundMethodInfluentialGutiérrez, J. M., Calvete, J. J., Habib, A. G., Harrison, R. A., Williams, D. J., & Warrell, D. A. (2017) · Nature Reviews Disease Primers · doi:10.1038/nrdp.2017.63 · Cited by 955 · cited 1×
“Owing to the great complexity and interand intraspecies variation in venom composition, there is a wide spectrum of clinical manifestations and complications associated with these envenomings [2,3].”
BackgroundSelf-citationWarrell, D. A. (2010) · The Lancet · doi:10.1016/s0140-6736(09)61754-2 · Cited by 774 · cited 1×
“Owing to the great complexity and interand intraspecies variation in venom composition, there is a wide spectrum of clinical manifestations and complications associated with these envenomings [2,3].”
BackgroundSnake venom metalloproteinases:Their role in the pathogenesis of local tissue damage
Gutiérrez, J. (2000) · Biochimie · doi:10.1016/s0300-9084(00)01163-9 · Cited by 619
Self-citationGutiérrez, J. M., & Ownby, C. L. (2003) · Toxicon · doi:10.1016/j.toxicon.2003.11.005 · Cited by 444
Self-citationUpdate on Neutrophil Function in Severe Inflammation
Mortaz, E., Alipoor, S. D., Adcock, I. M., Mumby, S., & Koenderman, L. (2018) · Frontiers in Immunology · doi:10.3389/fimmu.2018.02171 · Cited by 421 · cited 1×
“, selectins, integrins and proteins of the immunoglobulin superfamily [33,34].”
BackgroundSkeletal muscle apoptosis, sarcopenia and frailty at old age
Marzetti, E., & Leeuwenburgh, C. (2006) · Experimental Gerontology · doi:10.1016/j.exger.2006.08.011 · Cited by 346 · cited 1×
“Apoptosis has been associated with age-related skeletal muscle loss [41,42].”
Background
Research works printed but not linked: 2
- Gutiérrez, J.M. (2021). Handbook of Venoms and Toxins of Reptiles, CRC Press.
- Teixeira, C., Moreira, V., and Gutiérrez, J.M. (2017). Inflammation—From Molecular and Cellular Mechanisms to the Clinic, Wiley.
Cited by
Dávila, A. J. L., Lomonte, B., & Gutiérrez, J. M. (2023) · Journal of Muscle Research and Cell Motility · doi:10.1007/s10974-023-09662-4 · Cited by 12
“Loss of immunostaining for desmin was used to identify areas of muscle damage in venom-injected muscle (de Oliveira et al. 2023).”
BackgroundSelf-citationOliveira, A. K. D., Rucavado, A., Escalante, T., Gutiérrez, J. M., & Fox, J. W. (2024) · Biomolecules · doi:10.3390/biom14030278 · Cited by 5
“Understanding this altered tissue environment has been challenging because of its complexity, its dynamics over time, and its spatial heterogeneity in various regions of the affected tissue [8].”
BackgroundSelf-citationAlangode, A., Rajasekhar, A., Sabu, J. J., Krishna, S., Anuja, D., Sreeja, A., Remesh, G., Kaladevi, A., & Nair, B. G. (2026) · International Journal of Molecular Sciences · doi:10.3390/ijms27156830
“These cell culture models fail to replicate the complex, multidimensional microenvironment of snakebite envenomation, involving vascular leakage, ischemia, and immune cell infiltration [96,97].”
Functional and Metabolic Muscle Responses to Exercise
Muzhenya, D. V., & Lysenkov, S. P. (2025) · Health and Prevention Journal · doi:10.26855/hpj.2025.12.001
Metadata
- Authors
- de Oliveira, A. K., Pramoonjago, P., Rucavado, A., Moskaluk, C., Silva, D. T., Escalante, T., Gutiérrez, J. M., & Fox, J. W.
- Affiliations
- School of Medicine, University of Virginia, Charlottesville, VA 22908, USA
- University of Virginia (US)
- Universidad de Costa Rica (CR)
- Instituto Clodomiro Picado, Facultad de Microbiología, Universidad de Costa Rica, San José 11501, Costa Rica
- Corresponding author
- Fox, Jay W.
- ORCID
- Venue
- Toxins
- Publisher
- MDPI AG
- Published
- 2023-03-10
- Volume
- 15
- Issue
- 3
- Pages
- 208
- ISSN
- 2072-6651 (ISSN-L)
- PMC
- PMC10057198
- OpenAlex
- W4323853767
- Cited by
- 3
- References
- 44
- Citations by year
- 2026: 1 · 2024: 1 · 2023: 1
- FWCI
- 0.50
- Type
- journal article
- Language
- en
- Open access
- gold
- doi.org
- Licence
- Locations
- Toxins (publishedVersion, cc-by)
- PubMed Central (publishedVersion, cc-by)
- PubMed (publishedVersion)
- DOAJ (DOAJ: Directory of Open Access Journals) (submittedVersion, cc-by-sa)
- Funders
- The Office of Research Core Administration
- University of Virginia School of Medicine, Virginia, USA
- Vicerrectoría de Investigación (Universidad de Costa Rica)
- Topics
- Life Sciences › Pharmacology, Toxicology and Pharmaceutics › Toxicology › Venomous Animal Envenomation and Studies
- Health Sciences › Medicine › Pharmacology (medical) › Healthcare and Venom Research
- Life Sciences › Immunology and Microbiology › Immunology › Immunotoxicology and immune responses
- Keywords
- snake venom, muscle necrosis, spatial profiling, GeoMx Digital Spatial Profiler, macrophages, M2 macrophages, neutrophils, dendritic cells, desmin, muscle damage, apoptosis, fibronectin, extracellular matrix, inflammation, hematopoietic precursors
- MeSH terms
- Animals, Crotalid Venoms, Desmin, Muscles, Necrosis, Viper Venoms, Mice
About these checks
Registry, retraction, Cites and statistics results are computed, not judged, with one exception: a printed reference that no index lists is read once by a model before it counts as a citation error. Claims are extracted by a model and kept only when their quote appears verbatim in the text; each cited source is then checked, with a model’s help, for whether it says what the claim relies on. Those verdicts can be wrong — read the claim’s quote and the cited source before relying on one.
Statistics and arithmetic are recomputed, not judged.
Confidence bands are shown only for fields calibrated on our annotated test set. None is calibrated yet, so no band is shown.
What counts as a claim ›How we measure confidence ›How we check this ›
Are you an author, or do you see a problem with this page? Request a review
How to cite
Cite CoChat for the checks on this page, and the paper for its own findings.
- This page
- CoChat. (2026). Citation check: Mapping the Immune Cell Microenvironment with Spatial Profiling in Muscle Tissue Injected with the Venom of Daboia russelii. https://app.cochat.ai/papers/10.3390/toxins15030208
- The paper
- de Oliveira, A. K., Pramoonjago, P., Rucavado, A., Moskaluk, C., Silva, D. T., Escalante, T., Gutiérrez, J. M., & Fox, J. W. (2023). Mapping the Immune Cell Microenvironment with Spatial Profiling in Muscle Tissue Injected with the Venom of Daboia russelii. Toxins. https://doi.org/10.3390/toxins15030208
Data sources
Bibliographic data: Semantic Scholar, OpenAlex, Crossref.
Contains information from the Semantic Scholar Academic Graph Datasets, made available under the ODC Attribution License (ODC-BY 1.0).
Semantic Scholar’s data is described in: Kinney, R., et al. (2023). The Semantic Scholar Open Data Platform. arXiv:2301.10140.
