Cited by 29HIV Research and TreatmentT-cell and Retrovirus StudiesHIV/AIDS drug development and treatment

The DOI matches its Crossref record; 71 of the 71 references it cites were found in a registry or an index.

EWI-2 Inhibits Cell–Cell Fusion at the HIV-1 Virological Presynapse

Open access

Published version of a preprint

Abstract

Abstract Cell-to-cell transfer of virus particles through the virological synapse (VS) is a highly efficient mode of HIV-1 transmission. Formation of the VS, a transient multiform adhesion structure, is mediated through an interaction between the HIV-1 envelope glycoprotein (Env) and the viral receptor CD4 on the surface of infected cell and target cell, respectively. Given that Env, unlike many other viral fusogens, can mediate the merger of membranes at neutral pH, the close encounter of infected and uninfected cells would seem prone to result in cell-cell fusion and thus the formation of syncytia. However, while it is being recognized now that small, T cell-based syncytia are indeed a defining feature of the natural history of HIV-1, the majority of VSs nevertheless resolve without fusion, thus securing continued virus spread. Gag, the main viral structural component, is partially responsible for restraining Env and preventing it from becoming fusogenic before being incorporated into particles. In addition, a few cellular factors, including tetraspanins and ezrin, have also been shown to inhibit Env’s activity while this fusogen is still part of the producer cell. Here, we identify EWI-2, a protein that was previously shown to associate with the tetraspanins CD9 and CD81 and also with ezrin, as a host factor that contributes to the inhibition of Env­mediated cell-cell fusion. Using fluorescence microscopy, flow cytometry, and TZM-bl fusion assays, we show that EWI-2, comparable to tetraspanins, while overall being downregulated upon HIV-1 infection, accumulates at the producer cell side of the VS (i.e. the presynapse), where it contributes to the fusion-preventing activities of the other viral and cellular components.

Overview

The claims and statistics of this paper haven’t been checked yet.

Run the check — free, no account needed. It reads the open-access text and checks the sources it cites.

A few free checks a day · papers already verified open instantly · results are public

Integrity signals

Registry

Crossref · 10.3390/v11121082

Cites

71 of 71 references verified0 citation errors · 0 not checkable

Statistics

Figures

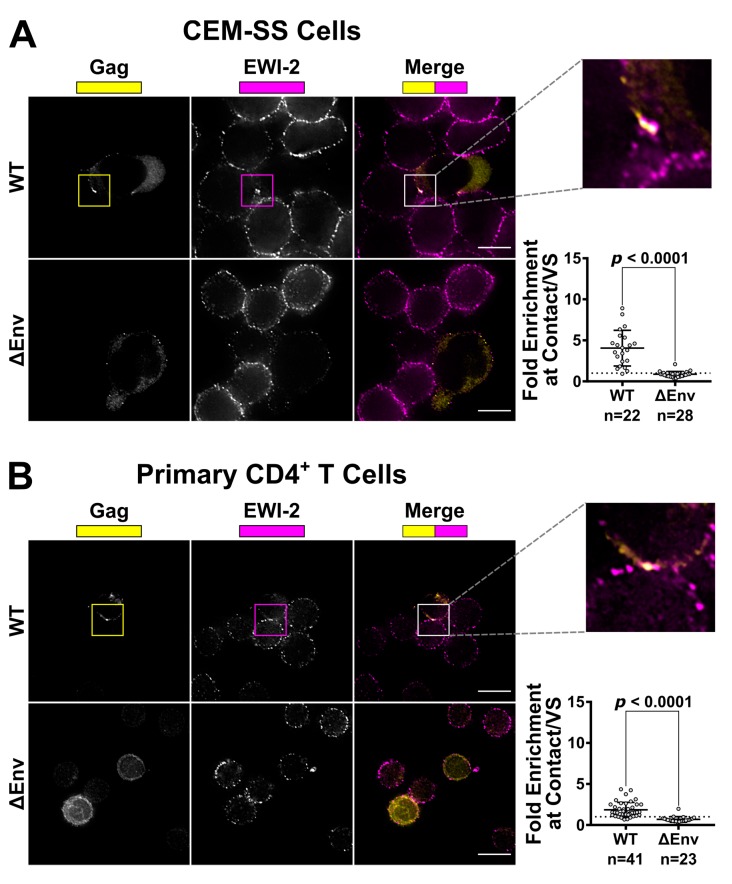
Figure 1 EWI-2 co-accumulates with Gag at the HIV-1 VS in T cells. (A) CEM-SS cells infected with HIV-1 NL4-3 WT or ΔEnv were co cultured with uninfected CEM-SS target cells for 5 h, and subsequently stained for surface EWI-2 (magenta) and Gag (yellow). The EWI-2-associated fluorescence intensity at cell–cell contacts either enriched with Gag (WT) or not Gag-enriched but identified by DIC (ΔEnv) was measured. This value was then divided by the sum of the EWI-2-associated fluorescence intensity on non-contact sites on the producer and target cell in each VS/contact to yield EWI-2 enrichment (i.e., the values shown here). The data quantified are from one biological replicate consisting of two technical replicates. Similar trends were observed in a second dataset; not shown. (B) Primary CD4+ T cells infected with NL-sfGI WT or NL-CI ΔEnv were co-cultured with uninfected target primary cells for 2 h and stained for EWI-2 (magenta) and Gag (yellow), followed by secondary pAbs (Alexa Fluor 647-conjugated for EWI-2, and either Alexa Fluor 594 or Alexa Fluor 488-conjugated for Gag in the case of WT and ΔEnv, respectively). Because different secondary antibodies were used for Gag in either condition, the scaling shown for that channel is not the same across the two conditions and was based on corresponding primary and uninfected controls done alongside each dataset. Enrichment of EWI-2 at Env-dependent (WT) or Env-independent (ΔEnv) infected-uninfected cell contacts was quantified as described in (A). The data quantified are pooled from two independent biological replicates, each consisting of two technical replicates. Scale bars = 10 µm. In both data plots, each data point represents one cell–cell contact site (as opposed to one cell). The dotted horizontal line indicates a theoretical fold enrichment value of 1, which indicates no enrichment. Error bars = standard deviation of the mean (SD). p-values are the result of two-tailed non-parametric Mann-Whitney U tests.
Figure 1 EWI-2 co-accumulates with Gag at the HIV-1 VS in T cells. (A) CEM-SS cells infected with HIV-1 NL4-3 WT or ΔEnv were co cultured with uninfected CEM-SS target cells for 5 h, and subsequently stained for surface EWI-2 (magenta) and Gag (yellow). The EWI-2-associated fluorescence intensity at cell–cell contacts either enriched with Gag (WT) or not Gag-enriched but identified by DIC (ΔEnv) was measured. This value was then divided by the sum of the EWI-2-associated fluorescence intensity on non-contact sites on the producer and target cell in each VS/contact to yield EWI-2 enrichment (i.e., the values shown here). The data quantified are from one biological replicate consisting of two technical replicates. Similar trends were observed in a second dataset; not shown. (B) Primary CD4+ T cells infected with NL-sfGI WT or NL-CI ΔEnv were co-cultured with uninfected target primary cells for 2 h and stained for EWI-2 (magenta) and Gag (yellow), followed by secondary pAbs (Alexa Fluor 647-conjugated for EWI-2, and either Alexa Fluor 594 or Alexa Fluor 488-conjugated for Gag in the case of WT and ΔEnv, respectively). Because different secondary antibodies were used for Gag in either condition, the scaling shown for that channel is not the same across the two conditions and was based on corresponding primary and uninfected controls done alongside each dataset. Enrichment of EWI-2 at Env-dependent (WT) or Env-independent (ΔEnv) infected-uninfected cell contacts was quantified as described in (A). The data quantified are pooled from two independent biological replicates, each consisting of two technical replicates. Scale bars = 10 µm. In both data plots, each data point represents one cell–cell contact site (as opposed to one cell). The dotted horizontal line indicates a theoretical fold enrichment value of 1, which indicates no enrichment. Error bars = standard deviation of the mean (SD). p-values are the result of two-tailed non-parametric Mann-Whitney U tests.CC BY · PubMed Central
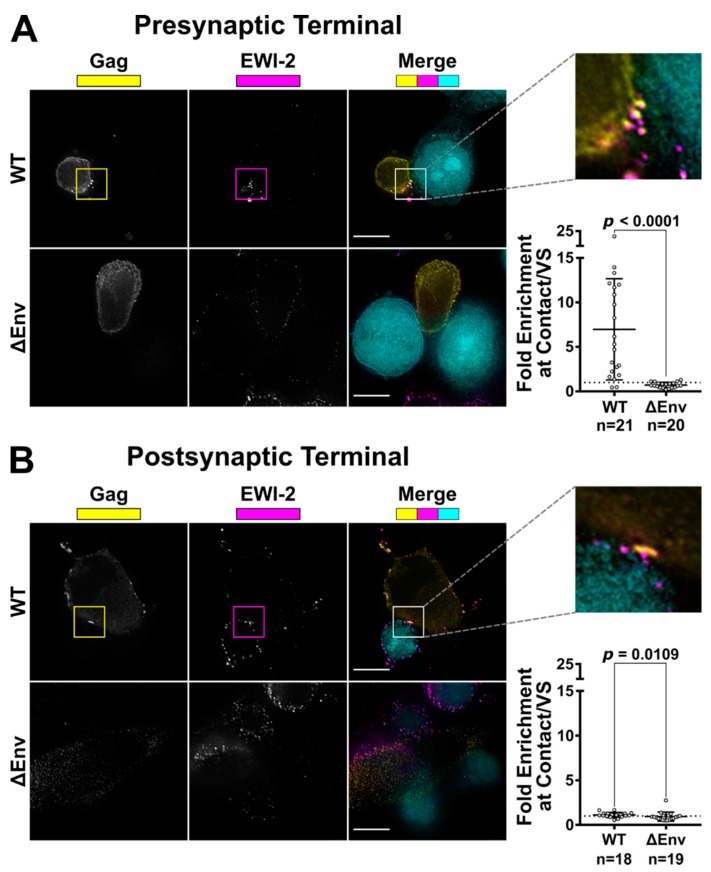
Figure 2 EWI-2 accumulation takes place on the producer cell side of the VS. (A) To evaluate presynaptic accumulation of EWI-2, CEM-SS cells infected with HIV-1 NL-CI WT or ΔEnv were co cultured with CMAC (cyan) labeled TZM-bl target cells (which have nearly-undetectable EWI-2 surface levels compared to CEM-SS cells) for 2.5 h, and subsequently stained for surface EWI-2 (magenta) and Gag (yellow). EWI-2 enrichment was quantified as described in Figure 1. Quantification is the result of pooled VS/contacts from two independent biological replicates. (B) To evaluate postsynaptic accumulation of EWI-2, HeLa cells (which, like TZM-bl cells, also have nearly-undetectable EWI-2 surface levels) were transfected with HIV-1 NL-sfGI or NL-sfGI ΔEnv and cocultured with uninfected CEM-SS target cells (cyan) for 2–2.5 h. Cells were stained for surface EWI-2 (magenta) and Gag (yellow). Note that Gag expression in the ΔEnv condition was quite low, since Gag expression in this virus is already expected to be considerably reduced [55]. EWI-2 enrichment was calculated as described in Figure 1. Quantification is the result of pooled VSs/contacts from two independent biological replicates. Scale bars = 10 µm. In both data plots, each dot represents the EWI-2 enrichment value of one VS/contact. The dotted horizontal line indicates a theoretical fold enrichment of 1, which indicates no enrichment. Error bars = standard deviation of the mean (SD). p-values are the result of two-tailed non-parametric Mann-Whitney U tests.
Figure 2 EWI-2 accumulation takes place on the producer cell side of the VS. (A) To evaluate presynaptic accumulation of EWI-2, CEM-SS cells infected with HIV-1 NL-CI WT or ΔEnv were co cultured with CMAC (cyan) labeled TZM-bl target cells (which have nearly-undetectable EWI-2 surface levels compared to CEM-SS cells) for 2.5 h, and subsequently stained for surface EWI-2 (magenta) and Gag (yellow). EWI-2 enrichment was quantified as described in Figure 1. Quantification is the result of pooled VS/contacts from two independent biological replicates. (B) To evaluate postsynaptic accumulation of EWI-2, HeLa cells (which, like TZM-bl cells, also have nearly-undetectable EWI-2 surface levels) were transfected with HIV-1 NL-sfGI or NL-sfGI ΔEnv and cocultured with uninfected CEM-SS target cells (cyan) for 2–2.5 h. Cells were stained for surface EWI-2 (magenta) and Gag (yellow). Note that Gag expression in the ΔEnv condition was quite low, since Gag expression in this virus is already expected to be considerably reduced [55]. EWI-2 enrichment was calculated as described in Figure 1. Quantification is the result of pooled VSs/contacts from two independent biological replicates. Scale bars = 10 µm. In both data plots, each dot represents the EWI-2 enrichment value of one VS/contact. The dotted horizontal line indicates a theoretical fold enrichment of 1, which indicates no enrichment. Error bars = standard deviation of the mean (SD). p-values are the result of two-tailed non-parametric Mann-Whitney U tests.CC BY · PubMed Central
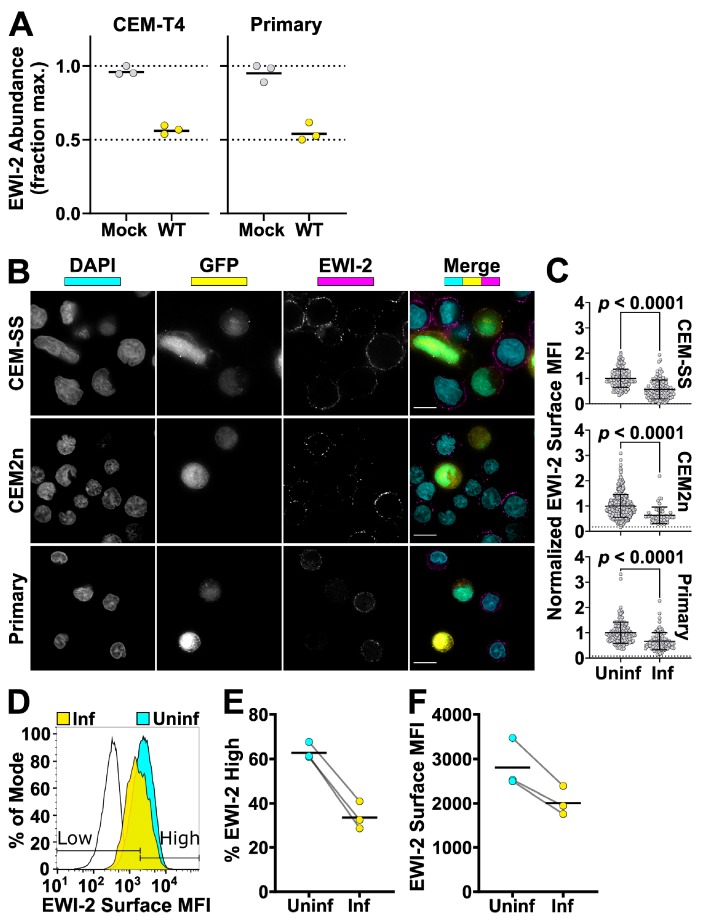
Figure 3 EWI-2 is downregulated from the surface of infected cells. (A) Abundance of EWI-2 in mock-infected (grey) versus WT HIV-infected (yellow) CEM-T4 T cells or primary human CD4+ T cells. Experiments were conducted in triplicate and whole cell lysates subjected to Tandem Mass Tag (TMT)-based quantitative proteomics 48 h after infection (reanalysis of data from [50,51]). Seven (CEM-T4 T cells) or six (primary human CD4+ T cells) unique peptides were used for EWI-2 quantitation. Mean relative abundances (fraction of maximum TMT reporter ion intensity) shown. (B) Cells were infected with NL-sfGI and surface-labeled for EWI-2, fixed, stained with DAPI (shown in cyan) and Alexa Fluor 594-conjugated secondary antibody, and imaged. GFP signal (yellow) was used to identify infected cells, and EWI-2-associated signal is shown pseudocolored in magenta. Representative cells are shown. Scale bars = 10 µm. (C) Cells were prepared as in (B) and EWI-2 levels at the plasma membrane in infected (Inf) and uninfected (Uninf) cells were measured by manually selecting the plasma membrane at the midline of each cell and quantifying the mean EWI-2-associated fluorescence intensity. Fluorescence intensity of each cell was normalized to the average intensity value of uninfected cells within the same imaging set. Data shown are pooled from two to three biological replicates, each consisting of two technical replicates. Only non-contact sites were quantified. Error bars = SD. p-values are the result of a two-tailed non-parametric Mann-Whitney U test. (C-E) CEM2n cells were infected with NL-sfGI and surface-labeled for EWI-2, fixed, and stained with Alexa Fluor 647-conjugated secondary antibody, and analyzed by flow cytometry. (D) Representative histogram normalized to mode of the EWI-2 signal intensity at the cell surface for unstained controls (black outline), infected cells (yellow), and uninfected cells (cyan). The gates defining EWI-2high and EWI-2low cells are shown. (E) Data represent the percentage of uninfected and infected cells that fell into the EWI-2high gate shown in (d) from 3 independent biological replicates, averaged across two technical replicates within each. (F) EWI-2 surface expression was measured by mean fluorescence intensity (MFI) of EWI-2-associated signal. In both panels, lines connect paired data points, i.e., infected cells and uninfected cells (within an infected tube) from the same biological replicate.
Figure 3 EWI-2 is downregulated from the surface of infected cells. (A) Abundance of EWI-2 in mock-infected (grey) versus WT HIV-infected (yellow) CEM-T4 T cells or primary human CD4+ T cells. Experiments were conducted in triplicate and whole cell lysates subjected to Tandem Mass Tag (TMT)-based quantitative proteomics 48 h after infection (reanalysis of data from [50,51]). Seven (CEM-T4 T cells) or six (primary human CD4+ T cells) unique peptides were used for EWI-2 quantitation. Mean relative abundances (fraction of maximum TMT reporter ion intensity) shown. (B) Cells were infected with NL-sfGI and surface-labeled for EWI-2, fixed, stained with DAPI (shown in cyan) and Alexa Fluor 594-conjugated secondary antibody, and imaged. GFP signal (yellow) was used to identify infected cells, and EWI-2-associated signal is shown pseudocolored in magenta. Representative cells are shown. Scale bars = 10 µm. (C) Cells were prepared as in (B) and EWI-2 levels at the plasma membrane in infected (Inf) and uninfected (Uninf) cells were measured by manually selecting the plasma membrane at the midline of each cell and quantifying the mean EWI-2-associated fluorescence intensity. Fluorescence intensity of each cell was normalized to the average intensity value of uninfected cells within the same imaging set. Data shown are pooled from two to three biological replicates, each consisting of two technical replicates. Only non-contact sites were quantified. Error bars = SD. p-values are the result of a two-tailed non-parametric Mann-Whitney U test. (C-E) CEM2n cells were infected with NL-sfGI and surface-labeled for EWI-2, fixed, and stained with Alexa Fluor 647-conjugated secondary antibody, and analyzed by flow cytometry. (D) Representative histogram normalized to mode of the EWI-2 signal intensity at the cell surface for unstained controls (black outline), infected cells (yellow), and uninfected cells (cyan). The gates defining EWI-2high and EWI-2low cells are shown. (E) Data represent the percentage of uninfected and infected cells that fell into the EWI-2high gate shown in (d) from 3 independent biological replicates, averaged across two technical replicates within each. (F) EWI-2 surface expression was measured by mean fluorescence intensity (MFI) of EWI-2-associated signal. In both panels, lines connect paired data points, i.e., infected cells and uninfected cells (within an infected tube) from the same biological replicate.CC BY · PubMed Central
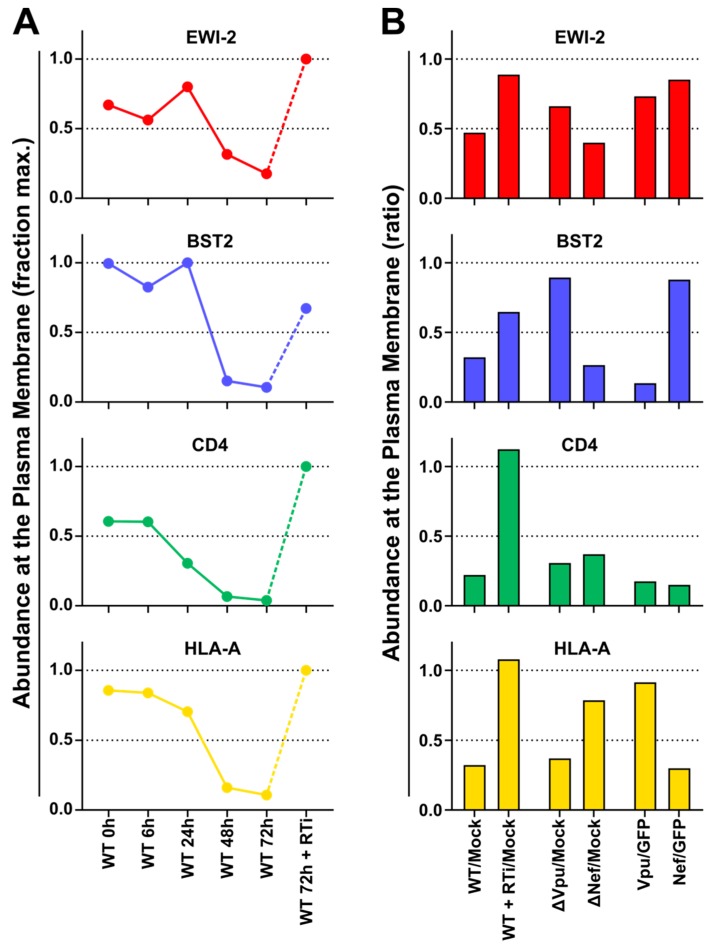
Figure 4 Plasma membrane EWI-2 is downregulated by Vpu. (A) Temporal expression profiles of cell surface EWI-2 (red, upper panel) or indicated control proteins (blue/green/gold, lower panels) in WT HIV-1-infected CEM-T4 T cells (reanalysis of data from [53]). Plasma membrane proteins were subjected to TMT-based quantitative proteomics 0 (uninfected), 6, 24, 48, and 72 h after infection, or 72 h after infection in the presence of reverse transcriptase inhibitors (RTi). Twelve unique peptides were used for EWI-2 quantitation. Relative abundances (fraction of maximum TMT reporter ion intensity) are shown. (B) Abundance of EWI-2 (red, upper panel) or indicated control proteins (blue/green/gold, lower panels) in control CEM-T4 T cells or CEM-T4 T cells infected with WT HIV-1 in the presence/absence of RTi, infected with Vpu- or Nef-deficient HIV-1, or transduced with Vpu or Nef as single genes (reanalysis of data from [53]). Plasma membrane proteins were subjected to Stable Isotope Labelling with Amino acids in Cell culture (SILAC)-based quantitative proteomics 72 h after infection (3 × 3-way comparisons). Twelve (WT HIV-1 +/− RTi), nine (∆Vpu/∆Nef HIV-1) or 14 (Vpu/Nef) unique peptides were used for EWI-2 quantitation. Ratios of abundances to mock-infected CEM-T4 T cells (WT HIV-1 +/- RTi and ∆Vpu/∆Nef HIV-1) or GFP-transduced CEM-T4 T cells (Vpu/Nef) are shown. Note that (A) and (B) show data from two different quantitative proteomic methods, as described above and in Materials and Methods.
Figure 4 Plasma membrane EWI-2 is downregulated by Vpu. (A) Temporal expression profiles of cell surface EWI-2 (red, upper panel) or indicated control proteins (blue/green/gold, lower panels) in WT HIV-1-infected CEM-T4 T cells (reanalysis of data from [53]). Plasma membrane proteins were subjected to TMT-based quantitative proteomics 0 (uninfected), 6, 24, 48, and 72 h after infection, or 72 h after infection in the presence of reverse transcriptase inhibitors (RTi). Twelve unique peptides were used for EWI-2 quantitation. Relative abundances (fraction of maximum TMT reporter ion intensity) are shown. (B) Abundance of EWI-2 (red, upper panel) or indicated control proteins (blue/green/gold, lower panels) in control CEM-T4 T cells or CEM-T4 T cells infected with WT HIV-1 in the presence/absence of RTi, infected with Vpu- or Nef-deficient HIV-1, or transduced with Vpu or Nef as single genes (reanalysis of data from [53]). Plasma membrane proteins were subjected to Stable Isotope Labelling with Amino acids in Cell culture (SILAC)-based quantitative proteomics 72 h after infection (3 × 3-way comparisons). Twelve (WT HIV-1 +/− RTi), nine (∆Vpu/∆Nef HIV-1) or 14 (Vpu/Nef) unique peptides were used for EWI-2 quantitation. Ratios of abundances to mock-infected CEM-T4 T cells (WT HIV-1 +/- RTi and ∆Vpu/∆Nef HIV-1) or GFP-transduced CEM-T4 T cells (Vpu/Nef) are shown. Note that (A) and (B) show data from two different quantitative proteomic methods, as described above and in Materials and Methods.CC BY · PubMed Central
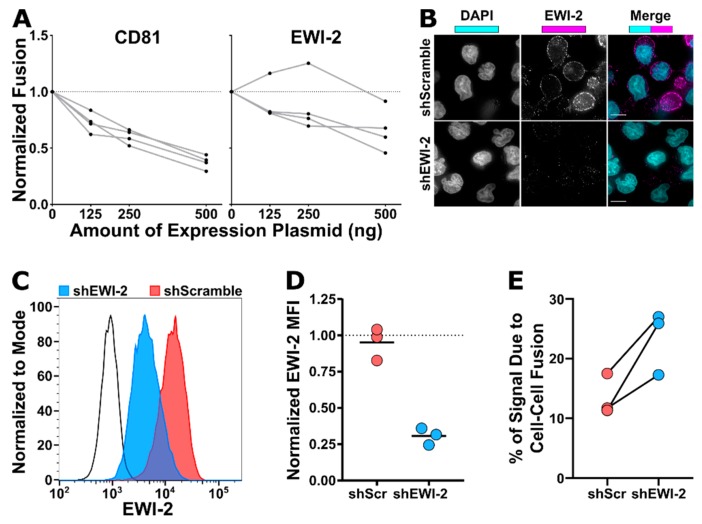
Figure 5 EWI-2 inhibits infected-uninfected cell fusion. (A) HeLa-TZM-bl fusion assays were performed using producer HeLa cells that were co-transfected with either pNL-sfGI ΔEnv (ΔEnv) or pNL-sfGI (WT) in combination with overexpression plasmid totaling 500 ng (using the indicated amount of CD81 or EWI-2 supplemented with L6). Luminescence readings (across 4 independent biological replicates, each with two technical replicates) were divided by the ΔEnv condition to obtain the fold increase in fusion, and then normalized to the WT co-transfected with only L6 (i.e., 0 ng of CD81 or EWI-2) condition, making it have a value of 1. Deviation from the dashed line at 1 thus indicates an effect on fusion. Values from the same biological replicate are linked by a grey line. (B–D) EWI-2 expression in shScramble (shScr) and shEWI-2 CEM-SS cells was analyzed by microscopy (B) and flow cytometry (C–D). (B) For microscopy, cells were plated onto poly-L-lysine-coated glass, fixed, permeabilized, labeled for EWI-2, and stained using fluorescent secondary antibody (magenta) and DAPI (cyan). Scale bars = 10 µm. (C–D) For flow cytometry analysis, cells were labeled with Live/Dead Fixable Near-IR, fixed, permeabilized, labeled for EWI-2, and stained with fluorescent secondary antibody. (C) Representative histogram of the EWI-2 signal intensity normalized to mode in live cells for unstained controls (black line), shEWI-2 (blue), and shScr (red) cells. (D) EWI-2 MFI in live shScr (red) and shEWI-2 (blue) cells from three independent biological replicates, normalized to EWI-2-labeled parental CEM-SS cells (represented at a value of 1 with a dashed line). (E) CEM-luc fusion assays were performed using shScr or shEWI-2 producer cells infected with NL4-3, which were co-cultured with CEM-luc target cells in the presence of DMSO (vehicle control, luciferase signal from transmission and cell–cell fusion) or EFV (luciferase signal resulting exclusively from cell–cell fusion). Luminescence readings (across three independent biological replicates) from the EFV-treated condition were divided by the DMSO reading from the same producer cell type and multiplied by 100 to determine the percentage of luciferase expression dependent on cell–cell fusion (syncytium formation) between either shScr or shEWI-2 producer and CEM-luc target cells. Values from the same biological replicate are linked by a black line.
Figure 5 EWI-2 inhibits infected-uninfected cell fusion. (A) HeLa-TZM-bl fusion assays were performed using producer HeLa cells that were co-transfected with either pNL-sfGI ΔEnv (ΔEnv) or pNL-sfGI (WT) in combination with overexpression plasmid totaling 500 ng (using the indicated amount of CD81 or EWI-2 supplemented with L6). Luminescence readings (across 4 independent biological replicates, each with two technical replicates) were divided by the ΔEnv condition to obtain the fold increase in fusion, and then normalized to the WT co-transfected with only L6 (i.e., 0 ng of CD81 or EWI-2) condition, making it have a value of 1. Deviation from the dashed line at 1 thus indicates an effect on fusion. Values from the same biological replicate are linked by a grey line. (B–D) EWI-2 expression in shScramble (shScr) and shEWI-2 CEM-SS cells was analyzed by microscopy (B) and flow cytometry (C–D). (B) For microscopy, cells were plated onto poly-L-lysine-coated glass, fixed, permeabilized, labeled for EWI-2, and stained using fluorescent secondary antibody (magenta) and DAPI (cyan). Scale bars = 10 µm. (C–D) For flow cytometry analysis, cells were labeled with Live/Dead Fixable Near-IR, fixed, permeabilized, labeled for EWI-2, and stained with fluorescent secondary antibody. (C) Representative histogram of the EWI-2 signal intensity normalized to mode in live cells for unstained controls (black line), shEWI-2 (blue), and shScr (red) cells. (D) EWI-2 MFI in live shScr (red) and shEWI-2 (blue) cells from three independent biological replicates, normalized to EWI-2-labeled parental CEM-SS cells (represented at a value of 1 with a dashed line). (E) CEM-luc fusion assays were performed using shScr or shEWI-2 producer cells infected with NL4-3, which were co-cultured with CEM-luc target cells in the presence of DMSO (vehicle control, luciferase signal from transmission and cell–cell fusion) or EFV (luciferase signal resulting exclusively from cell–cell fusion). Luminescence readings (across three independent biological replicates) from the EFV-treated condition were divided by the DMSO reading from the same producer cell type and multiplied by 100 to determine the percentage of luciferase expression dependent on cell–cell fusion (syncytium formation) between either shScr or shEWI-2 producer and CEM-luc target cells. Values from the same biological replicate are linked by a black line.CC BY · PubMed Central
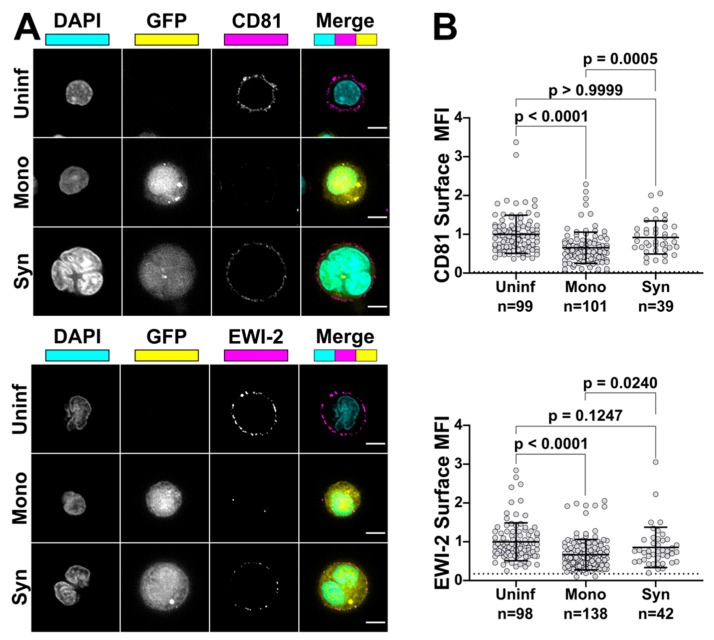
Figure 6 Syncytia have higher surface expression of EWI-2 and CD81 than mononucleated infected cells. (A) Primary CD4+ T cells were infected with NL-sfGI, surface-labeled for either EWI-2 or CD81 (both shown in magenta), fixed, stained with DAPI (cyan) and AlexaFluor 647-conjugated secondary antibody, and imaged. Infected cells were identified by GFP (yellow) and discriminated as mono- or multinucleated infected cells by DAPI. Representative cells are shown. Scale bars = 5 µm. (B) Cells were prepared as described in (A) and analyzed for EWI-2 or CD81 surface expression on uninfected cells, mononucleated infected cells (Mono) and syncytia (Syn) by manually selecting the plasma membrane at the midline of each cell and quantifying the mean EWI-2 or CD81-associated fluorescence intensity. Raw fluorescence intensity values were background-subtracted using the fluorescence intensity of a cell-free area within the same image and subsequently normalized to the average intensity value of uninfected cells within the same imaging set. Data shown are the pooled normalized intensity values of two independent biological replicates, each with two technical replicates. Each data point represents the normalized surface MFI of an individual cell. Error bars = SD. p-values are the result of Kruskal-Wallis tests.
Figure 6 Syncytia have higher surface expression of EWI-2 and CD81 than mononucleated infected cells. (A) Primary CD4+ T cells were infected with NL-sfGI, surface-labeled for either EWI-2 or CD81 (both shown in magenta), fixed, stained with DAPI (cyan) and AlexaFluor 647-conjugated secondary antibody, and imaged. Infected cells were identified by GFP (yellow) and discriminated as mono- or multinucleated infected cells by DAPI. Representative cells are shown. Scale bars = 5 µm. (B) Cells were prepared as described in (A) and analyzed for EWI-2 or CD81 surface expression on uninfected cells, mononucleated infected cells (Mono) and syncytia (Syn) by manually selecting the plasma membrane at the midline of each cell and quantifying the mean EWI-2 or CD81-associated fluorescence intensity. Raw fluorescence intensity values were background-subtracted using the fluorescence intensity of a cell-free area within the same image and subsequently normalized to the average intensity value of uninfected cells within the same imaging set. Data shown are the pooled normalized intensity values of two independent biological replicates, each with two technical replicates. Each data point represents the normalized surface MFI of an individual cell. Error bars = SD. p-values are the result of Kruskal-Wallis tests.CC BY · PubMed Central

Verification

Claims the paper makes

The claims and statistics of this paper haven’t been checked yet.

Run the check — free, no account needed. It reads the open-access text and checks the sources it cites.

A few free checks a day · papers already verified open instantly · results are public

Claims other papers make about this one

Each is checked against this paper’s own text: does it say what the citing paper says it does?

Self-check

Percentages, sums and reported differences re-computed from the paper’s own numbers.

The self-check needs the paper’s full text.

Citations

Cites

Show all 71 references

Cited by

Sorted by citations

See all 29

Metadata

Authors
Whitaker, E. E., Matheson, N. J., Perlee, S., Munson, P. B., Symeonides, M., & Thali, M.
Affiliations
  • University of Vermont (US)
  • University of Cambridge (GB)
Corresponding author
Thali, Markus
Venue
Viruses
Publisher
MDPI AG
Published
2019-11-20
Volume
11
Issue
12
Pages
1082
ISSN
1999-4915 (ISSN-L)
OpenAlex
W2990116699
Cited by
27
References
71
Citations by year
2026: 3 · 2025: 2 · 2024: 8 · 2023: 5 · 2022: 5 · 2021: 1 · 2020: 1
FWCI
0.98
Type
journal article
Language
en
Open access
Locations
  • Viruses (publishedVersion, cc-by)
  • bioRxiv (Cold Spring Harbor Laboratory) (acceptedVersion, cc-by-nc)
  • Europe PMC (PubMed Central) (publishedVersion, cc-by)
  • PubMed Central (publishedVersion, cc-by)
  • PubMed (publishedVersion)
  • DOAJ (DOAJ: Directory of Open Access Journals) (submittedVersion, cc-by-sa)
  • Apollo (University of Cambridge) (submittedVersion, cc-by)
  • Apollo (cc-by)
Funders
  • National Institutes of Health (R01-GM117839, P30-RR032135, P30-GM103498)
  • University of Vermont Larner College of Medicine (Bridge Support Grant)
  • University of Vermont Department of Microbiology & Molecular Genetics (Nicole J. Ferland Award)
  • Medical Research Council (CSF MR/P008801/1)
  • NHS Blood and Transplant (WPA15-02)
  • NIHR Cambridge BRC (N/A)
  • Wellcome Trust (Strategic Award)
Topics
  • Life Sciences › Immunology and Microbiology › Virology › HIV Research and Treatment
  • Life Sciences › Immunology and Microbiology › Immunology › T-cell and Retrovirus Studies
  • Health Sciences › Medicine › Infectious Diseases › HIV/AIDS drug development and treatment
Keywords
HIV-1, cell-cell fusion, virological synapse, syncytia, tetraspanins, CD81, Vpu, fusion inhibition, HIV-1 transmission, host factors, ezrin
MeSH terms
Cell Fusion, Cell Line, Humans, Membrane Proteins, T-Lymphocytes, Virion, HIV-1, Down-Regulation, HIV Infections, Antigens, CD, Giant Cells, Presynaptic Terminals, RNA, Small Interfering

About these checks

Registry, retraction, Cites and statistics results are computed, not judged, with one exception: a printed reference that no index lists is read once by a model before it counts as a citation error. Claims are extracted by a model and kept only when their quote appears verbatim in the text; each cited source is then checked, with a model’s help, for whether it says what the claim relies on. Those verdicts can be wrong — read the claim’s quote and the cited source before relying on one.

Statistics and arithmetic are recomputed, not judged.

Confidence bands are shown only for fields calibrated on our annotated test set. None is calibrated yet, so no band is shown.

What counts as a claim ›How we measure confidence ›How we check this ›

Are you an author, or do you see a problem with this page? Request a review

How to cite

Cite CoChat for the checks on this page, and the paper for its own findings.

This page
CoChat. (2026). Citation check: EWI-2 Inhibits Cell–Cell Fusion at the HIV-1 Virological Presynapse. https://app.cochat.ai/papers/10.3390/v11121082
The paper
Whitaker, E. E., Matheson, N. J., Perlee, S., Munson, P. B., Symeonides, M., & Thali, M. (2019). EWI-2 Inhibits Cell–Cell Fusion at the HIV-1 Virological Presynapse. Viruses. https://doi.org/10.3390/v11121082