

The DOI matches its Crossref record; 60 of the 60 references it cites were found in a registry or an index.
Remote Sensing with UAVs for Flood Modeling: A Validation with Actual Flood Records
Abstract
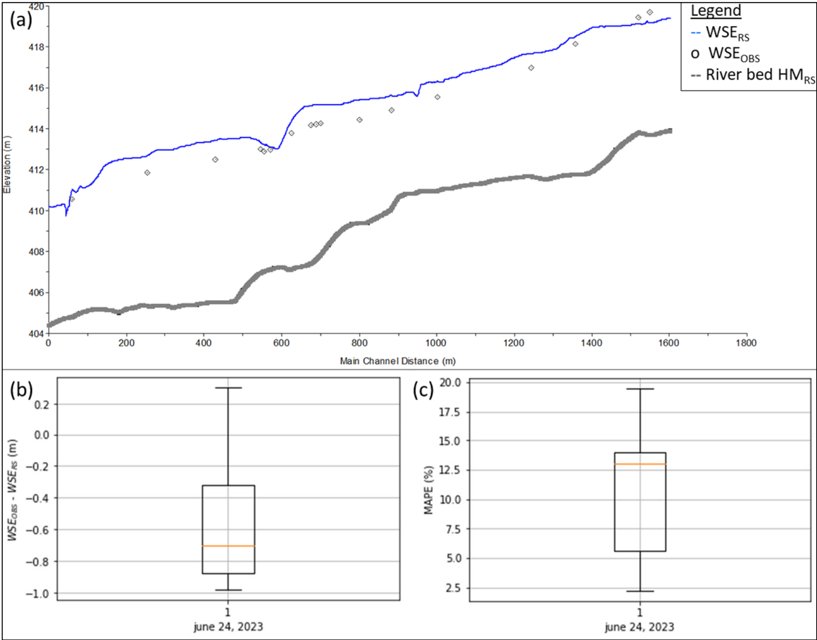
The use of unmanned aerial vehicles (UAVs) is steadily increasing due to their capacity to capture terrain elevation data with remarkable precision and cost-effectiveness. Nonetheless, their application for estimating water surface elevations and submerged terrain, such as channel bathymetry, remains constrained. Consequently, the development of a digital terrain model that relies on UAV data during low-water periods assumes a more extensive dry channel surface area, thus alleviating the information gap regarding submerged terrain. The objective of this brief report is to validate a hydraulic model for flood calculation. To this end, a 1D steady-state hydrological model of the Ñuble River based on a UAV survey in the low-water period of 2016 was constructed in HEC-RAS v.5.0.3 and compared to water surface elevation observations of the flood on 24 June 2023. The model tends to overestimate the flood, but the errors are considered tolerable for flood calculation (on average, a 10.6% depth error was obtained for a 30-year return period flood); therefore, the hydraulic model derived from remote sensing seems to be an effective alternative for the construction of hydraulic models for flood studies.
Overview
The claims and statistics of this paper haven’t been checked yet.
Run the check — free, no account needed. It reads the open-access text and checks the sources it cites.
Integrity signals
Registry
Cites
Statistics
Figures
Verification
Claims the paper makes
The claims and statistics of this paper haven’t been checked yet.
Run the check — free, no account needed. It reads the open-access text and checks the sources it cites.
Claims other papers make about this one
Each is checked against this paper’s own text: does it say what the citing paper says it does?
In the citing paper
“Water surface area was consistently minimal (60 m 2 ), suggesting negligible hydrological influence on these phenological shifts 26 .”
From AI-driven digital twinning quantifies the trade-off between flood conveyance and riparian stability under climate extremes (2026) · cites this paper as [26]
Self-check
Percentages, sums and reported differences re-computed from the paper’s own numbers.
The self-check needs the paper’s full text.
Citations
Cites
A classification of natural rivers
Rosgen, D. L. (1994) · CATENA · doi:10.1016/0341-8162(94)90001-9 · Cited by 1,713
Evaluation of 1D and 2D numerical models for predicting river flood inundation
Horritt, M. S., & Bates, P. D. (2002) · Journal of Hydrology · doi:10.1016/s0022-1694(02)00121-x · Cited by 1,195
Catchment Classification and Hydrologic Similarity
Wagener, T., Sivapalan, M., Troch, P., & Woods, R. (2007) · Geography Compass · doi:10.1111/j.1749-8198.2007.00039.x · Cited by 749
Developments in monitoring and modelling small‐scale river bed topography
Lane, S. N., Richards, K. S., & Chandler, J. H. (1994) · Earth Surface Processes and Landforms · doi:10.1002/esp.3290190406 · Cited by 301
Multitemporal UAV surveys for landslide mapping and characterization
Rossi, G., Tanteri, L., Tofani, V., Vannocci, P., Moretti, S., & Casagli, N. (2018) · Landslides · doi:10.1007/s10346-018-0978-0 · Cited by 263
Carbonneau, P. E., & Dietrich, J. T. (2017) · Earth Surface Processes and Landforms · doi:10.1002/esp.4012 · Cited by 258
Pacheco, A., Horta, J., Loureiro, C., & Ferreira, Ó. (2014) · Remote Sensing of Environment · doi:10.1016/j.rse.2014.12.004 · Cited by 242
Wang, X., & Xie, H. (2018) · Water · doi:10.3390/w10050608 · Cited by 226
Costa, B., Battista, T., & Pittman, S. J. (2009) · Remote Sensing of Environment · doi:10.1016/j.rse.2009.01.015 · Cited by 220
Seamless Mapping of River Channels at High Resolution Using Mobile LiDAR and UAV-Photography
Flener, C., Vaaja, M. T., Jaakkola, A., Krooks, A., Kaartinen, H., Kukko, A., Kasvi, E., Hyyppä, H., Hyyppa, J. M., & Alho, P. (2013) · Remote Sensing · doi:10.3390/rs5126382 · Cited by 207
Research works printed but not linked: 3
- Brasington, 2000, Monitoring and modelling morphological change in a braided gravel-bed river using high resolution GPS-based survey, Earth Surf. Process. Landforms, 25, 973, 10.1002/1096-9837(200008)25:9<973::AID-ESP111>3.0.CO;2-Y · doi:10.1002/1096-9837(200008)25:9<973::aid-esp111>3.0.co;2-y
- Hicks, D.M. (2012). Gravel-Bed Rivers, John Wiley & Sons, Ltd.
- Rajabi, 2021, Morphological classification stability of Zab river channel on Rosgen method, Geogr. Plan., 25, 141
Cited by
Shin, J. H., Go, S. H., & Park, J. H. (2026) · Scientific Reports · doi:10.1038/s41598-026-63704-8
Metadata
- Authors
- Clasing, R., Muñoz, E., Arumí, J. L., & Parra, V.
- Affiliations
- Department of Civil Engineering, Universidad Católica de la Santísima Concepción, Concepción 4090541, Chile
- Department of Water Resources, Universidad de Concepción, Chillán 3812120, Chile
- Department of Envioromental Engineering, Universidad de Concepción, Concepción 4070386, Chile
- Venue
- Water
- Publisher
- MDPI AG
- Published
- 2023-10-31
- Volume
- 15
- Issue
- 21
- Pages
- 3813
- ISSN
- 2073-4441
- Cited by
- 16
- References
- 60
- Language
- en
- Funders
- CIBAS 2019-01 (DI-FME 03/2021, ANID/FONDAP/15130015)
- CRHIAM Center (DI-FME 03/2021, ANID/FONDAP/15130015)
About these checks
Registry, retraction, Cites and statistics results are computed, not judged, with one exception: a printed reference that no index lists is read once by a model before it counts as a citation error. Claims are extracted by a model and kept only when their quote appears verbatim in the text; each cited source is then checked, with a model’s help, for whether it says what the claim relies on. Those verdicts can be wrong — read the claim’s quote and the cited source before relying on one.
Statistics and arithmetic are recomputed, not judged.
Confidence bands are shown only for fields calibrated on our annotated test set. None is calibrated yet, so no band is shown.
What counts as a claim ›How we measure confidence ›How we check this ›
Are you an author, or do you see a problem with this page? Request a review
How to cite
Cite CoChat for the checks on this page, and the paper for its own findings.
- This page
- CoChat. (2026). Citation check: Remote Sensing with UAVs for Flood Modeling: A Validation with Actual Flood Records. https://app.cochat.ai/papers/10.3390/w15213813
- The paper
- Clasing, R., Muñoz, E., Arumí, J. L., & Parra, V. (2023). Remote Sensing with UAVs for Flood Modeling: A Validation with Actual Flood Records. Water. https://doi.org/10.3390/w15213813
Data sources
Bibliographic data: Semantic Scholar, OpenAlex, Crossref.
Contains information from the Semantic Scholar Academic Graph Datasets, made available under the ODC Attribution License (ODC-BY 1.0).
Semantic Scholar’s data is described in: Kinney, R., et al. (2023). The Semantic Scholar Open Data Platform. arXiv:2301.10140.
