

The DOI matches its Crossref record; 45 of the 45 references it cites were found in a registry or an index.
Multiscale modelling of biomolecular corona formation on metallic surfaces
Open accessPublished version of a preprint
Abstract
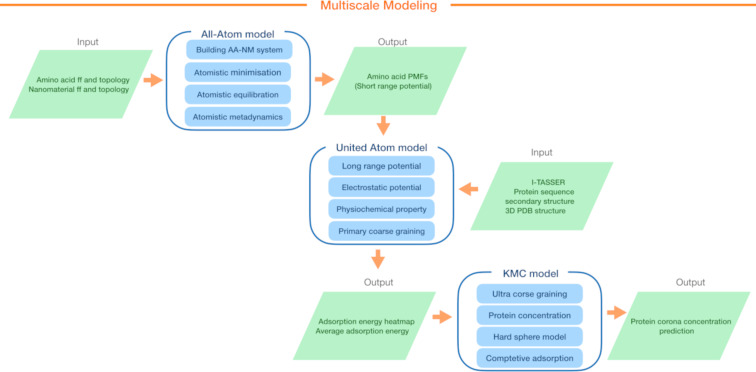
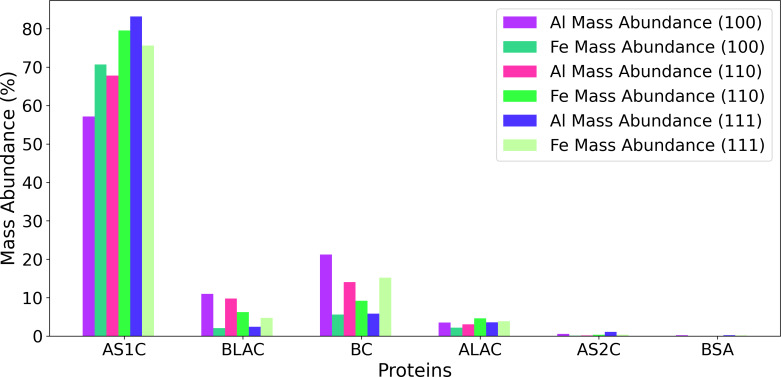
In the realm of food industry, the choice of non-consumable materials used plays a crucial role in ensuring consumer safety and product quality. Aluminum is widely used in food packaging and food processing applications, including dairy products. However, the interaction between aluminum and milk content requires further investigation to understand its implications. In this work, we present the results of multiscale modelling of the interaction between various surfaces, that is (100), (110), and (111), of fcc aluminum with the most abundant milk proteins and lactose. Our approach combines atomistic molecular dynamics, a coarse-grained model of protein adsorption, and kinetic Monte Carlo simulations to predict the protein corona composition in the deposited milk layer on aluminum surfaces. We consider a simplified model of milk, which is composed of the six most abundant milk proteins found in natural cow milk and lactose, which is the most abundant sugar found in dairy. Through our study, we ranked selected proteins and lactose adsorption affinities based on their corresponding interaction strength with aluminum surfaces and predicted the content of the naturally forming biomolecular corona. Our comprehensive investigation sheds light on the implications of aluminum in food processing and packaging, particularly concerning its interaction with the most abundant milk proteins and lactose. By employing a multiscale modelling approach, we simulated the interaction between metallic aluminum surfaces and the proteins and lactose, considering different crystallographic orientations. The results of our study provide valuable insights into the mechanisms of lactose and protein deposition on aluminum surfaces, which can aid in the general understanding of protein corona formation.
Overview
The claims and statistics of this paper haven’t been checked yet.
Run the check — free, no account needed. It reads the open-access text and checks the sources it cites.
Integrity signals
Registry
Cites
Statistics
Figures
Verification
Claims the paper makes
The claims and statistics of this paper haven’t been checked yet.
Run the check — free, no account needed. It reads the open-access text and checks the sources it cites.
Self-check
Percentages, sums and reported differences re-computed from the paper’s own numbers.
The self-check needs the paper’s full text.
Citations
Cites
Highly accurate protein structure prediction with AlphaFold
Jumper, J., Evans, R., Pritzel, A., Green, T., Figurnov, M., Ronneberger, O., Tunyasuvunakool, K., Bates, R., Žídek, A., Potapenko, A., et al. (2021) · Nature · doi:10.1038/s41586-021-03819-2 · Cited by 43,764
Molecular dynamics with coupling to an external bath
Berendsen, H. J. C., Postma, J. P. M., van Gunsteren, W. F., DiNola, A., & Haak, J. R. (1984) · The Journal of Chemical Physics · doi:10.1063/1.448118 · Cited by 30,700
Development and testing of a general amber force field
Wang, J., Wolf, R. M., Caldwell, J. W., Kollman, P. A., & Case, D. A. (2004) · Journal of Computational Chemistry · doi:10.1002/jcc.20035 · Cited by 19,506
GROMACS 4: Algorithms for Highly Efficient, Load-Balanced, and Scalable Molecular Simulation
Hess, B., Kutzner, C., van der Spoel, D., & Lindahl, E. (2008) · Journal of Chemical Theory and Computation · doi:10.1021/ct700301q · Cited by 15,908
CHARMM‐GUI: A web‐based graphical user interface for CHARMM
Jo, S., Kim, T., Iyer, V. G., & Im, W. (2008) · Journal of Computational Chemistry · doi:10.1002/jcc.20945 · Cited by 9,284
GROMACS 4.5: a high-throughput and highly parallel open source molecular simulation toolkit
Pronk, S., Páll, S., Schulz, R., Larsson, P., Bjelkmar, P., Apostolov, R., Shirts, M. R., Smith, J. C., Kasson, P. M., van der Spoel, D., et al. (2013) · Bioinformatics · doi:10.1093/bioinformatics/btt055 · Cited by 7,567
Understanding biophysicochemical interactions at the nano–bio interface
Nel, A. E., Mädler, L., Velegol, D., Xia, T., Hoek, E. M. V., Somasundaran, P., Klaessig, F., Castranova, V., & Thompson, M. (2009) · Nature Materials · doi:10.1038/nmat2442 · Cited by 7,083
I-TASSER: a unified platform for automated protein structure and function prediction
Roy, A., Küçükural, A., & Zhang, Y. (2010) · Nature Protocols · doi:10.1038/nprot.2010.5 · Cited by 6,224
Automatic atom type and bond type perception in molecular mechanical calculations
Wang, J., Wang, W., Kollman, P. A., & Case, D. A. (2006) · Journal of Molecular Graphics and Modelling · doi:10.1016/j.jmgm.2005.12.005 · Cited by 5,517
PROPKA3: Consistent Treatment of Internal and Surface Residues in Empirical p KaPredictions
Olsson, M. H. M., Søndergaard, C. R., Rostkowski, M., & Jensen, J. H. (2011) · Journal of Chemical Theory and Computation · doi:10.1021/ct100578z · Cited by 4,435
Polish journal of environmental studies
Ryczkowski, J. (1993) · Applied Catalysis A General · doi:10.1016/0926-860x(93)80167-o · Cited by 3,981
PLUMED 2: New feathers for an old bird
Tribello, G. A., Bonomi, M., Branduardi, D., Camilloni, C., & Bussi, G. (2013) · Computer Physics Communications · doi:10.1016/j.cpc.2013.09.018 · Cited by 3,529
ACPYPE - AnteChamber PYthon Parser interfacE
da Silva, A. S., & Vranken, W. (2012) · BMC Research Notes · doi:10.1186/1756-0500-5-367 · Cited by 3,295
On the mechanisms of biocompatibility
Williams, D. F. (2008) · Biomaterials · doi:10.1016/j.biomaterials.2008.04.023 · Cited by 2,772
Søndergaard, C. R., Olsson, M. H. M., Rostkowski, M., & Jensen, J. H. (2011) · Journal of Chemical Theory and Computation · doi:10.1021/ct200133y · Cited by 1,966
Monopoli, M. P., Walczyk, D., Campbell, A., Elia, G., Lynch, I., Baldelli Bombelli, F., & Dawson, K. A. (2011) · Journal of the American Chemical Society · doi:10.1021/ja107583h · Cited by 1,835
Protein Corona Fingerprinting Predicts the Cellular Interaction of Gold and Silver Nanoparticles
Walkey, C. D., Olsen, J. B., Song, F., Liu, R., Guo, H., Olsen, D. W. H., Cohen, Y., Emili, A., & Chan, W. C. W. (2014) · ACS Nano · doi:10.1021/nn406018q · Cited by 815
Surface Chemistry Influences Implant Biocompatibility
Tang, L., Thevenot, P., & Hu, W. (2008) · Current Topics in Medicinal Chemistry · doi:10.2174/156802608783790901 · Cited by 800
Testing Metal‐Oxide Nanomaterials for Human Safety
Landsiedel, R., Ma‐Hock, L., Kröll, A., Hahn, D., Schnekenburger, J., Wiench, K., & Wohlleben, W. (2010) · Advanced Materials · doi:10.1002/adma.200902658 · Cited by 394
Evaluation of nanoparticle immunotoxicity
Dobrovolskaia, M. A., Germolec, D. R., & Weaver, J. L. (2009) · Nature Nanotechnology · doi:10.1038/nnano.2009.175 · Cited by 368
Understanding the Kinetics of Protein–Nanoparticle Corona Formation
Vilanova, O., Mittag, J. J., Kelly, P. M., Milani, S., Dawson, K. A., Rädler, J. O., & Franzese, G. (2016) · ACS Nano · doi:10.1021/acsnano.6b04858 · Cited by 297
Aluminium Foil as a Food Packaging Material in Comparison with Other Materials
Lamberti, M., & Escher, F. (2007) · Food Reviews International · doi:10.1080/87559120701593830 · Cited by 135
Bio-nano interface and environment: A critical review
Pulido‐Reyes, G., Leganés, F., Fernández‐Piñas, F., & Rosal, R. (2017) · Environmental Toxicology and Chemistry · doi:10.1002/etc.3924 · Cited by 133
Modelling and predicting the biological effects of nanomaterials
Winkler, D. A., Burden, F. R., Yan, B., Weissleder, R., Tassa, C., Shaw, S. Y., & Epa, V. C. (2014) · SAR and QSAR in environmental research · doi:10.1080/1062936x.2013.874367 · Cited by 113
Brandt, E. G., & Lyubartsev, A. P. (2015) · The Journal of Physical Chemistry C · doi:10.1021/acs.jpcc.5b02670 · Cited by 108
Sahneh, F. D., Scoglio, C., & Riviere, J. E. (2013) · PLoS ONE · doi:10.1371/journal.pone.0064690 · Cited by 99
Coarse-grained model of adsorption of blood plasma proteins onto nanoparticles
Silva, H. L., & Lobaskin, V. (2015) · The Journal of Chemical Physics · doi:10.1063/1.4936908 · Cited by 89
Self-citationRepresenting and describing nanomaterials in predictive nanoinformatics
Wyrzykowska, E., Mikołajczyk, A., Lynch, I., Jeliazkova, N., Kochev, N. T., Sarimveis, H., Doganis, P., Karatzas, P., Afantitis, A., Melagraki, G., et al. (2022) · Nature Nanotechnology · doi:10.1038/s41565-022-01173-6 · Cited by 86
Self-citationDybeck, E. C., Plaisance, C. P., & Neurock, M. (2017) · Journal of Chemical Theory and Computation · doi:10.1021/acs.jctc.6b00859 · Cited by 81
Competitive adsorption of multiple proteins to nanoparticles: the Vroman effect revisited
Angioletti‐Uberti, S., Ballauff, M., & Dzubiella, J. (2018) · Molecular Physics · doi:10.1080/00268976.2018.1467056 · Cited by 78
Recent Advances in Dairy Packaging
Karaman, A. D., Özer, B., Pascall, M. A., & Alvárez, V. B. (2015) · Food Reviews International · doi:10.1080/87559129.2015.1015138 · Cited by 76
Coarse-grained model of adsorption of blood plasma proteins onto nanoparticles
Silva, H. L., & Lobaskin, V. (2017) · Arrow@dit (Dublin Institute of Technology) · Cited by 52
Self-citationProtein adsorption on nanoparticles: model development using computer simulation
Shao, Q., & Hall, C. K. (2016) · Journal of Physics Condensed Matter · doi:10.1088/0953-8984/28/41/414019 · Cited by 47
First principles characterisation of bio–nano interface
Rouse, I., Power, D., Brandt, E. G., Schneemilch, M., Kotsis, K., Quirke, N., Lyubartsev, A. P., & Lobaskin, V. (2021) · Physical Chemistry Chemical Physics · doi:10.1039/d1cp01116b · Cited by 46
Self-citationA multiscale model of protein adsorption on a nanoparticle surface
Power, D., Rouse, I., Poggio, S., Brandt, E. G., Silva, H. L., Lyubartsev, A. P., & Lobaskin, V. (2019) · Modelling and Simulation in Materials Science and Engineering · doi:10.1088/1361-651x/ab3b6e · Cited by 42
Self-citationHasenkopf, I., Mills-Goodlet, R., Johnson, L., Rouse, I., Geppert, M., Duschl, A., Maier, D., Lobaskin, V., Lynch, I., & Himly, M. (2022) · Nano Today · doi:10.1016/j.nantod.2022.101561 · Cited by 33
Self-citationA hard-sphere model of protein corona formation on spherical and cylindrical nanoparticles
Rouse, I., & Lobaskin, V. (2021) · Biophysical Journal · doi:10.1016/j.bpj.2021.09.002 · Cited by 30
Self-citationSubbotina, J., Rouse, I., & Lobaskin, V. (2023) · Nanoscale · doi:10.1039/d3nr03264g · Cited by 22
Self-citationMultiscale Modeling of Bio-Nano Interactions of Zero-Valent Silver Nanoparticles
Subbotina, J., & Lobaskin, V. (2022) · The Journal of Physical Chemistry B · doi:10.1021/acs.jpcb.1c09525 · Cited by 20
Self-citationMilk Protein Adsorption on Metallic Iron Surfaces
(2023) · doi:10.3390/nano13121857 · Cited by 17
Machine-learning based prediction of small molecule–surface interaction potentials
Rouse, I., & Lobaskin, V. (2022) · Faraday Discussions · doi:10.1039/d2fd00155a · Cited by 9
Self-citation[Occurrence of aluminum in some foodstuffs].
Nabrzyski, M., Gajewska, R., Czuprynska-Rzepko, A., & Sandak-Bosak, K. (1994) · PubMed · Cited by 2
Facets of Nanotechnology in Food Processing, Packaging and Safety: An Emerald Insight
Das, S., Panda, S. H., Bolem, M., Pal, N., Samantaray, B. R., & Thatoi, H. (2021) · Springer eBooks · doi:10.1007/978-981-16-2516-9_5 · Cited by 2
Eskin, N. A. M., & Shahidi, F. (2012) · Elsevier eBooks · doi:10.1016/b978-0-08-091809-9.00018-2 · Cited by 1
Potential of Mean Force (PMFs) for Zerovalent Aluminium (100-110-111) NanoParticles
Amini, P. M. (2023) · Zenodo (CERN European Organization for Nuclear Research) · doi:10.5281/zenodo.8334052 · Cited by 1
Self-citation
Research works printed but not linked: 2
- Nabrzyski, 1994, Rocz. Panstw. Zakl. Hig., 45, 1181
- 10.1039/d1cp01116b · DOI
Metadata
- Authors
- Amini, P. M., Rouse, I., Subbotina, J., & Lobaskin, V.
- Affiliations
- University College Dublin (IE)
- Corresponding author
- Amini, Parinaz Mosaddeghi
- Venue
- Beilstein Journal of Nanotechnology
- Publisher
- Beilstein Institut
- Published
- 2024-02-13
- Volume
- 15
- Pages
- 215-229
- ISSN
- 2190-4286 (ISSN-L)
- PMC
- PMC10877083
- OpenAlex
- W4391779980
- Cited by
- 10
- References
- 45
- Citations by year
- 2026: 4 · 2025: 2 · 2024: 4
- FWCI
- 0.97
- Type
- journal article
- Language
- en
- Open access
- diamond
- doi.org
- Licence
- cc-by
- creativecommons.org/licenses/by/4.0 (vor)
- creativecommons.org/licenses/by/4.0 (am)
- creativecommons.org/licenses/by/4.0 (tdm)
- Locations
- Beilstein Journal of Nanotechnology (publishedVersion, cc-by)
- PubMed Central (publishedVersion, cc-by)
- PubMed (publishedVersion)
- DOAJ (DOAJ: Directory of Open Access Journals) (submittedVersion)
- Research Repository UCD (University College Dublin) (submittedVersion, cc-by)
- Funders
- European Commission (101092741, HORIZON2020, 814572)
- Science Foundation Ireland (16/IA/4506)
- Irish Centre for High-End Computing
- Topics
- Physical Sciences › Materials Science › Surfaces, Coatings and Films › Polymer Surface Interaction Studies
- Life Sciences › Agricultural and Biological Sciences › Food Science › Proteins in Food Systems
- Physical Sciences › Materials Science › Materials Chemistry › Corrosion Behavior and Inhibition
- Keywords
- protein corona, biomolecular corona, aluminum surfaces, milk protein, protein adsorption, food packaging, dairy products, multiscale modeling, atomistic molecular dynamics, coarse-grained protein models, kinetic Monte Carlo
About these checks
Registry, retraction, Cites and statistics results are computed, not judged, with one exception: a printed reference that no index lists is read once by a model before it counts as a citation error. Claims are extracted by a model and kept only when their quote appears verbatim in the text; each cited source is then checked, with a model’s help, for whether it says what the claim relies on. Those verdicts can be wrong — read the claim’s quote and the cited source before relying on one.
Statistics and arithmetic are recomputed, not judged.
Confidence bands are shown only for fields calibrated on our annotated test set. None is calibrated yet, so no band is shown.
What counts as a claim ›How we measure confidence ›How we check this ›
Are you an author, or do you see a problem with this page? Request a review
Data sources
Bibliographic data: Semantic Scholar, OpenAlex, Crossref.
Contains information from the Semantic Scholar Academic Graph Datasets, made available under the ODC Attribution License (ODC-BY 1.0).
Semantic Scholar’s data is described in: Kinney, R., et al. (2023). The Semantic Scholar Open Data Platform. arXiv:2301.10140.
