

The DOI matches its DataCite record; its reference list is not available; 7 of the 17 sources its claims cite were checked for support.
SegQC: a segmentation network-based framework for multi-metric segmentation quality control and segmentation error detection in volumetric medical images
Open accessAbstract
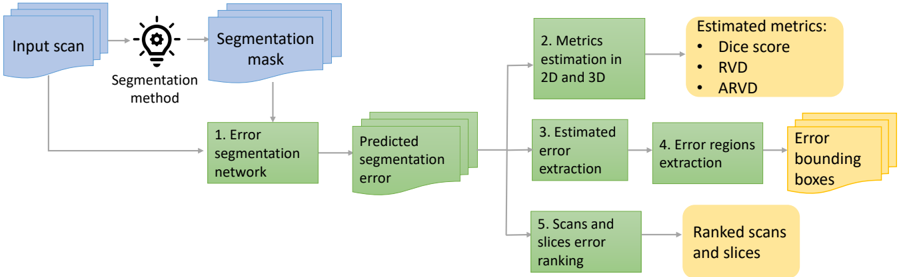
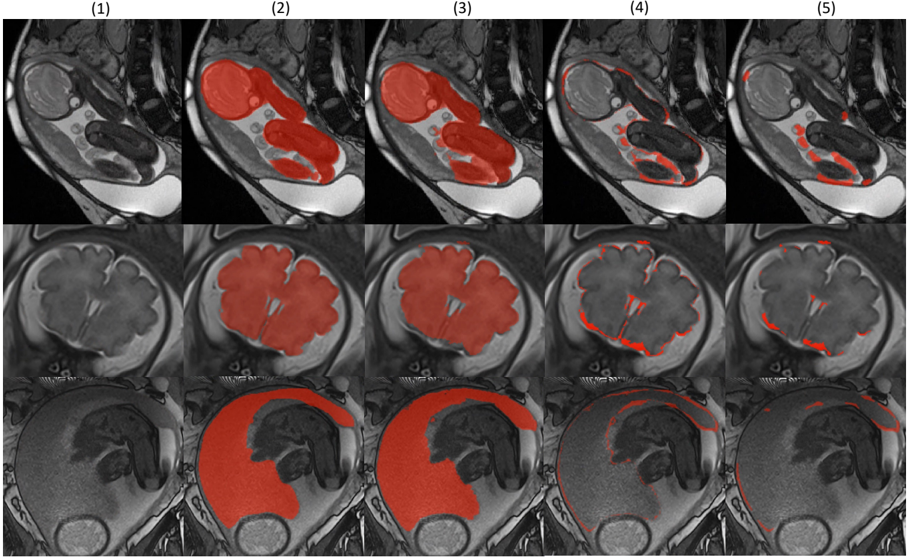
Quality control of structures segmentation in volumetric medical images is important for identifying segmentation errors in clinical practice and for facilitating model development. This paper introduces SegQC, a novel framework for segmentation quality estimation and segmentation error detection. SegQC computes an estimate measure of the quality of a segmentation in volumetric scans and in their individual slices and identifies possible segmentation error regions within a slice. The key components include: 1. SegQC-Net, a deep network that inputs a scan and its segmentation mask and outputs segmentation error probabilities for each voxel in the scan; 2. three new segmentation quality metrics, two overlap metrics and a structure size metric, computed from the segmentation error probabilities; 3. a new method for detecting possible segmentation errors in scan slices computed from the segmentation error probabilities. We introduce a new evaluation scheme to measure segmentation error discrepancies based on an expert radiologist corrections of automatically produced segmentations that yields smaller observer variability and is closer to actual segmentation errors. We demonstrate SegQC on three fetal structures in 198 fetal MRI scans: fetal brain, fetal body and the placenta. To assess the benefits of SegQC, we compare it to the unsupervised Test Time Augmentation (TTA)-based quality estimation. Our studies indicate that SegQC outperforms TTA-based quality estimation in terms of Pearson correlation and MAE for fetal body and fetal brain structures segmentation. Our segmentation error detection method achieved recall and precision rates of 0.77 and 0.48 for fetal body, and 0.74 and 0.55 for fetal brain segmentation error detection respectively. SegQC enhances segmentation metrics estimation for whole scans and individual slices, as well as provides error regions detection.
Overview
AI snapshot
Written from the paper’s full text.
TL;DR
SegQC is a segmentation-network-based framework that estimates Dice, IoU, and ARVD quality metrics in 2D and 3D and detects segmentation error regions in volumetric medical images. Evaluated on fetal MRI, it generally outperformed unsupervised TTA-based quality estimation for fetal body and brain segmentation and improved error-region detection when estimated error extraction was applied.
Key findings
- SegQC improved metric estimation over TTA in most reported cases: for fetal body corrections data, Dice MAE was 0.008 vs. 0.013 for TTA; for fetal brain corrections data, Dice MAE was 0.020 vs. 0.052. For stratified placenta data, Dice MAE was 0.082 vs. 0.160 for TTA.
- Pearson correlations were higher for SegQC than TTA: for fetal body corrections data, 3D Dice correlation was 0.692 vs. 0.229; for fetal brain corrections data, 3D Dice correlation was 0.898 vs. 0.230.
- Segmentation error detection at IoU 0.05 improved with estimated error extraction: fetal body precision/recall was 0.48/0.77 with extraction vs. 0.29/0.55 without; fetal brain was 0.55/0.74 with extraction vs. 0.52/0.63 without.
- Correction-ranking performance based on quality estimation showed only minor differences between SegQC and TTA in several settings, despite SegQC’s better MAE and correlation.
Methods
- SegQC-Net inputs a volumetric scan and segmentation mask and outputs voxel-wise segmentation error probabilities; these are used to estimate Dice, IoU, and absolute Relative Volume Difference (ARVD) in 2D and 3D, and to extract 2D error-region bounding boxes.
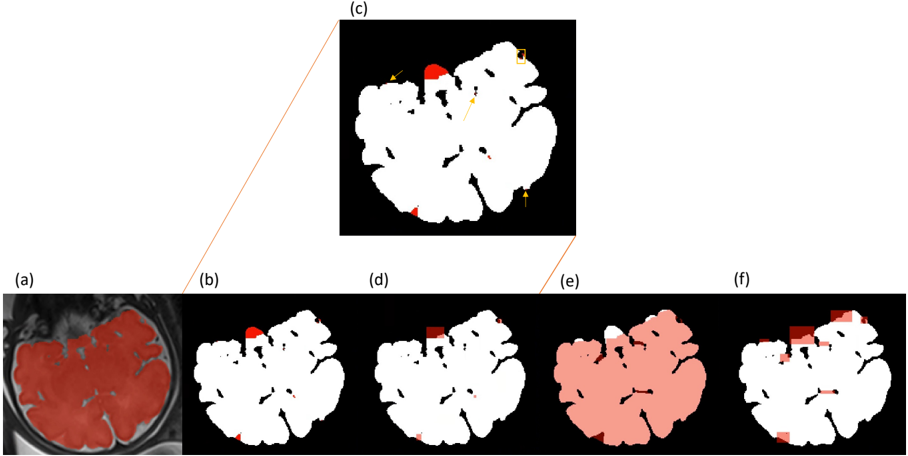
- Training data were generated from a segmentation network with test-time augmentations and mask augmentations; error extraction removes a band around the difference-volume contour and small components. Evaluation used corrections datasets and stratified-quality datasets.
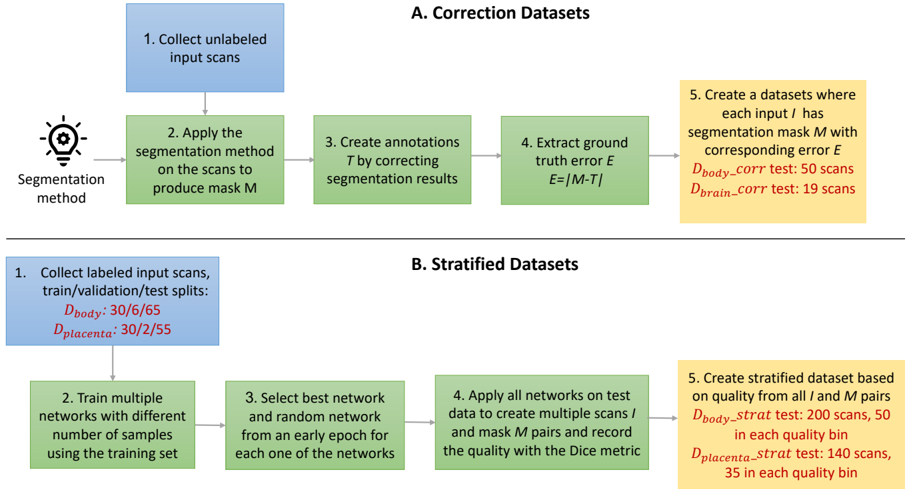
- The study evaluated 101 fetal body, 40 fetal brain, and 57 placenta cases from fetal MRI. Metrics included MAE, Pearson correlation, paired two-sided t-tests, and average precision/recall for error detection.
Limitations
- The paper states that SegQC performed relatively worse for 2D than 3D data, possibly due to the volumetric nature of the network, and suggests future work with 2D networks and other architectures.
- The paper states that corrections data are limited in quality range and that stratified-quality evaluation remains important; placenta results were mixed, possibly due to high observer variability.
- Evident from the text: the fetal brain corrections dataset was small (19 test cases), and the authors state they do not have permission to share data.
Model-written summary. Check it against the paper before relying on it.
Integrity signals
Registry
Cites
Statistics
Figures
Verification
Claims the paper makes
28 Own result · 22 Own interpretation · 5 Sources not found · 4 Own method · 3 Supported · 3 Partly supported · 2 No basis given · 1 Not checked yet · accuracy not yet measured
Every source the paper cites for this claim was checked and supports it.
In the paper
“Most state-of-the-art automatic segmentation methods for volumetric scans are based on deep neural networks that require a large, high-quality dataset of expertvalidated annotations, which is expensive and very difficult to obtain (Tajbakhsh et al., 2020).”
What the sources say
- Supportedcites Tajbakhsh et al., 2020 source
The Introduction (p. 1) says state-of-the-art neural segmentation architectures require large, high-quality annotated datasets and that medical images and annotations are expensive to acquire. The Interactive Segmentation section (p. 12) adds that expert annotation is time-consuming and particularly costly for volumetric images. (LLM, conf=0.89)
plainstates a cause- Asserted: passes — The authors put it forward as true.
- Checkable: passes — It can be checked against evidence.
- Load-bearing: passes — The paper’s conclusions depend on it.
- Based: passes — The paper gives a reason why it holds.
- Supported
The cited sources support only part of this claim — read each source’s verdict below.
In the paper
“Studies show that ground truth segmentation that was created by correcting a segmentation mask is different from the original mask mostly by segmentation error (Chlebus et al., 2019).”
What the sources say
- Partly supportedcites Chlebus et al., 2019 sourceExperimental — accuracy not yet measured
The Materials and methods (Experiments; page unavailable) say observers corrected major errors in automatic liver masks, supporting the idea that corrections address segmentation errors. But the Methods passage says the study’s reference segmentations were manually created and used to evaluate the corrected masks; it does not identify the corrected masks as ground truth or establish that their differences from the originals were mostly errors. (LLM, conf=0.86)
plainstates an association- Asserted: passes — The authors put it forward as true.
- Checkable: passes — It can be checked against evidence.
- Load-bearing: passes — The paper’s conclusions depend on it.
- Based: passes — The paper gives a reason why it holds.
- Partly supported
A result the paper reports from its own data — it cites no other source for it, so there is none to check. The quote shows it is in the paper.
In the paper
“Pearson correlations for the SegQC network are higher compared to TTA-based estimation.”
plainstates an association- Asserted: passes — The authors put it forward as true.
- Checkable: passes — It can be checked against evidence.
- Load-bearing: passes — The paper’s conclusions depend on it.
- Based: passes — The paper gives a reason why it holds.
A result the paper reports from its own data — it cites no other source for it, so there is none to check. The quote shows it is in the paper.
In the paper
“Computing the estimated segmentation errors from the SegQC-Net output was also beneficial for fetal brain segmentation error detection, with a precision of 0.55 and a recall of 0.74 vs. a precision of 0.52 and a recall of 0.63 without estimated error extraction.”
plainstates a cause- Asserted: passes — The authors put it forward as true.
- Checkable: passes — It can be checked against evidence.
- Load-bearing: passes — The paper’s conclusions depend on it.
- Based: passes — The paper gives a reason why it holds.
A result the paper reports from its own data — it cites no other source for it, so there is none to check. The quote shows it is in the paper.
In the paper
“Our studies indicate that SegQC outperforms TTA-based quality estimation in terms of Pearson correlation and MAE for fetal body and fetal brain structures segmentation.”
hedgedstates a cause- Asserted: passes — The authors put it forward as true.
- Checkable: passes — It can be checked against evidence.
- Load-bearing: passes — The paper’s conclusions depend on it.
- Based: passes — The paper gives a reason why it holds.
A result the paper reports from its own data — it cites no other source for it, so there is none to check. The quote shows it is in the paper.
In the paper
“Metrics estimation in terms of MAE are significantly better using SegQC network compared to TTA estimation except for the 3D AVDR metric when training with stratified data.”
plainstates a cause- Asserted: passes — The authors put it forward as true.
- Checkable: passes — It can be checked against evidence.
- Load-bearing: passes — The paper’s conclusions depend on it.
- Based: passes — The paper gives a reason why it holds.
A result the paper reports from its own data — it cites no other source for it, so there is none to check. The quote shows it is in the paper.
In the paper
“For fetal brain segmentation, for all metrics except for 3D AVDR, the MAE results are significantly better for the SegQC estimation compared to TTA-based quality estimation method.”
plainn = 19 ·- Asserted: passes — The authors put it forward as true.
- Checkable: passes — It can be checked against evidence.
- Load-bearing: passes — The paper’s conclusions depend on it.
- Based: passes — The paper gives a reason why it holds.
A result the paper reports from its own data — it cites no other source for it, so there is none to check. The quote shows it is in the paper.
In the paper
“For fetal body segmentation quality estimation, the MAE results of 2D metrics are significantly better using the SegQC network compared to TTA-based estimation.”
plainstates a causen = 45 ·- Asserted: passes — The authors put it forward as true.
- Checkable: passes — It can be checked against evidence.
- Load-bearing: passes — The paper’s conclusions depend on it.
- Based: passes — The paper gives a reason why it holds.
A result the paper reports from its own data — it cites no other source for it, so there is none to check. The quote shows it is in the paper.
In the paper
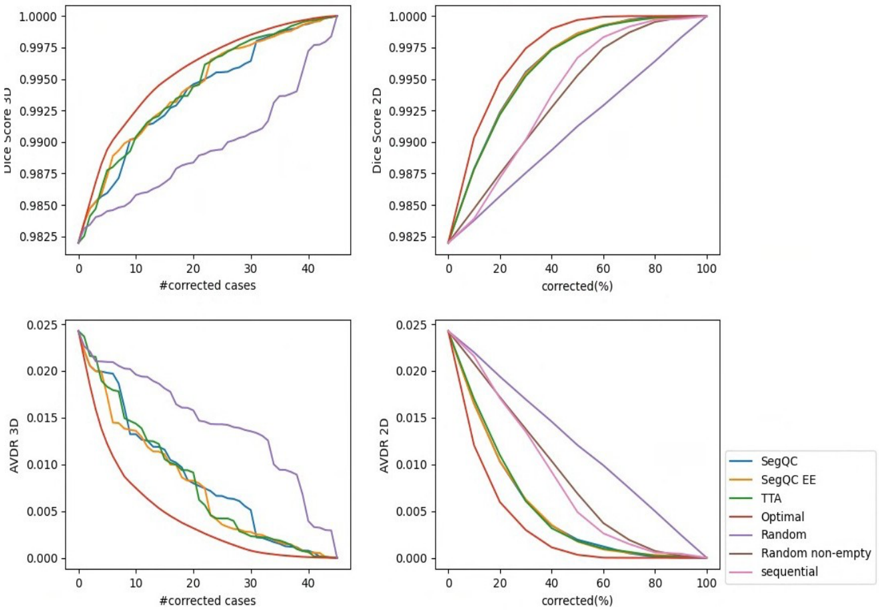
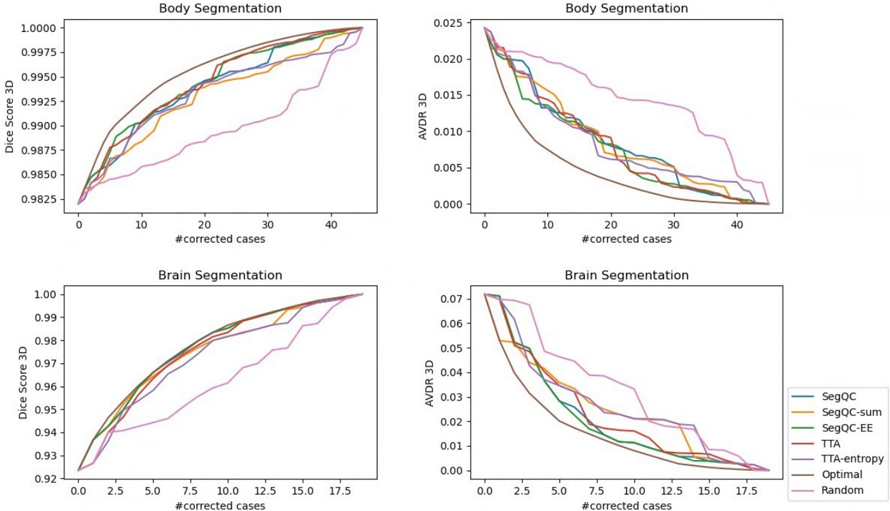
“Despite the large differences in MAE and Person correlation for the fetal body segmentation error estimation, the differences in 3D and 2D segmentation correction results are minor.”
plain- Asserted: passes — The authors put it forward as true.
- Checkable: passes — It can be checked against evidence.
- Load-bearing: unclear — It is unclear whether the paper’s conclusions depend on it.
- Based: passes — The paper gives a reason why it holds.
A result the paper reports from its own data — it cites no other source for it, so there is none to check. The quote shows it is in the paper.
In the paper
“However, in terms of correction graphs in both 3D and 2D there is almost no difference between ranking using TTA estimation and ranking using SegQC networks masks qualities to using masks of only one of the segmentation networks that produces relatively high-quality masks.”
plain- Asserted: passes — The authors put it forward as true.
- Checkable: passes — It can be checked against evidence.
- Load-bearing: unclear — It is unclear whether the paper’s conclusions depend on it.
- Based: passes — The paper gives a reason why it holds.
A result the paper reports from its own data — it cites no other source for it, so there is none to check. The quote shows it is in the paper.
In the paper
“For fetal body segmentation error detection, using SegQC-Net followed estimated error extraction performed better compared to SegQC-Net without it, with a precision of 0.48 and a recall of 0.77 for IoU of 0.05% vs. a precision of 0.29 and a recall of 0.55.”
plainstates a cause- Asserted: passes — The authors put it forward as true.
- Checkable: passes — It can be checked against evidence.
- Load-bearing: passes — The paper’s conclusions depend on it.
- Based: passes — The paper gives a reason why it holds.
The paper states this without a source or data behind it here, so there is nothing to check it against. The quote shows it is in the paper.
In the paper
“The key observation is that a deepl learning network, called SegQC-Net, can correctly identify the segmentation error regions in high quality segmentations despite the poor error segmentation performance.”
plain- Asserted: passes — The authors put it forward as true.
- Checkable: passes — It can be checked against evidence.
- Load-bearing: passes — The paper’s conclusions depend on it.
- Based: unclear — It is unclear why the paper says it holds.
A result the paper reports from its own data — it cites no other source for it, so there is none to check. The quote shows it is in the paper.
In the paper
“Furthermore, metrics estimation using the SegQC network trained on masks of a single network without stratification outperformed TTA metrics estimation as well.”
plainstates a cause- Asserted: passes — The authors put it forward as true.
- Checkable: passes — It can be checked against evidence.
- Load-bearing: unclear — It is unclear whether the paper’s conclusions depend on it.
- Based: passes — The paper gives a reason why it holds.
A result the paper reports from its own data — it cites no other source for it, so there is none to check. The quote shows it is in the paper.
In the paper
“Using SegQC networks, metrics estimation in 2D demonstrated a decline in performance compared to 3D metrics estimation.”
boostedstates a cause- Asserted: passes — The authors put it forward as true.
- Checkable: passes — It can be checked against evidence.
- Load-bearing: unclear — It is unclear whether the paper’s conclusions depend on it.
- Based: passes — The paper gives a reason why it holds.
A result the paper reports from its own data — it cites no other source for it, so there is none to check. The quote shows it is in the paper.
In the paper
“Correction performance in 3D for both fetal body and brain segmentations was worse for sum and entropy compared to their metric estimation counterparts of SegQC networks and TTA, respectively”
plain- Asserted: passes — The authors put it forward as true.
- Checkable: passes — It can be checked against evidence.
- Load-bearing: passes — The paper’s conclusions depend on it.
- Based: passes — The paper gives a reason why it holds.
A result the paper reports from its own data — it cites no other source for it, so there is none to check. The quote shows it is in the paper.
In the paper
“The results of the segmentation error detection show the benefit of our error extraction method for detecting error regions, even for very small segmentation errors.”
plainstates a cause- Asserted: passes — The authors put it forward as true.
- Checkable: passes — It can be checked against evidence.
- Load-bearing: passes — The paper’s conclusions depend on it.
- Based: passes — The paper gives a reason why it holds.
A result the paper reports from its own data — it cites no other source for it, so there is none to check. The quote shows it is in the paper.
In the paper
“They also demonstrate improved Pearson correlation with mask augmentations for the SegQC network.”
boostedstates a cause- Asserted: passes — The authors put it forward as true.
- Checkable: passes — It can be checked against evidence.
- Load-bearing: unclear — It is unclear whether the paper’s conclusions depend on it.
- Based: passes — The paper gives a reason why it holds.
A result the paper reports from its own data — it cites no other source for it, so there is none to check. The quote shows it is in the paper.
In the paper
“Our studies on segmentation corrections data indicate that the supervised SegQC method outperforms TTA-based quality estimation in most cases in terms of the Pearson correlation and the MAE for fetal body and fetal brain structures segmentation.”
hedgedstates a cause- Asserted: passes — The authors put it forward as true.
- Checkable: passes — It can be checked against evidence.
- Load-bearing: passes — The paper’s conclusions depend on it.
- Based: passes — The paper gives a reason why it holds.
A result the paper reports from its own data — it cites no other source for it, so there is none to check. The quote shows it is in the paper.
In the paper
“The ablation studies with correction graphs evaluation show the benefit of using a direct Dice score estimation compared to entropy and sum estimations for TTA and SegQC methods respectively.”
plainstates a cause- Asserted: passes — The authors put it forward as true.
- Checkable: passes — It can be checked against evidence.
- Load-bearing: passes — The paper’s conclusions depend on it.
- Based: passes — The paper gives a reason why it holds.
A result the paper states — it cites no source for it, so there is none to check. The quote shows it is in the paper.
In the paper
“Results indicate a relatively lower quality estimation performance of the SegQC method for 2D compared to 3D data.”
hedgedstates an association- Asserted: passes — The authors put it forward as true.
- Checkable: passes — It can be checked against evidence.
- Load-bearing: unclear — It is unclear whether the paper’s conclusions depend on it.
- Based: passes — The paper gives a reason why it holds.
A result the paper states — it cites no source for it, so there is none to check. The quote shows it is in the paper.
In the paper
“However, for the placenta segmentation task Pearson correlation and MAE results were mixed, especially for 2D evaluation.”
plain- Asserted: passes — The authors put it forward as true.
- Checkable: passes — It can be checked against evidence.
- Load-bearing: unclear — It is unclear whether the paper’s conclusions depend on it.
- Based: passes — The paper gives a reason why it holds.
A conclusion the paper draws from its own results — it cites no other source for it, so there is none to check. The quote shows it is in the paper.
In the paper
“SegQCNet, a deep network that inputs a scan and its segmentation mask and outputs segmentation error probabilities for each voxel in the scan”
plainstates a cause- Asserted: passes — The authors put it forward as true.
- Checkable: passes — It can be checked against evidence.
- Load-bearing: passes — The paper’s conclusions depend on it.
- Based: passes — The paper gives a reason why it holds.
A conclusion the paper draws from its own results — it cites no other source for it, so there is none to check. The quote shows it is in the paper.
In the paper
“This paper introduces SegQC, a novel framework for segmentation quality estimation and segmentation error detection.”
- Also stated in: § 1. Introduction · p. 4 · plain
“This paper introduces SegQC, a novel framework for segmentation quality estimation based on overlap and size metrics and for segmentation error detection in volumetric scan slices.”
plain- Asserted: passes — The authors put it forward as true.
- Checkable: passes — It can be checked against evidence.
- Load-bearing: passes — The paper’s conclusions depend on it.
- Based: passes — The paper gives a reason why it holds.
- Also stated in: § 1. Introduction · p. 4 · plain
A conclusion the paper draws from its own results — it cites no other source for it, so there is none to check. The quote shows it is in the paper.
In the paper
“a new method for detecting possible segmentation errors in scan slices computed from the segmentation error probabilities”
hedgedstates a cause- Asserted: passes — The authors put it forward as true.
- Checkable: passes — It can be checked against evidence.
- Load-bearing: passes — The paper’s conclusions depend on it.
- Based: passes — The paper gives a reason why it holds.
In the paper
“the discrepancy between the ground truth and predicted mask includes both the observer variability and the segmentation error (Joskowicz et al., 2019).”
- Also stated in: § 2. Related work · p. 6 · plain
“The discrepancy between ground truth segmentation and predicted segmentation mask includes the observer variability and the segmentation error (Joskowicz et al., 2019).”
What the sources say
- Not matchedcites Joskowicz et al., 2019
Couldn’t be matched to a paper in Crossref, so it can’t be checked.
plainstates an association- Asserted: passes — The authors put it forward as true.
- Checkable: passes — It can be checked against evidence.
- Load-bearing: passes — The paper’s conclusions depend on it.
- Based: passes — The paper gives a reason why it holds.
- Also stated in: § 2. Related work · p. 6 · plain
What the paper did — it cites no source for this, so there is none to check. The quote shows it is in the paper.
In the paper
“Detection evaluation was not feasible for stratified datasets as we did not have ground truth corrections data for these cases.”
plainstates a cause- Asserted: passes — The authors put it forward as true.
- Checkable: passes — It can be checked against evidence.
- Load-bearing: unclear — It is unclear whether the paper’s conclusions depend on it.
- Based: passes — The paper gives a reason why it holds.
None of the sources cited for this claim have been checked yet.
In the paper
“Several methods have been recently proposed to address the problem of error regions detection, e.g., Audelan and Delingette (2021); Zaman et al. (2023); Qiu et al. (2023). However, they do not provide both segmentation error regions detection and multiple quality metrics estimations in 2D and 3D in a single framework.”
What the sources say
- Not matchedcites Audelan and Delingette (2021)
Couldn’t be matched to a paper in Crossref, so it can’t be checked.
- Not matchedcites Zaman et al. (2023)
Couldn’t be matched to a paper in Crossref, so it can’t be checked.
- Not checked — no full text of the sourcecites Qiu et al. (2023) source
plain- Asserted: passes — The authors put it forward as true.
- Checkable: passes — It can be checked against evidence.
- Load-bearing: passes — The paper’s conclusions depend on it.
- Based: passes — The paper gives a reason why it holds.
- Not matched
A conclusion the paper draws from its own results — it cites no other source for it, so there is none to check. The quote shows it is in the paper.
In the paper
“SegQC computes an estimate measure of the quality of a segmentation in volumetric scans and in their individual slices and identifies possible segmentation error regions within a slice.”
hedgedstates a cause- Asserted: passes — The authors put it forward as true.
- Checkable: passes — It can be checked against evidence.
- Load-bearing: passes — The paper’s conclusions depend on it.
- Based: passes — The paper gives a reason why it holds.
A conclusion the paper draws from its own results — it cites no other source for it, so there is none to check. The quote shows it is in the paper.
In the paper
“three new segmentation quality metrics, two overlap metrics and a structure size metric, computed from the segmentation error probabilities”
plainstates a cause- Asserted: passes — The authors put it forward as true.
- Checkable: passes — It can be checked against evidence.
- Load-bearing: passes — The paper’s conclusions depend on it.
- Based: passes — The paper gives a reason why it holds.
A conclusion the paper draws from its own results — it cites no other source for it, so there is none to check. The quote shows it is in the paper.
In the paper
“SegQC computes an estimate measure of the quality of a segmentation in volumetric scans and in their individual slices and identifies possible segmentation error regions within a slice.”
plainstates a cause- Asserted: passes — The authors put it forward as true.
- Checkable: passes — It can be checked against evidence.
- Load-bearing: passes — The paper’s conclusions depend on it.
- Based: passes — The paper gives a reason why it holds.
A conclusion the paper draws from its own results — it cites no other source for it, so there is none to check. The quote shows it is in the paper.
In the paper
“Thus, evaluating QC performance on corrections data may be a more accurate error assessment.”
hedgedstates a possible cause- Asserted: passes — The authors put it forward as true.
- Checkable: passes — It can be checked against evidence.
- Load-bearing: passes — The paper’s conclusions depend on it.
- Based: passes — The paper gives a reason why it holds.
What the paper did — it cites no source for this, so there is none to check. The quote shows it is in the paper.
In the paper
“We are limited by the quality of the segmentation masks from which the ground truth segmentations were created.”
plainstates a cause- Asserted: passes — The authors put it forward as true.
- Checkable: passes — It can be checked against evidence.
- Load-bearing: passes — The paper’s conclusions depend on it.
- Based: passes — The paper gives a reason why it holds.
A conclusion the paper draws from its own results — it cites no other source for it, so there is none to check. The quote shows it is in the paper.
In the paper
“In contrast, with the stratified qualities evaluation method, the ground truth quality does not necessarily reflect segmentation errors, but rather a combination of segmentation error and observer variability.”
hedgedstates an association- Asserted: passes — The authors put it forward as true.
- Checkable: passes — It can be checked against evidence.
- Load-bearing: passes — The paper’s conclusions depend on it.
- Based: passes — The paper gives a reason why it holds.
A conclusion the paper draws from its own results — it cites no other source for it, so there is none to check. The quote shows it is in the paper.
In the paper
“Unlike other methods that focus on a single quality estimation metric, our approach computes multiple metrics, including overlap estimates of Dice score and the Intersection over Union (IoU, Jaccard index) metrics, and volume size estimate of the absolute Relative Volume Difference (ARVD) metric.”
plain- Asserted: passes — The authors put it forward as true.
- Checkable: passes — It can be checked against evidence.
- Load-bearing: passes — The paper’s conclusions depend on it.
- Based: passes — The paper gives a reason why it holds.
- Rests on an assumption: Other methods focus on a single quality estimation metric.
A conclusion the paper draws from its own results — it cites no other source for it, so there is none to check. The quote shows it is in the paper.
In the paper
“Moreover, correction data enables the evaluation of error detection by identifying ground truth error regions and comparing them with the estimated error regions from the QC method.”
plainstates a cause- Asserted: passes — The authors put it forward as true.
- Checkable: passes — It can be checked against evidence.
- Load-bearing: passes — The paper’s conclusions depend on it.
- Based: passes — The paper gives a reason why it holds.
What the paper did — it cites no source for this, so there is none to check. The quote shows it is in the paper.
In the paper
“The drawback of segmentation corrections data evaluation is the limited types of quality that we can assess using this method.”
plainstates a cause- Asserted: passes — The authors put it forward as true.
- Checkable: passes — It can be checked against evidence.
- Load-bearing: passes — The paper’s conclusions depend on it.
- Based: passes — The paper gives a reason why it holds.
- It may state two separate claims as one. 23
- Probably not a substantial claim. 15
The cited sources support only part of this claim — read each source’s verdict below.
In the paper
“We introduce a new evaluation scheme to measure segmentation error discrepancies based on an expert radiologist corrections of automatically produced segmentations that yields smaller observer variability and is closer to actual segmentation errors.”
What the sources say
- Partly supportedcites Chlebus et al., 2019 sourceExperimental — accuracy not yet measured
In Materials and methods (Experiments), the paper evaluates automatically generated liver masks after corrections by a radiology resident and a radiologist assistant—not corrections by an expert radiologist. The Abstract (Results) reports lower inter-observer variability for corrected masks than for routine manual segmentations. The paper compares masks with reference segmentations, but does not establish that a new evaluation scheme measures discrepancies closer to actual segmentation errors. (LLM, conf=0.86)
plainstates a cause- Asserted: passes — The authors put it forward as true.
- Checkable: passes — It can be checked against evidence.
- Load-bearing: passes — The paper’s conclusions depend on it.
- Based: passes — The paper gives a reason why it holds.
It may state two separate claims as one.
- Partly supported
Every source the paper cites for this claim was checked and supports it.
In the paper
“Correcting the computed segmentation mask introduces inductive bias to the manual segmentation and may result in reduced observer variability compared to manual delineations from scratch (Chlebus et al., 2019).”
What the sources say
- Supportedcites Chlebus et al., 2019 source
The Discussion says correcting automatic liver masks makes contours and volume measurements less subjective than segmenting from scratch, and that the automatic suggestions may guide observers toward consistent segmentations. The Conclusion reports significantly lower inter-observer variability for corrected masks than for manual segmentations from scratch. Together, these support the claim’s description of a guiding effect and reduced variability. (LLM, conf=0.92)
hedgedstates a possible cause- Asserted: passes — The authors put it forward as true.
- Checkable: passes — It can be checked against evidence.
- Load-bearing: fails — The paper’s conclusions may not depend on it.
- Based: passes — The paper gives a reason why it holds.
Probably not a substantial claim. The paper’s conclusions may not depend on it. It may state two separate claims as one.
- Supported
The cited sources support only part of this claim — read each source’s verdict below.
In the paper
“Methods for leveraging unlabeled data to create better classification models with fewer annotated datasets, e.g. with self-training (Cheplygina et al. , 2019) and active learning (Tajbakhsh et al., 2020) have been proposed.”
What the sources say
- Supportedcites Cheplygina et al., 2019 source
The citation is attached to self-training, not active learning. Section 3 (p. 4) describes self-training as using predictions on unlabeled data to enlarge the training set, and Section 3.2 (p. 5) surveys its use in medical imaging. The Introduction (p. 1) identifies a lack of labeled data as a motivation for these approaches. (LLM, conf=0.93)
- Partly supportedcites Tajbakhsh et al., 2020 sourceExperimental — accuracy not yet measured
Section 4.3 (p. 9) says active learning selects unlabeled medical images for annotation to maximize model performance under a limited annotation budget. Section 4.3.1 (p. 9) places this specifically in medical image segmentation, not classification. The citation supports the active-learning example, but not the claim about better classification models; self-training is attributed to a different citation. (LLM, conf=0.90)
plainstates a cause- Asserted: passes — The authors put it forward as true.
- Checkable: passes — It can be checked against evidence.
- Load-bearing: fails — The paper’s conclusions may not depend on it.
- Based: passes — The paper gives a reason why it holds.
Probably not a substantial claim. The paper’s conclusions may not depend on it.
- Supported
Every source the paper cites for this claim was checked and supports it.
In the paper
“Fournel et al. (2021) showed the superiority of a 2D regression network compared to 3D network for quality estimation.”
What the sources say
- Supportedcites Fournel et al., 2021 source
The Subject-level results (Section 4.2) report significantly lower prediction errors for the 2D reconstruction method than for the 3D direct method, regardless of backbone. Table 3 likewise states that the 2D method outperformed the equivalent 3D approach in subject-level segmentation quality estimation. (LLM, conf=0.94)
plainstates a cause- Asserted: passes — The authors put it forward as true.
- Checkable: passes — It can be checked against evidence.
- Load-bearing: fails — The paper’s conclusions may not depend on it.
- Based: passes — The paper gives a reason why it holds.
Probably not a substantial claim. The paper’s conclusions may not depend on it.
- Supported
A result the paper reports from its own data — it cites no other source for it, so there is none to check. The quote shows it is in the paper.
In the paper
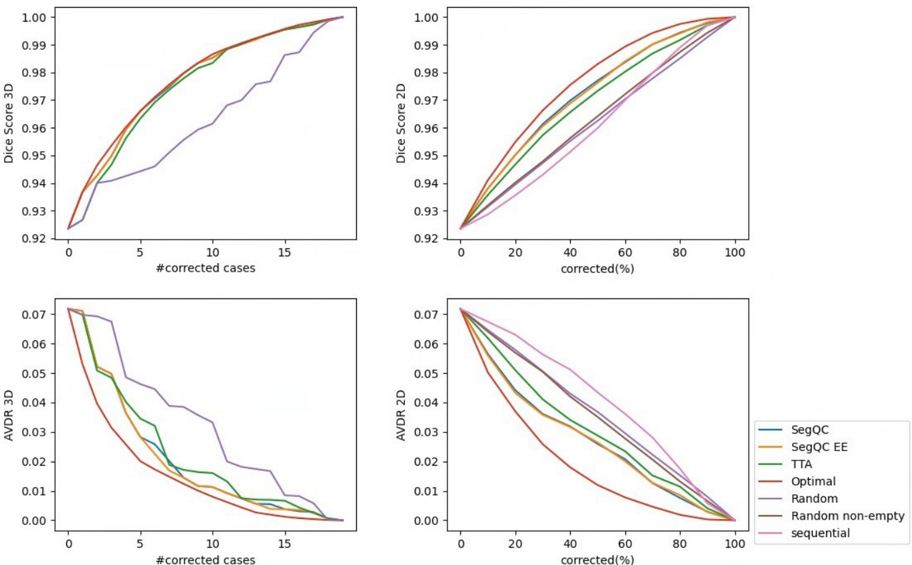
“For the fetal brain segmentation error estimation, the differences in correction performance are larger, especially for 2D, but still not very large.”
plain- Asserted: passes — The authors put it forward as true.
- Checkable: passes — It can be checked against evidence.
- Load-bearing: unclear — It is unclear whether the paper’s conclusions depend on it.
- Based: passes — The paper gives a reason why it holds.
It may state two separate claims as one.
A result the paper reports from its own data — it cites no other source for it, so there is none to check. The quote shows it is in the paper.
In the paper
“Our segmentation error detection method achieved recall and precision rates of 0.77 and 0.48 for fetal body, and 0.74 and 0.55 for fetal brain segmentation error detection respectively.”
plain- Asserted: passes — The authors put it forward as true.
- Checkable: passes — It can be checked against evidence.
- Load-bearing: passes — The paper’s conclusions depend on it.
- Based: passes — The paper gives a reason why it holds.
It may state two separate claims as one.
A result the paper reports from its own data — it cites no other source for it, so there is none to check. The quote shows it is in the paper.
In the paper
“For both fetal body and fetal brain segmentation quality estimation and for all metrics, the Pearson correlations are higher for the SegQC network compared to TTA estimation, with and without error extraction.”
plainstates an associationn = 45- Asserted: passes — The authors put it forward as true.
- Checkable: passes — It can be checked against evidence.
- Load-bearing: passes — The paper’s conclusions depend on it.
- Based: passes — The paper gives a reason why it holds.
It may state two separate claims as one.
A result the paper reports from its own data — it cites no other source for it, so there is none to check. The quote shows it is in the paper.
In the paper
“We evaluated the segmentation quality estimation method on three fetal MRI structures: 101 fetal body, 40 fetal brain and 57 placenta cases.”
plain- Asserted: passes — The authors put it forward as true.
- Checkable: passes — It can be checked against evidence.
- Load-bearing: passes — The paper’s conclusions depend on it.
- Based: passes — The paper gives a reason why it holds.
Probably not a substantial claim.
A result the paper reports from its own data — it cites no other source for it, so there is none to check. The quote shows it is in the paper.
In the paper
“While 3D overlap metrics estimations are significantly better using the SegQC networks in terms of MAE and show improved Person correlations, 3D AVDR metric and 2D metrics demonstrate mixed results.”
boostedstates an association- Asserted: passes — The authors put it forward as true.
- Checkable: passes — It can be checked against evidence.
- Load-bearing: passes — The paper’s conclusions depend on it.
- Based: passes — The paper gives a reason why it holds.
It may state two separate claims as one.
A result the paper reports from its own data — it cites no other source for it, so there is none to check. The quote shows it is in the paper.
In the paper
“Correction graphs showed slight benefit for ranking based on SegQC network compared to ranking based on TTA for 3D corrections, and similar performance for 2D corrections.”
plainstates an association- Asserted: passes — The authors put it forward as true.
- Checkable: passes — It can be checked against evidence.
- Load-bearing: unclear — It is unclear whether the paper’s conclusions depend on it.
- Based: passes — The paper gives a reason why it holds.
It may state two separate claims as one.
A result the paper reports from its own data — it cites no other source for it, so there is none to check. The quote shows it is in the paper.
In the paper
“Mask augmentations usually improve metrics estimation results for both fetal body and placenta segmentation quality estimations, with the largest difference observed for the placenta 3D overlap metrics.”
plainstates a cause- Asserted: passes — The authors put it forward as true.
- Checkable: passes — It can be checked against evidence.
- Load-bearing: unclear — It is unclear whether the paper’s conclusions depend on it.
- Based: passes — The paper gives a reason why it holds.
It may state two separate claims as one.
A result the paper states — it cites no source for it, so there is none to check. The quote shows it is in the paper.
In the paper
“Using SegQC-Net networks trained on masks using a single network compared to stratified masks usually resulted in a decline in metrics estimation performance, with larger difference in the case of fetal body segmentation quality estimation compared to placenta segmentation quality estimation.”
hedgedstates a cause- Asserted: passes — The authors put it forward as true.
- Checkable: passes — It can be checked against evidence.
- Load-bearing: passes — The paper’s conclusions depend on it.
- Based: passes — The paper gives a reason why it holds.
It may state two separate claims as one.
A result the paper reports from its own data — it cites no other source for it, so there is none to check. The quote shows it is in the paper.
In the paper
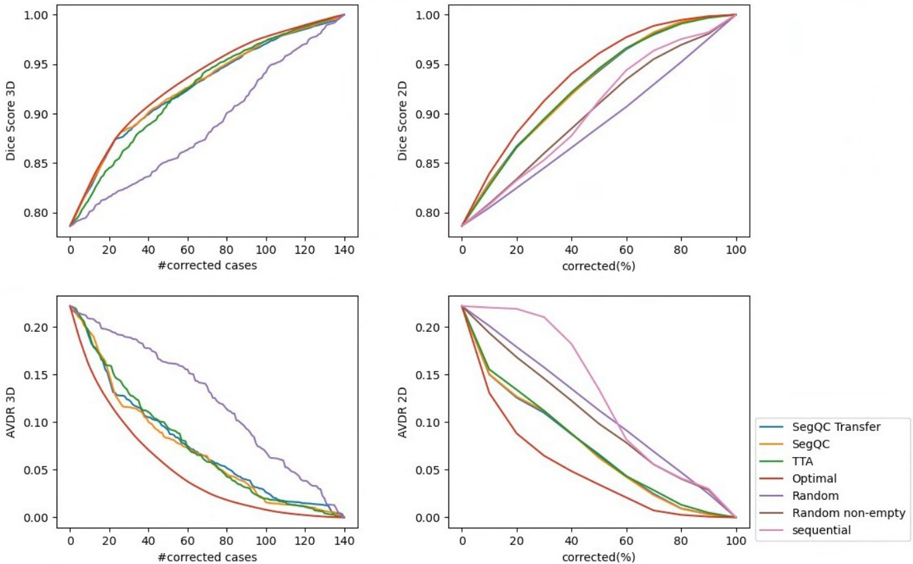
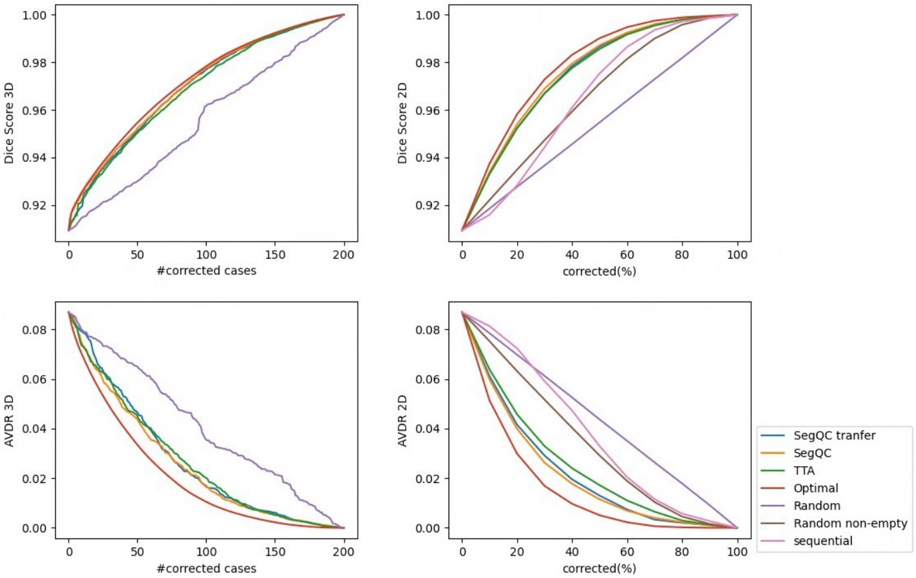
“Studies on stratified datasets demonstrate a similar phenomenon for the fetal body segmentation, where SegQC method outperforms TTA for Person correlation and MAE metrics but has only a small improvement for the correction graph evaluation.”
boostedstates a cause- Asserted: passes — The authors put it forward as true.
- Checkable: passes — It can be checked against evidence.
- Load-bearing: passes — The paper’s conclusions depend on it.
- Based: passes — The paper gives a reason why it holds.
It may state two separate claims as one.
A result the paper reports from its own data — it cites no other source for it, so there is none to check. The quote shows it is in the paper.
In the paper
“However, the difference in correction graphs performance was much smaller, with the largest difference observed for 3D fetal body corrections.”
plain- Asserted: passes — The authors put it forward as true.
- Checkable: passes — It can be checked against evidence.
- Load-bearing: unclear — It is unclear whether the paper’s conclusions depend on it.
- Based: passes — The paper gives a reason why it holds.
It may state two separate claims as one.
A conclusion the paper draws from its own results — it cites no other source for it, so there is none to check. The quote shows it is in the paper.
In the paper
“For both self-training and active learning, a QC mechanism is needed to select high-quality pseudo-labels and to identify low-quality cases for manual labeling.”
plain- Asserted: passes — The authors put it forward as true.
- Checkable: fails — It may be too vague to check against evidence.
- Load-bearing: passes — The paper’s conclusions depend on it.
- Based: passes — The paper gives a reason why it holds.
Probably not a substantial claim. It may be too vague to check against evidence. It may state two separate claims as one.
A conclusion the paper draws from its own results — it cites no other source for it, so there is none to check. The quote shows it is in the paper.
In the paper
“SegQC enhances segmentation metrics estimation for whole scans and individual slices, as well as provides error regions detection.”
plainstates a cause- Asserted: passes — The authors put it forward as true.
- Checkable: passes — It can be checked against evidence.
- Load-bearing: passes — The paper’s conclusions depend on it.
- Based: passes — The paper gives a reason why it holds.
It may state two separate claims as one.
In the paper
“However, this method required a dedicated dataset of correction data for training, and it did not perform metrics estimation, 3D scans prioritization and error detection.”
What the sources say
- Not matchedcites Specktor-Fadida et al., 2022
Couldn’t be matched to a paper in Crossref, so it can’t be checked.
plain- Asserted: passes — The authors put it forward as true.
- Checkable: passes — It can be checked against evidence.
- Load-bearing: passes — The paper’s conclusions depend on it.
- Based: passes — The paper gives a reason why it holds.
It may state two separate claims as one.
- Not matched
A conclusion the paper draws from its own results — it cites no other source for it, so there is none to check. The quote shows it is in the paper.
In the paper
“It requires a relatively small number of annotated cases for training and uses input-mask pairs generated from a single segmentation network.”
plain- Asserted: passes — The authors put it forward as true.
- Checkable: passes — It can be checked against evidence.
- Load-bearing: passes — The paper’s conclusions depend on it.
- Based: fails — The paper may give no reason why it holds.
Probably not a substantial claim. The paper may give no reason why it holds. It may state two separate claims as one.
None of the sources cited for this claim could be matched to a paper in Crossref, so there is nothing to check it against.
In the paper
“Furthermore, they do not identify all erroneous segmentations in the dataset, but only some suspicious cases.”
What the sources say
- Not matchedcites Specktor-Fadida et al., 2023a
Couldn’t be matched to a paper in Crossref, so it can’t be checked.
- Not matchedcites Audelan and Delingette, 2021
Couldn’t be matched to a paper in Crossref, so it can’t be checked.
plain- Asserted: passes — The authors put it forward as true.
- Checkable: passes — It can be checked against evidence.
- Load-bearing: passes — The paper’s conclusions depend on it.
- Based: passes — The paper gives a reason why it holds.
It may state two separate claims as one.
- Not matched
What the paper did — it cites no source for this, so there is none to check. The quote shows it is in the paper.
In the paper
“We determined whether the MAE differences between methods are significant using paired two-sided t-tests.”
plain- Asserted: passes — The authors put it forward as true.
- Checkable: passes — It can be checked against evidence.
- Load-bearing: fails — The paper’s conclusions may not depend on it.
- Based: passes — The paper gives a reason why it holds.
Probably not a substantial claim. The paper’s conclusions may not depend on it.
A conclusion the paper draws from its own results — it cites no other source for it, so there is none to check. The quote shows it is in the paper.
In the paper
“However, when the ground truth segmentation was created by manually correcting the segmentation mask M , the mask M reflects the inductive bias of the manual delineation and can help reduce the observer variability V t , thereby reflecting the segmentation error E t .”
plainstates a cause- Asserted: passes — The authors put it forward as true.
- Checkable: passes — It can be checked against evidence.
- Load-bearing: passes — The paper’s conclusions depend on it.
- Based: fails — The paper may give no reason why it holds.
Probably not a substantial claim. The paper may give no reason why it holds. It may state two separate claims as one.
None of the sources cited for this claim could be matched to a paper in Crossref, so there is nothing to check it against.
In the paper
“Unsupervised methods identify outliers in a set of segmentations, but may not be accurate in assessing individual segmentation results.”
What the sources say
- Not matchedcites Specktor-Fadida et al., 2023a
Couldn’t be matched to a paper in Crossref, so it can’t be checked.
- Not matchedcites Audelan and Delingette, 2021
Couldn’t be matched to a paper in Crossref, so it can’t be checked.
hedged- Asserted: passes — The authors put it forward as true.
- Checkable: passes — It can be checked against evidence.
- Load-bearing: passes — The paper’s conclusions depend on it.
- Based: passes — The paper gives a reason why it holds.
It may state two separate claims as one.
- Not matched
The paper states this without a source or data behind it here, so there is nothing to check it against. The quote shows it is in the paper.
In the paper
“However, to the best of our knowledge, none of the existing methods have been tested on segmentation masks correction data.”
hedged- Asserted: passes — The authors put it forward as true.
- Checkable: passes — It can be checked against evidence.
- Load-bearing: passes — The paper’s conclusions depend on it.
- Based: fails — The paper may give no reason why it holds.
Probably not a substantial claim. The paper may give no reason why it holds.
In the paper
“In our previous work (Specktor-Fadida et al., 2022), we used corrections data to prioritize slices for manual correction and tested the method on fetal body corrections test data.”
What the sources say
- Not matchedcites Specktor-Fadida et al., 2022
Couldn’t be matched to a paper in Crossref, so it can’t be checked.
plain- Asserted: passes — The authors put it forward as true.
- Checkable: passes — It can be checked against evidence.
- Load-bearing: passes — The paper’s conclusions depend on it.
- Based: passes — The paper gives a reason why it holds.
Probably not a substantial claim. It may state two separate claims as one.
- Not matched
A conclusion the paper draws from its own results — it cites no other source for it, so there is none to check. The quote shows it is in the paper.
In the paper
“In practice, only D t can be computed and not E t , as the observer variability mask V t is not available.”
plain- Asserted: passes — The authors put it forward as true.
- Checkable: passes — It can be checked against evidence.
- Load-bearing: passes — The paper’s conclusions depend on it.
- Based: passes — The paper gives a reason why it holds.
It may state two separate claims as one.
A conclusion the paper draws from its own results — it cites no other source for it, so there is none to check. The quote shows it is in the paper.
In the paper
“The segmentation error estimation algorithm uses the simple heuristic of removing a band around the difference volume D t contour.”
plain- Asserted: passes — The authors put it forward as true.
- Checkable: passes — It can be checked against evidence.
- Load-bearing: passes — The paper’s conclusions depend on it.
- Based: passes — The paper gives a reason why it holds.
Probably not a substantial claim.
- Rests on an assumption: Much of the variability Vt lies in the boundary of the structure of interest.
A conclusion the paper draws from its own results — it cites no other source for it, so there is none to check. The quote shows it is in the paper.
In the paper
“The original segmentation masks introduce an inductive bias for regions with high observer variability, helping the user to focus on the error regions and making the error regions the most likely to be corrected.”
plainstates a cause- Asserted: passes — The authors put it forward as true.
- Checkable: passes — It can be checked against evidence.
- Load-bearing: passes — The paper’s conclusions depend on it.
- Based: fails — The paper may give no reason why it holds.
Probably not a substantial claim. The paper may give no reason why it holds. It may state two separate claims as one.
A conclusion the paper draws from its own results — it cites no other source for it, so there is none to check. The quote shows it is in the paper.
In the paper
“This may be due to the high observer variability of the placenta segmentation task, which makes the learning of placenta segmentation quality estimation more challenging.”
hedgedstates a possible cause- Asserted: passes — The authors put it forward as true.
- Checkable: passes — It can be checked against evidence.
- Load-bearing: fails — The paper’s conclusions may not depend on it.
- Based: passes — The paper gives a reason why it holds.
Probably not a substantial claim. The paper’s conclusions may not depend on it.
A conclusion the paper draws from its own results — it cites no other source for it, so there is none to check. The quote shows it is in the paper.
In the paper
“However, the difference in correction performance based on quality estimation ranking is relatively small, indicating that specifically for ranking purposes, using TTA-based evaluation may be enough for the application at hand.”
hedged- Asserted: passes — The authors put it forward as true.
- Checkable: passes — It can be checked against evidence.
- Load-bearing: passes — The paper’s conclusions depend on it.
- Based: passes — The paper gives a reason why it holds.
It may state two separate claims as one.
A conclusion the paper draws from its own results — it cites no other source for it, so there is none to check. The quote shows it is in the paper.
In the paper
“This can potentially be also the case for the SegQC error segmentation network.”
hedgedstates a possible cause- Asserted: passes — The authors put it forward as true.
- Checkable: passes — It can be checked against evidence.
- Load-bearing: fails — The paper’s conclusions may not depend on it.
- Based: passes — The paper gives a reason why it holds.
Probably not a substantial claim. The paper’s conclusions may not depend on it.
A conclusion the paper draws from its own results — it cites no other source for it, so there is none to check. The quote shows it is in the paper.
In the paper
“This may be due to the volumetric nature of the SegQC segmentation network.”
hedgedstates a possible cause- Asserted: passes — The authors put it forward as true.
- Checkable: passes — It can be checked against evidence.
- Load-bearing: fails — The paper’s conclusions may not depend on it.
- Based: passes — The paper gives a reason why it holds.
Probably not a substantial claim. The paper’s conclusions may not depend on it.
A conclusion the paper draws from its own results — it cites no other source for it, so there is none to check. The quote shows it is in the paper.
In the paper
“Our approach provides quality control in 3D and 2D, as well as detection of error regions, and thus can be used for a variety of important use-cases ranging from scans segmentation quality control to indication of segmentation error regions.”
plainstates a cause- Asserted: passes — The authors put it forward as true.
- Checkable: passes — It can be checked against evidence.
- Load-bearing: passes — The paper’s conclusions depend on it.
- Based: passes — The paper gives a reason why it holds.
It may state two separate claims as one.
- Rests on an assumption: Quality control of structure segmentation in volumetric medical images is important for detecting errors in clinical practice and improving model performance in semi-supervised and active learning.
The paper relies on this without support.
Observer variability occurs in the boundaries of the structure of interest.
“since the observer variability occurs in the boundaries of the structure of interest, it can be estimated using an offset band around the segmentation mask contour.”
The paper relies on this without support.
Existing supervised methods for segmentation QC compute a single metric for the estimation, e.g., the Dice score.
“Existing supervised methods for segmentation QC compute a single metric for the estimation, e.g., the Dice score.”
The paper relies on this without support.
It is very difficult to obtain many cases with segmentation corrections data.
“However, it is very difficult to obtain many cases with segmentation corrections data.”
The paper relies on this without support.
Corrections datasets are obtained with high quality segmentations.
“although corrections datasets are obtained with high quality segmentations, for otherwise the manual delineations would have been performed from scratch.”
The paper relies on this without support.
Much of the variability Vt lies in the boundary of the structure of interest.
“The idea behind it is that much of the variability V t lies in the boundary of the structure of interest, thus to estimate the segmentation error boundary can be removed.”
The paper relies on this without support.
Quality control of structure segmentation in volumetric medical images is important for detecting errors in clinical practice and improving model performance in semi-supervised and active learning.
“Quality control of structures segmentation in volumetric medical images is key for detecting errors in clinical practice and improving model performance in semi-supervised and active learning.”
The paper relies on this without support.
Other methods focus on a single quality estimation metric.
“Unlike other methods that focus on a single quality estimation metric, our approach computes multiple metrics”
Self-check
Percentages, sums and reported differences re-computed from the paper’s own numbers.
Each contradiction between two passages listed here was confirmed by an independent check.
Rated major: it would touch a result — a value a result rests on, reported and recomputed p-values on opposite sides of the significance level, two passages that conflict with no sign which is right, or a cited work retracted before this paper was published.
In the paper
§ 4.1. Datasets · p. 12
“Data was split to 25/26/50 training/validation/test.”
§ 4.4.1. Studies on corrections datasets · p. 14
“The fetal body test set consisted of 45 cases; the fetal brain consisted of 19 cases.”
Rated minor: it would not touch a result — a value no result rests on, a p-value that stays on the same side of the significance level, or a conflict that is clerical, resolved elsewhere in the paper, or outside its own findings.
In the paper
§ 5. Discussion · p. 24
“For the task of fetal brain segmentation error detection, our method boosted detection performance from a recall of 0.62 to 0.74 and from a precision of 0.52 to precision of 0.55.”
§ 4.4.1. Studies on corrections datasets · p. 18
“| Recall | 0.05 | 0.55 | 0.77 | 0.63 | 0.74 |”
Rated minor: it would not touch a result — a value no result rests on, a p-value that stays on the same side of the significance level, or a conflict that is clerical, resolved elsewhere in the paper, or outside its own findings.
In the paper
§ 4.4.2. Studies on stratified datasets · p. 18
“Tables 5 and 7 list the metrics estimation MAE and Pearson correlation respectively”
§ 4.4.2. Studies on stratified datasets · p. 19
“Tables 1 and 4 list the metrics estimation MAE and Pearson correlation respectively.”
Citations
No citation lists for this paper
No DOI on record — the citation lists can’t be looked up.
References 35 · Cited by 9
Research works printed but not linked: 1
- [24]24. Specktor-Fadida, B., Sourani, D.L., Sira, L.B., Bashat, D.B., Joskowicz, L., 2022. Slices prioritization for segmentation correction in fetal body MRI scans based on previous corrections data. Proc. Conf. Computer Assisted Radiology and Surgery (CARS'22), S24-S25.
Metadata
- Authors
- Specktor-Fadida, B., Ben-Sira, L., Ben-Bashat, D., & Joskowicz, L.
- Venue
- arXiv
- Publisher
- arXiv
- Published
- 2024
- Volume
- 103
- Pages
- 103638-103638
- ISSN
- 1361-8415 (ISSN-L)
- arXiv
- 2411.07601
- OpenAlex
- W4410195256
- Semantic Scholar
- ae9074dc822684cc7509467310b622816591292b
- Cited by
- 9
- References
- 35
- Citations by year
- 2026: 6 · 2025: 3
- FWCI
- 3.22
- Type
- journal article
- Language
- en
- Open access
- hybrid
- doi.org
- Licence
- Locations
- Medical Image Analysis (publishedVersion, cc-by)
- PubMed (publishedVersion)
- arXiv (Cornell University) (submittedVersion, cc-by-sa)
- arXiv (Cornell University)
- Funders
- Israel Innovation Authority (63418, 72126)
- Topics
- Physical Sciences › Computer Science › Computer Vision and Pattern Recognition › Medical Image Segmentation Techniques
- Physical Sciences › Engineering › Biomedical Engineering › Medical Imaging and Analysis
- Health Sciences › Medicine › Health Informatics › Artificial Intelligence in Healthcare and Education
- Keywords
- volumetric medical images, segmentation quality metrics, fetal MRI, fetal brain segmentation, placenta segmentation, test-time augmentation, observer variability, error localization
- MeSH terms
- Deep Learning, Algorithms, Brain, Female, Humans, Image Interpretation, Computer-Assisted, Magnetic Resonance Imaging, Placenta, Pregnancy, Prenatal Diagnosis, Quality Control, Neural Networks, Computer, Imaging, Three-Dimensional
About these checks
Registry, retraction, Cites and statistics results are computed, not judged, with one exception: a printed reference that no index lists is read once by a model before it counts as a citation error. Claims are extracted by a model and kept only when their quote appears verbatim in the text; each cited source is then checked, with a model’s help, for whether it says what the claim relies on. Those verdicts can be wrong — read the claim’s quote and the cited source before relying on one.
A language model drew the claims from the paper on 2026-10-21, under version 3 of the claim definition (model deepseek-v4.1-flash, prompt extract-v3).
A second model labelled each claim on 2026-10-21 (model jev-1.13-20260917, definition revision gold-guideline-v0.2).
Cited sources are checked with a language model’s help (gpt-6-sol).
Statistics and arithmetic are recomputed, not judged.
Confidence bands are shown only for fields calibrated on our annotated test set. None is calibrated yet, so no band is shown.
What counts as a claim ›How we measure confidence ›How we check this ›
Are you an author, or do you see a problem with this page? Request a review
