

The DOI matches its DataCite record; 89 of the 89 references it cites were found in a registry or an index; 14 of the 54 sources its claims cite were checked for support.
The Leaderboard Illusion
Open accessAbstract
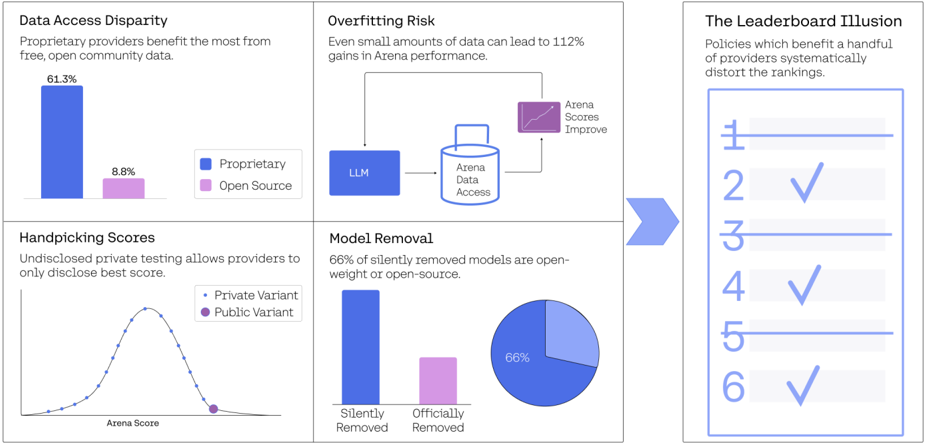
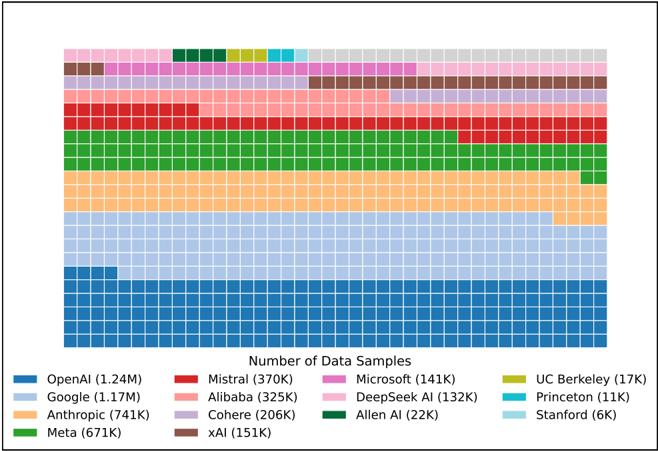
Measuring progress is fundamental to the advancement of any scientific field. As benchmarks play an increasingly central role, they also grow more susceptible to distortion. Chatbot Arena has emerged as the go-to leaderboard for ranking the most capable AI systems. Yet, in this work we identify systematic issues that have resulted in a distorted playing field. We find that undisclosed private testing practices benefit a handful of providers who are able to test multiple variants before public release and retract scores if desired. We establish that the ability of these providers to choose the best score leads to biased Arena scores due to selective disclosure of performance results. At an extreme, we identify 27 private LLM variants tested by Meta in the lead-up to the Llama-4 release. We also establish that proprietary closed models are sampled at higher rates (number of battles) and have fewer models removed from the arena than open-weight and open-source alternatives. Both these policies lead to large data access asymmetries over time. Providers like Google and OpenAI have received an estimated 19.2% and 20.4% of all data on the arena, respectively. In contrast, a combined 83 open-weight models have only received an estimated 29.7% of the total data. We show that access to Chatbot Arena data yields substantial benefits; even limited additional data can result in relative performance gains of up to 112% on the arena distribution, based on our conservative estimates. Together, these dynamics result in overfitting to Arena-specific dynamics rather than general model quality. The Arena builds on the substantial efforts of both the organizers and an open community that maintains this valuable evaluation platform. We offer actionable recommendations to reform the Chatbot Arena's evaluation framework and promote fairer, more transparent benchmarking for the field
Overview
AI snapshot
Written from the paper’s full text.
TL;DR
This paper audits Chatbot Arena and argues that undisclosed private testing, selective score retraction, unequal sampling, and silent model deprecation distort leaderboard rankings and data access. It finds these practices disproportionately benefit a few proprietary providers and can enable overfitting to Arena-specific dynamics rather than general model quality.
Key findings
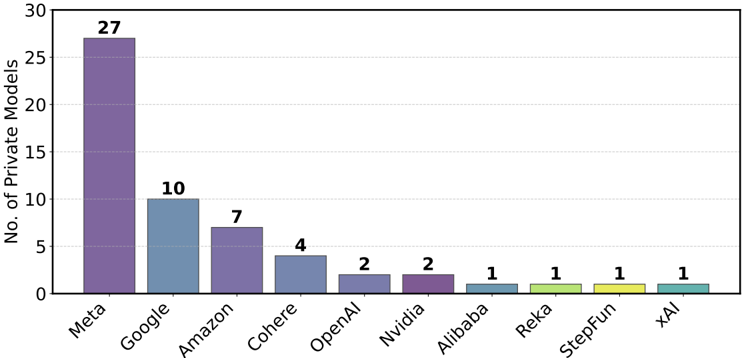
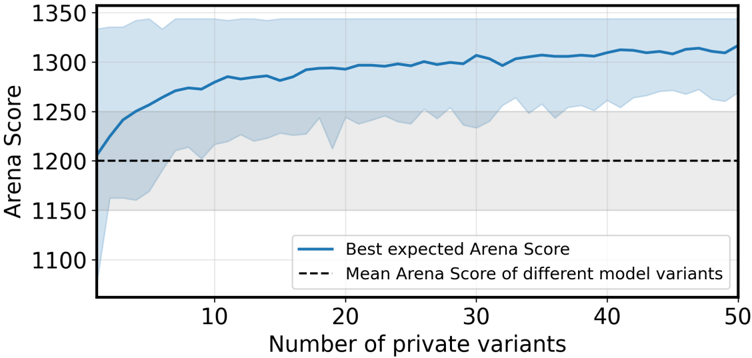
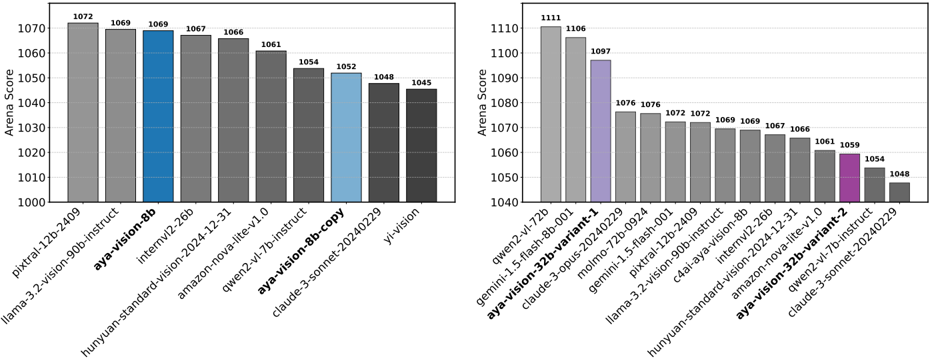
- Private testing and selective disclosure are widespread among preferred providers: Meta tested 27 private variants on the main Arena (43 including vision) before Llama-4, Google 10, Amazon 7, OpenAI 3, and Cohere 6. Simulating best-of-N selection, testing just 10 variants yields roughly a 100-point increase in maximum Arena score; real experiments with identical Aya-Vision-8B checkpoints produced different scores (1069 vs. 1052), and two Aya-Vision-32B variants scored 1097 vs. 1059.
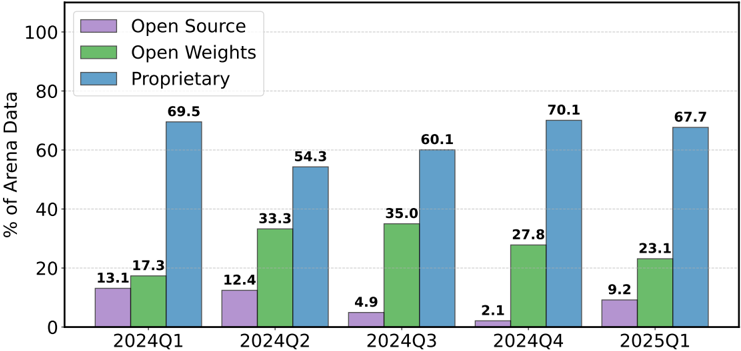
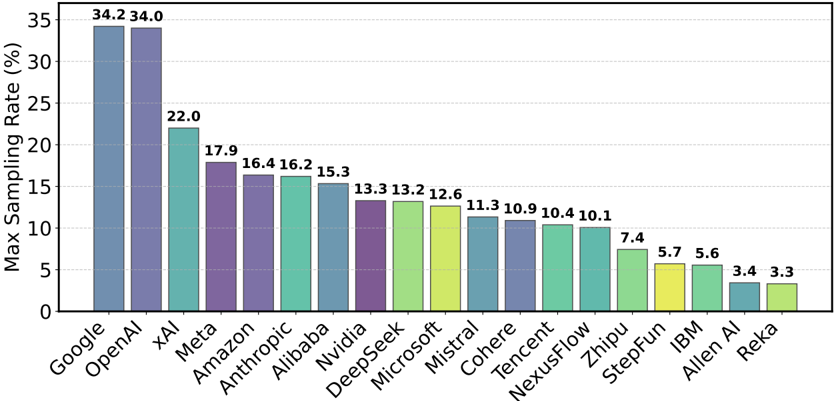
- Data access is highly asymmetric: Google and OpenAI received an estimated 19.2% and 20.4% of all Arena data, respectively; OpenAI, Google, Meta, and Anthropic collectively account for 62.8%, 68 times more than top academic/non-profit labs. A combined 83 open-weight models received an estimated 29.7% of total data, while 41 fully open-source models received 8.8%. Maximum daily sampling rates reached 34% for Google/OpenAI, versus 3.3% for Reka.
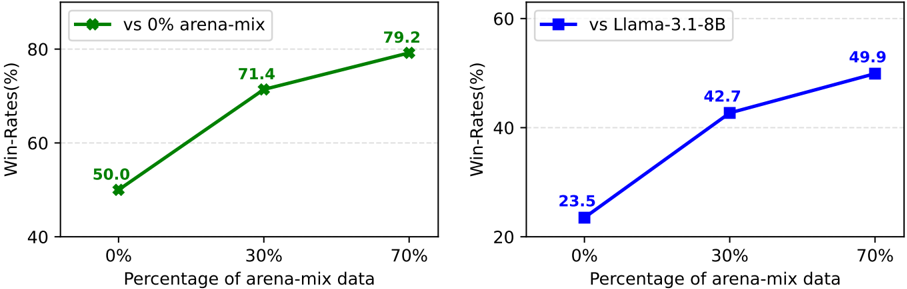
- Arena data access drives large in-distribution gains but not broad generalization: increasing Arena data in a fine-tuning mixture from 0% to 70% raised win-rate on ArenaHard from 23.5% to 49.9% against Llama-3.1-8B-Instruct, a 112.3% relative gain, while MMLU accuracy slightly declined from 66.5% to 64.4% and 65.9%.
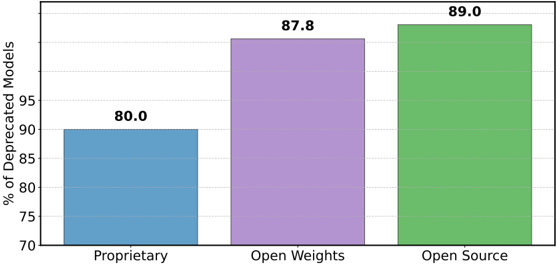
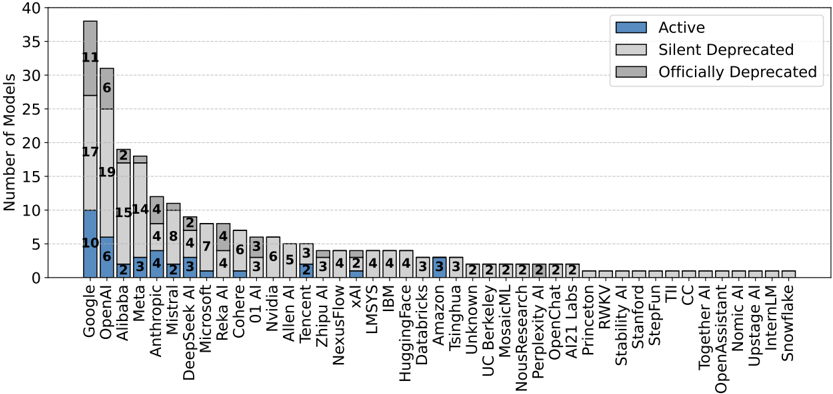
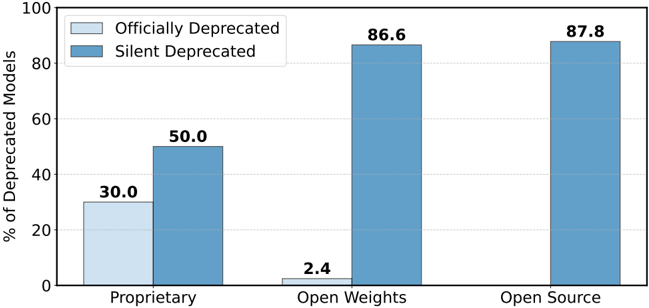
- Deprecation is opaque and uneven: of 243 public models, 205 were silently deprecated, versus 47 officially listed. Among silently deprecated models, 66% are open-weight or fully open-source; 86.6% of open-weight and 87.8% of open-source models were silently deprecated, compared with 30% of officially deprecated models being proprietary.
Methods
- The authors combine multiple data sources covering 2M battles, 243 models, and 42 providers from January 2024 to April 2025, including historical battles, API prompts, leaderboard statistics, a scraped random sample of 5,864 battles from January–March 2025, and about 500 vision-leaderboard samples.
- They run simulations of Bradley-Terry ranking under best-of-N private testing, changing task distributions with deprecation, and sparse/disconnected comparison graphs, plus real-world private variant submissions of Aya-Vision models to Chatbot Arena.
- They fine-tune a 7B Cohere Command-family base model with 0%, 30%, and 70% Arena data in the training mixture for 1.3K steps at batch size 128, evaluating on 500 English ArenaHard prompts with GPT-4o as judge and on MMLU.
Limitations
- The paper states it lacks access to Chatbot Arena’s raw data, that private battles are removed from released datasets, and that it cannot investigate adversarial voting; its scraped snapshot covers only January–March 2025 and may underestimate private variant counts for providers with fewer launches in that period.
- The authors state their training experiments likely underestimate overfitting because proprietary providers may use 5–10 times more data, and that private model attribution relies on model self-identification, which is approximate and may cause misattributions.
- Evident from the text: several analyses rely on proprietary API data, simulations, or scraped samples rather than full Arena data, and the recommendations are based on observed policies and practices during a limited audit window.
Model-written summary. Check it against the paper before relying on it.
Integrity signals
Registry
Cites
Statistics
Figures
Verification
Claims the paper makes
103 Own interpretation · 102 Own result · 46 No basis given · 22 Sources not found · 8 Partly supported · 6 Not checked yet · 5 Own method · 4 No full text of the sources · 1 Supported · 1 Supported so far · 1 Check pending · accuracy not yet measured
The cited sources support only part of this claim — read each source’s verdict below.
In the paper
“However, in principle, the BT model should still handle this reliably because of the transitivity property (Boubdir et al., 2024).”
§ The Leaderboard Illusion > 5 Results: Impact of Model Deprecation on Arena Scores
What the sources say
- Partly supportedcites Boubdir et al., 2024 sourceExperimental — accuracy not yet measured
Section 3.1 describes transitivity as a desirable property that can allow model comparisons without direct head-to-head evaluations. But the paper discusses Elo rather than the BT model, does not address deprecation, and reports circumstances in which Elo rankings violate transitivity. It therefore does not establish that BT would handle deprecation reliably. (LLM, conf=0.84)
plaindirect- Asserted: passes — The authors put it forward as true.
- Checkable: passes — It can be checked against evidence.
- Load-bearing: passes — The paper’s conclusions depend on it.
- Based: passes — The paper gives a reason why it holds.
- Partly supported
The cited sources support only part of this claim — read each source’s verdict below.
In the paper
“Overfitting is a particularly salient challenge in static evaluation settings, where fixed test sets are vulnerable to overfitting through repeated exposure, data contamination, or intentional tuning (Deng et al., 2024;Golchin & Surdeanu, 2024;Roberts et al., 2023;Dong et al., 2024;Singh et al., 2024a).”
§ The Leaderboard Illusion > 4.2 Risk of Potential Overfitting
What the sources say
- Partly supportedcites Deng et al., 2024 sourceExperimental — accuracy not yet measured
The Introduction says benchmark data in training sets can inflate performance metrics, and §4.3 reports that deliberately fine-tuning on the MMLU test set produced a nearly 100% exact-match rate. This supports the risk from data contamination and intentional tuning, but the paper does not establish repeated exposure as a separate route to overfitting or explicitly compare static with other evaluation settings. Page numbers were not available in our copy. (LLM, conf=0.84)
- Not matchedcites Golchin & Surdeanu, 2024
Couldn’t be matched to a paper in Crossref, so it can’t be checked.
- Not matchedcites Roberts et al., 2023
Couldn’t be matched to a paper in Crossref, so it can’t be checked.
plaindirect- Asserted: passes — The authors put it forward as true.
- Checkable: passes — It can be checked against evidence.
- Load-bearing: passes — The paper’s conclusions depend on it.
- Based: passes — The paper gives a reason why it holds.
- Partly supported
The sources with a verdict support this claim; the rest weren’t checked yet, have no full text we could read, or their verdicts aren’t rated yet.
In the paper
“Various works have shown that this is correlated with human preferences (Dubois et al., 2023;Rafailov et al., 2023;Kim et al., 2023).”
§ The Leaderboard Illusion > 4.2 Risk of Potential Overfitting
What the sources say
- Supportedcites Dubois et al., 2023 source
Section 4.3, “Validating the pairwise preferences component,” reports that the LLM-based evaluator agreed with the majority vote of three human annotators 65% of the time, close to the 66% agreement of a held-out human annotator. This supports the claim that an LM-based judge's preferences align with human preferences, though the paper reports agreement rather than a correlation coefficient. (LLM, conf=0.92)
- Not checked — no full text of the sourcecites Rafailov et al., 2023 source
- Not matchedcites Kim et al., 2023
Couldn’t be matched to a paper in Crossref, so it can’t be checked.
plaincorrelational- Asserted: passes — The authors put it forward as true.
- Checkable: passes — It can be checked against evidence.
- Load-bearing: passes — The paper’s conclusions depend on it.
- Based: passes — The paper gives a reason why it holds.
- Supported
The cited sources support only part of this claim — read each source’s verdict below.
In the paper
“Research has found that benchmarks are rarely impartial and instead shaped by the environments in which the benchmarks are made”
§ The Leaderboard Illusion > 8.1 Meta-studies on the Rigor of Benchmarking in AI
What the sources say
- Partly supportedcites Aniba et al., 2010 sourceExperimental — accuracy not yet measured
The Conclusions and Perspectives section says benchmark design reflects a field’s scientific paradigm and that choices about what to include are statements of values. This supports the claim that benchmarks are shaped by their context, but the paper does not establish that benchmarks are rarely impartial. (LLM, conf=0.85)
- Partly supportedcites Bartz-Beielstein et al., 2020 sourceExperimental — accuracy not yet measured
Section 4 (‘Algorithms’; page unavailable) calls the choice of algorithms ‘one of the most subjective choices’ in a benchmarking study, and Section 3 (‘Problem Instances’; page unavailable) says the choice of problem instances can heavily influence results. These passages support the point that benchmark design shapes outcomes, but they do not establish that benchmarks are rarely impartial or that they are shaped specifically by the environments in which they are made. (LLM, conf=0.84)
plaindirect- Asserted: passes — The authors put it forward as true.
- Checkable: passes — It can be checked against evidence.
- Load-bearing: passes — The paper’s conclusions depend on it.
- Based: passes — The paper gives a reason why it holds.
- Partly supported
The cited sources support only part of this claim — read each source’s verdict below.
In the paper
“Static task-based leaderboards, such as Hugging Face's Open LLM Leaderboard (Fourrier et al., 2024;Gao et al., 2024) and OpenCompass (Contributors, 2023), aim to evaluate models across a broad range of skills but are often susceptible to data contamination and implicit overfitting”
§ The Leaderboard Illusion > 8.1 Meta-studies on the Rigor of Benchmarking in AI
What the sources say
- Partly supportedcites Deng et al., 2024 sourceExperimental — accuracy not yet measured
The Introduction says benchmark data can enter training sets and artificially inflate performance metrics, and the Contaminated Data section reports evidence of potential contamination in widely used benchmarks. The Limitations section only suggests possible overfitting in multi-choice tasks; it does not establish that static task-based leaderboards generally suffer from implicit overfitting. Page numbers are unavailable in our copy. (LLM, conf=0.84)
- Not matchedcites Golchin & Surdeanu, 2024
Couldn’t be matched to a paper in Crossref, so it can’t be checked.
- Not matchedcites Roberts et al., 2023
Couldn’t be matched to a paper in Crossref, so it can’t be checked.
plaincorrelational- Asserted: passes — The authors put it forward as true.
- Checkable: passes — It can be checked against evidence.
- Load-bearing: passes — The paper’s conclusions depend on it.
- Based: passes — The paper gives a reason why it holds.
- Partly supported
A check of a cited source is scheduled, or we don’t hold its full text yet; the claim is checked once it runs.
In the paper
“Human voting has been shown to mitigate some of the biases associated with using LLM-as-a-judge approaches”
§ The Leaderboard Illusion > 8.2 Human Voting-based Benchmarks
What the sources say
- Not matchedcites Raina et al., 2024
Couldn’t be matched to a paper in Crossref, so it can’t be checked.
- Not checked yetcites Koo et al., 2023 source
A check is scheduled.
- Could not verifycites Shimabucoro et al., 2023 sourceExperimental — accuracy not yet measured
The Introduction and §§3.2–4.2 discuss biases in few-shot-learning performance estimators, not biases in LLM-as-a-judge approaches. Searches for human voting and human annotators judging language models found no passage addressing whether voting mitigates those biases. The indexed passages provide no page numbers. (LLM, conf=0.76)
plaindirect- Asserted: passes — The authors put it forward as true.
- Checkable: passes — It can be checked against evidence.
- Load-bearing: unclear — It is unclear whether the paper’s conclusions depend on it.
- Based: passes — The paper gives a reason why it holds.
- Not matched
A result the paper reports from its own data — it cites no other source for it, so there is none to check. The quote shows it is in the paper.
In the paper
“As a result, 4 models are positioned between our two identical checkpoints.”
§ The Leaderboard Illusion > 3.3 Real-world Chatbot Arena Experiment
plainSingle case- Asserted: passes — The authors put it forward as true.
- Checkable: passes — It can be checked against evidence.
- Load-bearing: passes — The paper’s conclusions depend on it.
- Based: passes — The paper gives a reason why it holds.
The paper states this without a source or data behind it here, so there is nothing to check it against. The quote shows it is in the paper.
In the paper
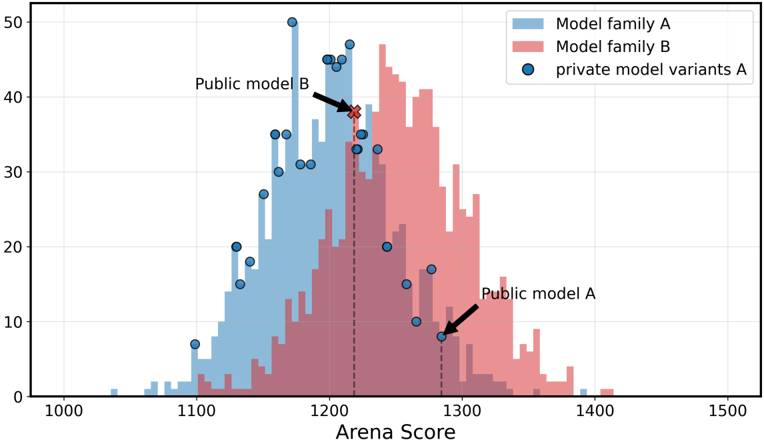
“Although the performance of both model families is in a similar range, Family A's models have a lower average Arena score across all models compared to Family B's.”
§ The Leaderboard Illusion > Unbiased Sampling Assumption.
plaincorrelational- Asserted: passes — The authors put it forward as true.
- Checkable: passes — It can be checked against evidence.
- Load-bearing: passes — The paper’s conclusions depend on it.
- Based: passes — The paper gives a reason why it holds.
A result the paper reports from its own data — it cites no other source for it, so there is none to check. The quote shows it is in the paper.
In the paper
“However, proprietary model providers collect significantly more test prompts and model battle outcomes than others.”
§ The Leaderboard Illusion > -Charles A. E. Goodhart
plaincorrelational- Asserted: passes — The authors put it forward as true.
- Checkable: passes — It can be checked against evidence.
- Load-bearing: passes — The paper’s conclusions depend on it.
- Based: passes — The paper gives a reason why it holds.
A result the paper reports from its own data — it cites no other source for it, so there is none to check. The quote shows it is in the paper.
In the paper
“Notably, we found that no private models were tested by academic labs during the observed period.”
§ The Leaderboard Illusion > 3.1 Preferred Providers Frequently Use Private Testing
plain- Asserted: passes — The authors put it forward as true.
- Checkable: passes — It can be checked against evidence.
- Load-bearing: passes — The paper’s conclusions depend on it.
- Based: passes — The paper gives a reason why it holds.
- It may state two separate claims as one. 89
- Probably not a substantial claim. 49
- The quote only partly states this claim. 2
The cited sources support only part of this claim — read each source’s verdict below.
In the paper
“For example, providers may use the composition of the data to make decisions about weighting different data sources (Üstün et al., 2024), or may use a small subset of the data to create high-quality synthetic data that is close to the original distribution (Odumakinde et al., 2024;Shimabucoro et al., 2024;Dang et al., 2024a;Aakanksha et al., 2024).”
§ The Leaderboard Illusion > 4.2 Risk of Potential Overfitting
What the sources say
- Not matchedcites Üstün et al., 2024
Couldn’t be matched to a paper in Crossref, so it can’t be checked.
- Not matchedcites Odumakinde et al., 2024
Couldn’t be matched to a paper in Crossref, so it can’t be checked.
- Partly supportedcites Shimabucoro et al., 2024 sourceExperimental — accuracy not yet measured
Section 4.1 describes generating synthetic responses from prompts in an existing dataset, and the Introduction describes curating those generations for desirable attributes. The paper does not establish that a small subset of the original data suffices or that the resulting synthetic data stays close to the original distribution; its aim is to steer selected attributes. (LLM, conf=0.84)
hedgedconditional- Asserted: passes — The authors put it forward as true.
- Checkable: passes — It can be checked against evidence.
- Load-bearing: passes — The paper’s conclusions depend on it.
- Based: passes — The paper gives a reason why it holds.
It may state two separate claims as one.
- Not matched
Every source the paper cites for this claim was checked and supports it.
In the paper
“Various previous works have shown that adversarial voting is a critical concern for the reliability of any crowd-sourced evaluation platform like Chatbot Arena (Huang et al., 2025) (Min et al., 2025).”
§ The Leaderboard Illusion > 7 Limitations
What the sources say
- Supportedcites Huang et al., 2025 source
The figure caption states that adversarial voting can distort Chatbot Arena’s crowdsourced leaderboard rankings. The Discussion says the findings are relevant to other public platforms for comparative AI evaluation, supporting the broader concern about reliability. (LLM, conf=0.90)
- Supportedcites Min et al., 2025 source
The Impact Statement says malicious vote rigging could undermine Chatbot Arena’s reliability and trustworthiness and calls for stronger safeguards in other voting-based evaluation systems. The Introduction likewise says crowdsourced votes can be maliciously rigged to manipulate model rankings. (LLM, conf=0.91)
boosteddirect- Asserted: passes — The authors put it forward as true.
- Checkable: passes — It can be checked against evidence.
- Load-bearing: fails — The paper’s conclusions may not depend on it.
- Based: passes — The paper gives a reason why it holds.
Probably not a substantial claim. The paper’s conclusions may not depend on it.
- Supported
The cited sources support only part of this claim — read each source’s verdict below.
In the paper
“poor data quality and limited reproducibility can lead to unreliable evaluations and undermine scientific credibility.”
§ The Leaderboard Illusion > Quality of data and limited reproducibility.
What the sources say
- Partly supportedcites Bartz-Beielstein et al., 2020 sourceExperimental — accuracy not yet measured
Section 9 (Additional information; page not provided) treats reproducibility as important to obtaining measurements that lead to the same conclusions. The Results/Visualization passage warns of spurious results, supporting the concern about unreliable evaluations. The copy does not specifically link poor data quality to those evaluations or state that these problems undermine scientific credibility. (LLM, conf=0.83)
- Not matchedcites Longpre et al., 2023
Couldn’t be matched to a paper in Crossref, so it can’t be checked.
- Supportedcites Reuel et al., 2024 source
The Discussion (page unavailable) says benchmark quality limitations can produce incorrect conclusions and misleading evaluations, while insufficient implementation hinders reproducibility and scrutiny. The section on scripts to replicate results (page unavailable) says reproducibility fosters trust in benchmarks. Together, these support the claim in the context of AI benchmarking. (LLM, conf=0.86)
plaindirect- Asserted: passes — The authors put it forward as true.
- Checkable: passes — It can be checked against evidence.
- Load-bearing: passes — The paper’s conclusions depend on it.
- Based: passes — The paper gives a reason why it holds.
It may state two separate claims as one.
- Partly supported
The cited sources support only part of this claim — read each source’s verdict below.
In the paper
“studies have demonstrated that such leaderboards are vulnerable to low-cost manipulation, with adversarial users able to de-anonymize model responses and carry out targeted voting attacks (Huang et al., 2025).”
§ The Leaderboard Illusion > 8.2 Human Voting-based Benchmarks
What the sources say
- Partly supportedcites Huang et al., 2025 sourceExperimental — accuracy not yet measured
The Introduction says users can de-anonymize responses and target votes to manipulate rankings. The Abstract estimates that roughly a thousand votes could alter a leaderboard, but qualifies this as a potential vulnerability without bot protection and says the result was verified in an offline simulation. The paper does not establish that an existing live leaderboard was manipulated at low cost. (LLM, conf=0.86)
boosteddirect- Asserted: passes — The authors put it forward as true.
- Checkable: passes — It can be checked against evidence.
- Load-bearing: unclear — It is unclear whether the paper’s conclusions depend on it.
- Based: passes — The paper gives a reason why it holds.
It may state two separate claims as one.
- Partly supported
The cited sources support only part of this claim — read each source’s verdict below.
In the paper
“Zhao et al. (2024); Min et al. (2025) suggest that Chatbot Arena rankings can be artificially inflated through various adversarial voting strategies.”
§ The Leaderboard Illusion > 8.2 Human Voting-based Benchmarks
What the sources say
- Not matchedcites Zhao et al., 2024
Couldn’t be matched to a paper in Crossref, so it can’t be checked.
- Supportedcites Min et al., 2025 source
The Introduction says maliciously rigged votes can improve a target model’s ranking and describes both target-only and omnipresent strategies. It also reports experimental ranking improvements from manipulating hundreds of new votes in a reproducible environment built from historical Chatbot Arena votes, rather than on the live platform. (LLM, conf=0.94)
hedgeddirect- Asserted: passes — The authors put it forward as true.
- Checkable: passes — It can be checked against evidence.
- Load-bearing: fails — The paper’s conclusions may not depend on it.
- Based: passes — The paper gives a reason why it holds.
Probably not a substantial claim. The paper’s conclusions may not depend on it.
- Not matched
A result the paper reports from its own data — it cites no other source for it, so there is none to check. The quote shows it is in the paper.
In the paper
“For example, in Figure 4, we show that the combined share of OpenAI, Google, Meta, and Anthropic alone is 62.8% of the arena data,”
- Also stated in: § 4.1 Disparity in access to Chatbot Arena Data · plain
“which is 68 times more than the share of top academic and non-profit labs including Allen AI, Stanford, Princeton, and UC Berkeley.”
§ The Leaderboard Illusion > 4.1 Disparity in access to Chatbot Arena Data
plaincorrelational- Asserted: passes — The authors put it forward as true.
- Checkable: passes — It can be checked against evidence.
- Load-bearing: passes — The paper’s conclusions depend on it.
- Based: passes — The paper gives a reason why it holds.
It may state two separate claims as one.
- Also stated in: § 4.1 Disparity in access to Chatbot Arena Data · plain
A result the paper reports from its own data — it cites no other source for it, so there is none to check. The quote shows it is in the paper.
In the paper
“For example, in Figure 5, we observe a maximum daily sampling rate of models from OpenAI or Google of up to 34%, which is 10 times more than what is observed as the maximum sampling from providers like Allen AI.”
§ The Leaderboard Illusion > 2. Establish transparent limits on the number of private models per provider.
plaincorrelational- Asserted: passes — The authors put it forward as true.
- Checkable: passes — It can be checked against evidence.
- Load-bearing: passes — The paper’s conclusions depend on it.
- Based: passes — The paper gives a reason why it holds.
It may state two separate claims as one.
In the paper
“We show that incorporating a moderate amount of arena data greatly improves performance on ArenaHard (Li et al., 2024b) with estimated gains of 112%, while showing limited benefits for other tasks of interest.”
§ The Leaderboard Illusion > 4 Results: Impact of Data Access Asymmetries on Arena Scores
What the sources say
- Not matchedcites Li et al., 2024b
Couldn’t be matched to a paper in Crossref, so it can’t be checked.
hedgeddirect- Asserted: passes — The authors put it forward as true.
- Checkable: passes — It can be checked against evidence.
- Load-bearing: passes — The paper’s conclusions depend on it.
- Based: passes — The paper gives a reason why it holds.
It may state two separate claims as one.
- Not matched
The paper states this without a source or data behind it here, so there is nothing to check it against. The quote shows it is in the paper.
In the paper
“Arena Scores for Aya-Vision-8B yield different Arena scores (1069 vs. 1052).”
§ The Leaderboard Illusion > Arena Scores for Aya-Vision-8B yield different Arena scores (1069 vs. 1052).
plain- Asserted: passes — The authors put it forward as true.
- Checkable: passes — It can be checked against evidence.
- Load-bearing: fails — The paper’s conclusions may not depend on it.
- Based: fails — The paper may give no reason why it holds.
Probably not a substantial claim. The paper’s conclusions may not depend on it. The paper may give no reason why it holds. The quote only partly states this claim.
The paper states this without a source or data behind it here, so there is nothing to check it against. The quote shows it is in the paper.
In the paper
“we find that sampling rate and silent deprecation do not reflect the publicly stated policy of Chatbot Arena”
§ The Leaderboard Illusion > 4 Results: Impact of Data Access Asymmetries on Arena Scores
plain- Asserted: passes — The authors put it forward as true.
- Checkable: passes — It can be checked against evidence.
- Load-bearing: passes — The paper’s conclusions depend on it.
- Based: unclear — It is unclear why the paper says it holds.
It may state two separate claims as one.
None of the sources cited for this claim have been checked yet.
In the paper
“In contrast, providers whose models are hosted by a third party are often limited to publicly accessible data or must request access to only 20% of the data (including prompts and human preferences) involving their models from Chatbot Arena, as per their policy 6 .”
§ The Leaderboard Illusion > 4.1 Disparity in access to Chatbot Arena Data
hedgeddirect- Asserted: passes — The authors put it forward as true.
- Checkable: passes — It can be checked against evidence.
- Load-bearing: passes — The paper’s conclusions depend on it.
- Based: passes — The paper gives a reason why it holds.
It may state two separate claims as one.
A result the paper reports from its own data — it cites no other source for it, so there is none to check. The quote shows it is in the paper.
In the paper
“We identify 205 models that have been silently deprecated, a number that substantially exceeds the 47 models officially marked as deprecated by Chatbot Arena.”
§ The Leaderboard Illusion > 4.1 Disparity in access to Chatbot Arena Data
plain- Asserted: passes — The authors put it forward as true.
- Checkable: passes — It can be checked against evidence.
- Load-bearing: passes — The paper’s conclusions depend on it.
- Based: passes — The paper gives a reason why it holds.
It may state two separate claims as one.
A result the paper reports from its own data — it cites no other source for it, so there is none to check. The quote shows it is in the paper.
In the paper
“Based on findings from Figure 6, the number of variants submitted is not uniform across all providers, and some providers may increase variants to further amplify the volume of data collected.”
§ The Leaderboard Illusion > 4.1 Disparity in access to Chatbot Arena Data
hedgedconditional- Asserted: passes — The authors put it forward as true.
- Checkable: passes — It can be checked against evidence.
- Load-bearing: passes — The paper’s conclusions depend on it.
- Based: passes — The paper gives a reason why it holds.
It may state two separate claims as one.
The paper states this without a source or data behind it here, so there is nothing to check it against. The quote shows it is in the paper.
In the paper
“We believe that our initial inquiries partly prompted Chatbot Arena to release a public blog in December 2024 detailing their benchmarking policyfoot_5 , which committed to a consistent sampling rate across models.”
§ The Leaderboard Illusion > -Charles A. E. Goodhart
hedged- Asserted: passes — The authors put it forward as true.
- Checkable: passes — It can be checked against evidence.
- Load-bearing: passes — The paper’s conclusions depend on it.
- Based: passes — The paper gives a reason why it holds.
It may state two separate claims as one.
A result the paper reports from its own data — it cites no other source for it, so there is none to check. The quote shows it is in the paper.
In the paper
“The two checkpoints are variants of the same model, with each showing slightly better performance on different subsets of benchmarks.”
§ The Leaderboard Illusion > 3.3 Real-world Chatbot Arena Experiment
plain- Asserted: passes — The authors put it forward as true.
- Checkable: passes — It can be checked against evidence.
- Load-bearing: passes — The paper’s conclusions depend on it.
- Based: passes — The paper gives a reason why it holds.
It may state two separate claims as one.
A result the paper reports from its own data — it cites no other source for it, so there is none to check. The quote shows it is in the paper.
In the paper
“We show that it is possible to increase Arena scores even in the most conservative case of identical checkpoints, and further amplify the difference by strategically testing different checkpoints.”
- Also stated in: § I Silent Model Deprecation: Additional Details · hedged
“We show that it is possible to increase Arena scores even in the most conservative case of identical checkpoints, and further amplify the difference by strategically testing different checkpoints.”
§ The Leaderboard Illusion > Unbiased Sampling Assumption.
hedgeddirect- Asserted: passes — The authors put it forward as true.
- Checkable: passes — It can be checked against evidence.
- Load-bearing: passes — The paper’s conclusions depend on it.
- Based: passes — The paper gives a reason why it holds.
It may state two separate claims as one.
- Also stated in: § I Silent Model Deprecation: Additional Details · hedged
The paper states this without a source or data behind it here, so there is nothing to check it against. The quote shows it is in the paper.
In the paper
“This data is often accessible to model providers through API calls originating from Chatbot Arena battles.”
§ The Leaderboard Illusion > 4.1 Disparity in access to Chatbot Arena Data
plaindirect- Asserted: passes — The authors put it forward as true.
- Checkable: passes — It can be checked against evidence.
- Load-bearing: passes — The paper’s conclusions depend on it.
- Based: fails — The paper may give no reason why it holds.
Probably not a substantial claim. The paper may give no reason why it holds.
A result the paper reports from its own data — it cites no other source for it, so there is none to check. The quote shows it is in the paper.
In the paper
“Other providers with relatively high sampling rates include xAI (22.0%) and Meta (17.9%), highlighting substantial variation across the board.”
§ The Leaderboard Illusion > 4.1 Disparity in access to Chatbot Arena Data
plain- Asserted: passes — The authors put it forward as true.
- Checkable: passes — It can be checked against evidence.
- Load-bearing: unclear — It is unclear whether the paper’s conclusions depend on it.
- Based: passes — The paper gives a reason why it holds.
It may state two separate claims as one.
A result the paper reports from its own data — it cites no other source for it, so there is none to check. The quote shows it is in the paper.
In the paper
“Critically, we find that open-weight and open-source models are far more likely to be deprecated and, hence, receive unreliable ratings.”
§ The Leaderboard Illusion > -Charles A. E. Goodhart
hedgeddirect- Asserted: passes — The authors put it forward as true.
- Checkable: passes — It can be checked against evidence.
- Load-bearing: passes — The paper’s conclusions depend on it.
- Based: passes — The paper gives a reason why it holds.
It may state two separate claims as one.
The paper states this without a source or data behind it here, so there is nothing to check it against. The quote shows it is in the paper.
In the paper
“Notably, we find that Chatbot Arena does not require all submitted models to be made public, and there is no guarantee that the version appearing on the public leaderboard matches the publicly available API”
§ The Leaderboard Illusion > -Charles A. E. Goodhart
plain- Asserted: passes — The authors put it forward as true.
- Checkable: passes — It can be checked against evidence.
- Load-bearing: passes — The paper’s conclusions depend on it.
- Based: unclear — It is unclear why the paper says it holds.
It may state two separate claims as one.
A result the paper reports from its own data — it cites no other source for it, so there is none to check. The quote shows it is in the paper.
In the paper
“In Figure 9, we illustrate the extreme ends of the scores obtained by the two models (1097 vs. 1059), with 9 models falling in between both variants on the leaderboard.”
§ The Leaderboard Illusion > 3.3 Real-world Chatbot Arena Experiment
plain- Asserted: passes — The authors put it forward as true.
- Checkable: passes — It can be checked against evidence.
- Load-bearing: passes — The paper’s conclusions depend on it.
- Based: passes — The paper gives a reason why it holds.
It may state two separate claims as one.
A result the paper reports from its own data — it cites no other source for it, so there is none to check. The quote shows it is in the paper.
In the paper
“We observe large differences in final scores (1097 vs. 1059) for the two different model variants.”
§ The Leaderboard Illusion > Arena Scores for Aya-Vision-8B yield different Arena scores (1069 vs. 1052).
plaincorrelational- Asserted: passes — The authors put it forward as true.
- Checkable: passes — It can be checked against evidence.
- Load-bearing: passes — The paper’s conclusions depend on it.
- Based: passes — The paper gives a reason why it holds.
It may state two separate claims as one.
A result the paper reports from its own data — it cites no other source for it, so there is none to check. The quote shows it is in the paper.
In the paper
“We observe that many models are also silently deprecated, which means their sampling rate is reduced to nearly 0% without notification, even though some of them do not meet the stated criteria of the deprecation policy.”
§ The Leaderboard Illusion > 4.1 Disparity in access to Chatbot Arena Data
plain- Asserted: passes — The authors put it forward as true.
- Checkable: passes — It can be checked against evidence.
- Load-bearing: passes — The paper’s conclusions depend on it.
- Based: passes — The paper gives a reason why it holds.
It may state two separate claims as one.
The paper states this without a source or data behind it here, so there is nothing to check it against. The quote shows it is in the paper.
In the paper
“In the course of our discussions, we learned that some providers were testing multiple variants privately, a practice that appeared to be selectively disclosed and limited to only a few model providers.”
§ The Leaderboard Illusion > -Charles A. E. Goodhart
hedged- Asserted: passes — The authors put it forward as true.
- Checkable: passes — It can be checked against evidence.
- Load-bearing: passes — The paper’s conclusions depend on it.
- Based: passes — The paper gives a reason why it holds.
It may state two separate claims as one.
A result the paper reports from its own data — it cites no other source for it, so there is none to check. The quote shows it is in the paper.
In the paper
“As shown in Figure 6, some providers deploy far more private variants, which can significantly increase the volume of data collected.”
§ The Leaderboard Illusion > 4.1 Disparity in access to Chatbot Arena Data
plaindirect- Asserted: passes — The authors put it forward as true.
- Checkable: passes — It can be checked against evidence.
- Load-bearing: passes — The paper’s conclusions depend on it.
- Based: passes — The paper gives a reason why it holds.
It may state two separate claims as one.
In the paper
“These rates are determined by Chatbot Arena, but are often entirely inconsistent with the stated policy and prior proposals by the organizers to automatically set sampling based upon which models have not converged in score (Chiang et al., 2024).”
§ The Leaderboard Illusion > 4.1 Disparity in access to Chatbot Arena Data
What the sources say
- Not matchedcites Chiang et al., 2024
Couldn’t be matched to a paper in Crossref, so it can’t be checked.
plain- Asserted: passes — The authors put it forward as true.
- Checkable: passes — It can be checked against evidence.
- Load-bearing: passes — The paper’s conclusions depend on it.
- Based: passes — The paper gives a reason why it holds.
It may state two separate claims as one.
- Not matched
A result the paper reports from its own data — it cites no other source for it, so there is none to check. The quote shows it is in the paper.
In the paper
“Increasing the amount of arena data in a supervised fine-tuning mixture (0% → 30% → 70%) significantly improves win-rates of the resulting model against both the model variant where no Chatbot Arena data is used and also Llama-3.1-8B.”
§ The Leaderboard Illusion > 4.1 Disparity in access to Chatbot Arena Data
plaindirect- Asserted: passes — The authors put it forward as true.
- Checkable: passes — It can be checked against evidence.
- Load-bearing: passes — The paper’s conclusions depend on it.
- Based: passes — The paper gives a reason why it holds.
It may state two separate claims as one.
A result the paper reports from its own data — it cites no other source for it, so there is none to check. The quote shows it is in the paper.
In the paper
“We also establish that proprietary closed models are sampled at higher rates (number of battles) and have fewer models removed from the arena than open-weight and open-source alternatives.”
§ The Leaderboard Illusion > Abstract
plaincorrelational- Asserted: passes — The authors put it forward as true.
- Checkable: passes — It can be checked against evidence.
- Load-bearing: passes — The paper’s conclusions depend on it.
- Based: passes — The paper gives a reason why it holds.
It may state two separate claims as one.
A result the paper reports from its own data — it cites no other source for it, so there is none to check. The quote shows it is in the paper.
In the paper
“At the extreme, Google and OpenAI reach a maximum daily sampling rate of 34%, while Reka registers the lowest at 3.3%.”
§ The Leaderboard Illusion > 4.1 Disparity in access to Chatbot Arena Data
plain- Asserted: passes — The authors put it forward as true.
- Checkable: passes — It can be checked against evidence.
- Load-bearing: passes — The paper’s conclusions depend on it.
- Based: passes — The paper gives a reason why it holds.
It may state two separate claims as one.
A result the paper reports from its own data — it cites no other source for it, so there is none to check. The quote shows it is in the paper.
In the paper
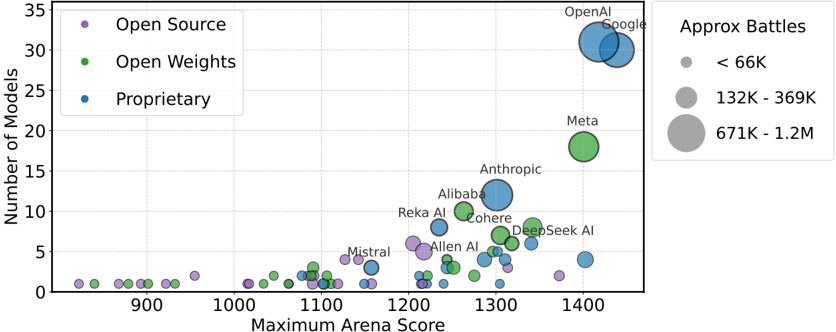
“Proprietary model providers tend to achieve higher leaderboard scores, which appear to correlate with both the number of models they release and the number of Arena battles played.”
§ The Leaderboard Illusion > -Charles A. E. Goodhart
hedgedcorrelational- Asserted: passes — The authors put it forward as true.
- Checkable: passes — It can be checked against evidence.
- Load-bearing: passes — The paper’s conclusions depend on it.
- Based: passes — The paper gives a reason why it holds.
It may state two separate claims as one.
A result the paper reports from its own data — it cites no other source for it, so there is none to check. The quote shows it is in the paper.
In the paper
“OpenAI, Google, Meta, and Anthropic collectively account for 62.8% of the Arena data, which is 68 times more than the combined share of top academic and non-profit labs like Allen AI, Stanford, Princeton, and UC Berkeley.”
§ The Leaderboard Illusion > 4 Results: Impact of Data Access Asymmetries on Arena Scores
plain- Asserted: passes — The authors put it forward as true.
- Checkable: passes — It can be checked against evidence.
- Load-bearing: passes — The paper’s conclusions depend on it.
- Based: unclear — It is unclear why the paper says it holds.
It may state two separate claims as one.
A result the paper reports from its own data — it cites no other source for it, so there is none to check. The quote shows it is in the paper.
In the paper
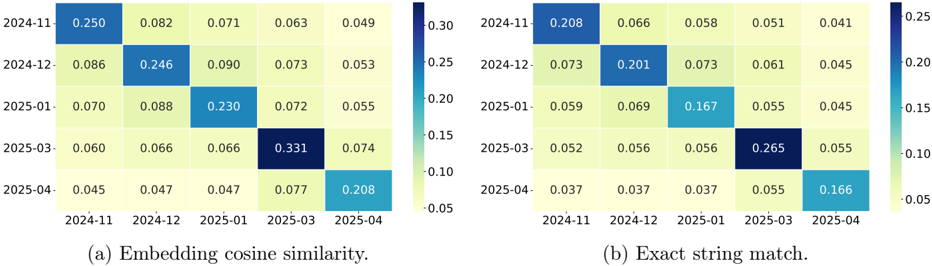
“Chinese prompts more than doubled from 5-7% in 2023 to 16.4% in March 2024, coinciding with the introduction of the Chinese leaderboard on Chatbot Arena, before dropping back to 6.2% in January 2025.”
§ The Leaderboard Illusion > 4.2 Risk of Potential Overfitting
plaincorrelational- Asserted: passes — The authors put it forward as true.
- Checkable: passes — It can be checked against evidence.
- Load-bearing: passes — The paper’s conclusions depend on it.
- Based: passes — The paper gives a reason why it holds.
It may state two separate claims as one.
A result the paper reports from its own data — it cites no other source for it, so there is none to check. The quote shows it is in the paper.
In the paper
“Through simulated experiments, we show that this can produce fragmented clusters, and as a result, the global rankings become unreliable.”
§ The Leaderboard Illusion > 5 Results: Impact of Model Deprecation on Arena Scores
plaindirect- Asserted: passes — The authors put it forward as true.
- Checkable: passes — It can be checked against evidence.
- Load-bearing: passes — The paper’s conclusions depend on it.
- Based: passes — The paper gives a reason why it holds.
It may state two separate claims as one.
A result the paper reports from its own data — it cites no other source for it, so there is none to check. The quote shows it is in the paper.
In the paper
“For instance, the share of Russian prompts increased from 1% in April 2023 to 8.8% in April 2024, and further to 15.7% by December 2024.”
§ The Leaderboard Illusion > 4.2 Risk of Potential Overfitting
plaindirect- Asserted: passes — The authors put it forward as true.
- Checkable: passes — It can be checked against evidence.
- Load-bearing: passes — The paper’s conclusions depend on it.
- Based: passes — The paper gives a reason why it holds.
It may state two separate claims as one.
The paper states this without a source or data behind it here, so there is nothing to check it against. The quote shows it is in the paper.
In the paper
“In practice, Chatbot Arena's prompt categories and task types evolve over time, and some models become deprecated, meaning they are no longer re-evaluated under the current conditions.”
§ The Leaderboard Illusion > Proprietary
plaindirect- Asserted: passes — The authors put it forward as true.
- Checkable: passes — It can be checked against evidence.
- Load-bearing: passes — The paper’s conclusions depend on it.
- Based: passes — The paper gives a reason why it holds.
It may state two separate claims as one.
The paper states this without a source or data behind it here, so there is nothing to check it against. The quote shows it is in the paper.
In the paper
“Most of these findings were only possible through access to private model testing, or crawling Chatbot Arena over a period of time.”
§ The Leaderboard Illusion > When my information changes, I alter my conclusions. What do you do, sir? -John Maynard Keynes
plaindirect- Asserted: passes — The authors put it forward as true.
- Checkable: passes — It can be checked against evidence.
- Load-bearing: passes — The paper’s conclusions depend on it.
- Based: passes — The paper gives a reason why it holds.
Probably not a substantial claim.
The paper states this without a source or data behind it here, so there is nothing to check it against. The quote shows it is in the paper.
In the paper
“The relative gains in win-rates are 81.7% for the 30_arena and 112.3% for the 70_arena variant.”
§ The Leaderboard Illusion > 4.2 Risk of Potential Overfitting
plain- Asserted: passes — The authors put it forward as true.
- Checkable: passes — It can be checked against evidence.
- Load-bearing: passes — The paper’s conclusions depend on it.
- Based: passes — The paper gives a reason why it holds.
It may state two separate claims as one.
The paper states this without a source or data behind it here, so there is nothing to check it against. The quote shows it is in the paper.
In the paper
“This dataset is widely used to gauge expected performance on the Arena.”
§ The Leaderboard Illusion > 4.2 Risk of Potential Overfitting
boostedcorrelational- Asserted: passes — The authors put it forward as true.
- Checkable: passes — It can be checked against evidence.
- Load-bearing: fails — The paper’s conclusions may not depend on it.
- Based: passes — The paper gives a reason why it holds.
Probably not a substantial claim. The paper’s conclusions may not depend on it.
The paper states this without a source or data behind it here, so there is nothing to check it against. The quote shows it is in the paper.
In the paper
“This dataset consists of challenging user-submitted prompts from Arena that have been carefully curated and evaluated against several criteria, including, but not limited to, domain knowledge, complexity, and problem-solving.”
§ The Leaderboard Illusion > 4.2 Risk of Potential Overfitting
hedged- Asserted: passes — The authors put it forward as true.
- Checkable: passes — It can be checked against evidence.
- Load-bearing: passes — The paper’s conclusions depend on it.
- Based: passes — The paper gives a reason why it holds.
Probably not a substantial claim.
The paper states this without a source or data behind it here, so there is nothing to check it against. The quote shows it is in the paper.
In the paper
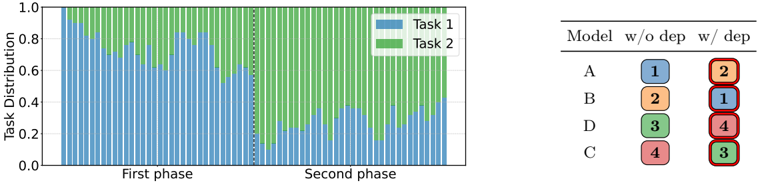
“Models A and D are ranked lower, and Models B and C are ranked higher than their true performance merits.”
§ The Leaderboard Illusion > 5.1 Transitivity Under Changing Evaluation Conditions
plaindirect- Asserted: passes — The authors put it forward as true.
- Checkable: passes — It can be checked against evidence.
- Load-bearing: passes — The paper’s conclusions depend on it.
- Based: passes — The paper gives a reason why it holds.
It may state two separate claims as one.
The paper states this without a source or data behind it here, so there is nothing to check it against. The quote shows it is in the paper.
In the paper
“This time frame coincided with Meta's launch of Llama 4”
§ The Leaderboard Illusion > 7 Limitations
plaincorrelational- Asserted: passes — The authors put it forward as true.
- Checkable: passes — It can be checked against evidence.
- Load-bearing: passes — The paper’s conclusions depend on it.
- Based: fails — The paper may give no reason why it holds.
Probably not a substantial claim. The paper may give no reason why it holds.
None of the sources cited for this claim have been checked yet.
In the paper
“There is a context length limit of 12000 characters on Chatbot Arena prompts, which excludes certain types of longer or more complex inputs from being evaluated 21 , and can result in a selection bias of what is asked.”
§ The Leaderboard Illusion > 4.2 Risk of Potential Overfitting
plaindirect- Asserted: passes — The authors put it forward as true.
- Checkable: passes — It can be checked against evidence.
- Load-bearing: passes — The paper’s conclusions depend on it.
- Based: passes — The paper gives a reason why it holds.
It may state two separate claims as one.
A result the paper reports from its own data — it cites no other source for it, so there is none to check. The quote shows it is in the paper.
In the paper
“The results reveal a clear divergence in performance trends (Table 9): while increasing the proportion of Chatbot Arena data within a fixed training budget yielded consistent improvements on the Arena test set, MMLU performance slightly declined from 66.5% (0_arena) to 64.4% (30_arena) and 65.9% (70_arena).”
§ The Leaderboard Illusion > 4.2 Risk of Potential Overfitting
plaindirect- Asserted: passes — The authors put it forward as true.
- Checkable: passes — It can be checked against evidence.
- Load-bearing: passes — The paper’s conclusions depend on it.
- Based: passes — The paper gives a reason why it holds.
It may state two separate claims as one.
The paper states this without a source or data behind it here, so there is nothing to check it against. The quote shows it is in the paper.
In the paper
“We note that many of these models are hosted for free on the Arena, and so there should be clarity about what source of pricing is being used.”
§ The Leaderboard Illusion > When my information changes, I alter my conclusions. What do you do, sir? -John Maynard Keynes
plain- Asserted: passes — The authors put it forward as true.
- Checkable: fails — It may be too vague to check against evidence.
- Load-bearing: passes — The paper’s conclusions depend on it.
- Based: passes — The paper gives a reason why it holds.
Probably not a substantial claim. It may be too vague to check against evidence. It may state two separate claims as one.
A result the paper reports from its own data — it cites no other source for it, so there is none to check. The quote shows it is in the paper.
In the paper
“Variant 0_arena scores a win-rate of 23.5%, 30_arena scores a win-rate of 42.7%, and variant 70_arena, which is trained on the most arena-mix, data scores a win-rate of 49.9% against Llama-3.1-8B-Instruct.”
§ The Leaderboard Illusion > 4.2 Risk of Potential Overfitting
plain- Asserted: passes — The authors put it forward as true.
- Checkable: passes — It can be checked against evidence.
- Load-bearing: passes — The paper’s conclusions depend on it.
- Based: passes — The paper gives a reason why it holds.
It may state two separate claims as one.
In the paper
“For example, in a released dataset from Arena (Zheng et al., 2024) with 33k samples, no questions are referencing Chaucer while dozens of questions are about Star Trek, highlighting the uneven distribution of topics in this test set 23 .”
§ The Leaderboard Illusion > 4.2 Risk of Potential Overfitting
What the sources say
- Not matchedcites Zheng et al., 2024
Couldn’t be matched to a paper in Crossref, so it can’t be checked.
plain- Asserted: passes — The authors put it forward as true.
- Checkable: passes — It can be checked against evidence.
- Load-bearing: passes — The paper’s conclusions depend on it.
- Based: passes — The paper gives a reason why it holds.
It may state two separate claims as one.
- Not matched
The paper states this without a source or data behind it here, so there is nothing to check it against. The quote shows it is in the paper.
In the paper
“we have not seen evidence of its deployment in the current leaderboard.”
§ The Leaderboard Illusion > When my information changes, I alter my conclusions. What do you do, sir? -John Maynard Keynes
plain- Asserted: passes — The authors put it forward as true.
- Checkable: passes — It can be checked against evidence.
- Load-bearing: passes — The paper’s conclusions depend on it.
- Based: fails — The paper may give no reason why it holds.
Probably not a substantial claim. The paper may give no reason why it holds.
A result the paper reports from its own data — it cites no other source for it, so there is none to check. The quote shows it is in the paper.
In the paper
“English prompt share dropped from over 80% to nearly 50%, while usage of Chinese, Russian, and Korean prompts increased significantly.”
§ The Leaderboard Illusion > I Silent Model Deprecation: Additional Details
plaincorrelational- Asserted: passes — The authors put it forward as true.
- Checkable: passes — It can be checked against evidence.
- Load-bearing: unclear — It is unclear whether the paper’s conclusions depend on it.
- Based: passes — The paper gives a reason why it holds.
It may state two separate claims as one.
- Rests on an assumption: The historical-battles dataset is representative of the overall task distribution on Chatbot Arena.
A result the paper reports from its own data — it cites no other source for it, so there is none to check. The quote shows it is in the paper.
In the paper
“In total, our real-world data sources encompass 2M battles and cover 243 models across 42 providers.”
§ The Leaderboard Illusion > Data availability
plain- Asserted: passes — The authors put it forward as true.
- Checkable: passes — It can be checked against evidence.
- Load-bearing: unclear — It is unclear whether the paper’s conclusions depend on it.
- Based: passes — The paper gives a reason why it holds.
It may state two separate claims as one.
A result the paper reports from its own data — it cites no other source for it, so there is none to check. The quote shows it is in the paper.
In the paper
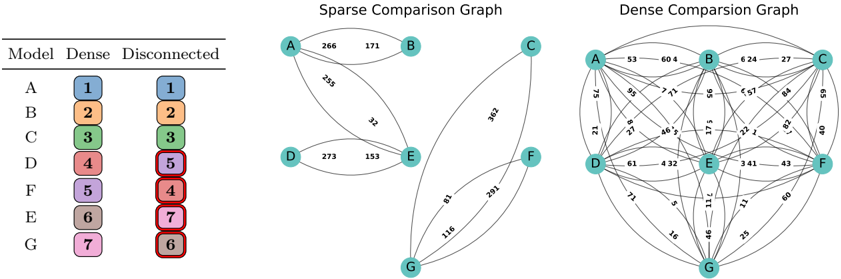
“Rankings for models D, E, F, and G diverge from the gold rankings when the comparison graph is sparse, whereas model rankings fully align with the gold rankings when the comparison graph is dense.”
§ The Leaderboard Illusion > I Silent Model Deprecation: Additional Details
plaindirect- Asserted: passes — The authors put it forward as true.
- Checkable: passes — It can be checked against evidence.
- Load-bearing: passes — The paper’s conclusions depend on it.
- Based: passes — The paper gives a reason why it holds.
It may state two separate claims as one.
The paper states this without a source or data behind it here, so there is nothing to check it against. The quote shows it is in the paper.
In the paper
“The widespread and apparent willful participation in the gamification of arena scores from a handful of top-tier industry labs is undoubtedly a new low for the AI research field.”
§ The Leaderboard Illusion > 9 Conclusion
boosted- Asserted: passes — The authors put it forward as true.
- Checkable: fails — It may be too vague to check against evidence.
- Load-bearing: passes — The paper’s conclusions depend on it.
- Based: fails — The paper may give no reason why it holds.
Probably not a substantial claim. It may be too vague to check against evidence. The paper may give no reason why it holds.
The paper states this without a source or data behind it here, so there is nothing to check it against. The quote shows it is in the paper.
In the paper
“Historical Battles (historical-battles): is a collection of 1.8 million battles from Chatbot”
§ The Leaderboard Illusion > Additional information
plain- Asserted: passes — The authors put it forward as true.
- Checkable: passes — It can be checked against evidence.
- Load-bearing: fails — The paper’s conclusions may not depend on it.
- Based: fails — The paper may give no reason why it holds.
Probably not a substantial claim. The paper’s conclusions may not depend on it. The paper may give no reason why it holds. The quote only partly states this claim.
A result the paper reports from its own data — it cites no other source for it, so there is none to check. The quote shows it is in the paper.
In the paper
“Meta, Google, and Amazon account for the highest number of private submissions, with Meta alone testing 27 anonymous models in March alone.”
§ The Leaderboard Illusion > I Silent Model Deprecation: Additional Details
plain- Asserted: passes — The authors put it forward as true.
- Checkable: passes — It can be checked against evidence.
- Load-bearing: unclear — It is unclear whether the paper’s conclusions depend on it.
- Based: passes — The paper gives a reason why it holds.
It may state two separate claims as one.
The paper states this without a source or data behind it here, so there is nothing to check it against. The quote shows it is in the paper.
In the paper
“all datasets published by LMArena are already de-duplicated so they won't be useful for capturing the extent of similar or overlapping queries.”
§ The Leaderboard Illusion > Additional information
plaindirect- Asserted: passes — The authors put it forward as true.
- Checkable: passes — It can be checked against evidence.
- Load-bearing: passes — The paper’s conclusions depend on it.
- Based: fails — The paper may give no reason why it holds.
Probably not a substantial claim. The paper may give no reason why it holds. It may state two separate claims as one.
A result the paper reports from its own data — it cites no other source for it, so there is none to check. The quote shows it is in the paper.
In the paper
“We also captured 14 other private models as part of our scraping but weren't able to de-anonymize them”
§ The Leaderboard Illusion > E.1 De-anonymizing Model Identities
plain- Asserted: passes — The authors put it forward as true.
- Checkable: passes — It can be checked against evidence.
- Load-bearing: fails — The paper’s conclusions may not depend on it.
- Based: passes — The paper gives a reason why it holds.
Probably not a substantial claim. The paper’s conclusions may not depend on it. It may state two separate claims as one.
- Rests on an assumption: Model self-identification reliably attributes private models to their respective providers.
A result the paper reports from its own data — it cites no other source for it, so there is none to check. The quote shows it is in the paper.
In the paper
“Model family A has a lower average Arena Score than Model family B, yet by submitting multiple private variants and selecting the best-performing one, it can surpass the sole public submission from Model family B.”
§ The Leaderboard Illusion > I Silent Model Deprecation: Additional Details
plaindirect- Asserted: passes — The authors put it forward as true.
- Checkable: passes — It can be checked against evidence.
- Load-bearing: passes — The paper’s conclusions depend on it.
- Based: passes — The paper gives a reason why it holds.
It may state two separate claims as one.
A result the paper reports from its own data — it cites no other source for it, so there is none to check. The quote shows it is in the paper.
In the paper
“Among officially deprecated models, 30% are proprietary, while only 2.4% are open-weight.”
§ The Leaderboard Illusion > I Silent Model Deprecation: Additional Details
plain- Asserted: passes — The authors put it forward as true.
- Checkable: passes — It can be checked against evidence.
- Load-bearing: unclear — It is unclear whether the paper’s conclusions depend on it.
- Based: passes — The paper gives a reason why it holds.
It may state two separate claims as one.
The paper states this without a source or data behind it here, so there is nothing to check it against. The quote shows it is in the paper.
In the paper
“LMArena has collected around 3M user votes via Chatbot Arena in total.”
§ The Leaderboard Illusion > G Data Access Estimation for Different Providers
plain- Asserted: passes — The authors put it forward as true.
- Checkable: passes — It can be checked against evidence.
- Load-bearing: passes — The paper’s conclusions depend on it.
- Based: fails — The paper may give no reason why it holds.
Probably not a substantial claim. The paper may give no reason why it holds.
The paper states this without a source or data behind it here, so there is nothing to check it against. The quote shows it is in the paper.
In the paper
“Theorem 1 For every N ≥ 2, E[ βBest ] > E[ βk ] ⇐⇒ Var( βk ) = 0.”
§ The Leaderboard Illusion > 9 Conclusion
plain- Asserted: passes — The authors put it forward as true.
- Checkable: passes — It can be checked against evidence.
- Load-bearing: passes — The paper’s conclusions depend on it.
- Based: passes — The paper gives a reason why it holds.
It may state two separate claims as one.
The paper states this without a source or data behind it here, so there is nothing to check it against. The quote shows it is in the paper.
In the paper
“We show that coordination among a handful of providers and preferential policies from Chatbot Arena towards the same small group have jeopardized scientific integrity and reliable Arena rankings.”
§ The Leaderboard Illusion > 9 Conclusion
plaindirect- Asserted: passes — The authors put it forward as true.
- Checkable: passes — It can be checked against evidence.
- Load-bearing: passes — The paper’s conclusions depend on it.
- Based: unclear — It is unclear why the paper says it holds.
It may state two separate claims as one.
A result the paper reports from its own data — it cites no other source for it, so there is none to check. The quote shows it is in the paper.
In the paper
“Increasing the amount of arena data in a supervised fine-tuning mixture (0% → 30% → 70%) significantly improves win-rates of the resulting model against both the model variant where no Chatbot Arena data is used and also Llama-3.1-8B.”
§ The Leaderboard Illusion > I Silent Model Deprecation: Additional Details
boosteddirect- Asserted: passes — The authors put it forward as true.
- Checkable: passes — It can be checked against evidence.
- Load-bearing: unclear — It is unclear whether the paper’s conclusions depend on it.
- Based: passes — The paper gives a reason why it holds.
It may state two separate claims as one.
The paper states this without a source or data behind it here, so there is nothing to check it against. The quote shows it is in the paper.
In the paper
“the total no. of API calls used to represent the data available to the model providers is 5M, which is less than the total number of estimated API calls, which is 6 million.”
§ The Leaderboard Illusion > G Data Access Estimation for Different Providers
plain- Asserted: passes — The authors put it forward as true.
- Checkable: passes — It can be checked against evidence.
- Load-bearing: fails — The paper’s conclusions may not depend on it.
- Based: passes — The paper gives a reason why it holds.
Probably not a substantial claim. The paper’s conclusions may not depend on it. It may state two separate claims as one.
- Rests on an assumption: The number of model API calls is a valid measure of the volume of data available to model providers.
A result the paper reports from its own data — it cites no other source for it, so there is none to check. The quote shows it is in the paper.
In the paper
“Google and OpenAI had the most public models active during this period, with 15 and 9 models, respectively.”
§ The Leaderboard Illusion > Additional information
plain- Asserted: passes — The authors put it forward as true.
- Checkable: passes — It can be checked against evidence.
- Load-bearing: unclear — It is unclear whether the paper’s conclusions depend on it.
- Based: passes — The paper gives a reason why it holds.
It may state two separate claims as one.
A result the paper reports from its own data — it cites no other source for it, so there is none to check. The quote shows it is in the paper.
In the paper
“At the extreme, Google and OpenAI reach a maximum daily sampling rate of 34%, while Reka registers the lowest at 3.3%.”
§ The Leaderboard Illusion > Additional information
plain- Asserted: passes — The authors put it forward as true.
- Checkable: passes — It can be checked against evidence.
- Load-bearing: unclear — It is unclear whether the paper’s conclusions depend on it.
- Based: passes — The paper gives a reason why it holds.
It may state two separate claims as one.
- Rests on an assumption: A model's sampling rate determines the amount of data its provider receives.
- Rests on an assumption: The scraped random sample is representative of all Chatbot Arena battles during the period studied.
A result the paper reports from its own data — it cites no other source for it, so there is none to check. The quote shows it is in the paper.
In the paper
“86.6% of open-weight models and 87.8% of open-source models on the Arena are silently deprecated.”
§ The Leaderboard Illusion > I Silent Model Deprecation: Additional Details
plain- Asserted: passes — The authors put it forward as true.
- Checkable: passes — It can be checked against evidence.
- Load-bearing: passes — The paper’s conclusions depend on it.
- Based: passes — The paper gives a reason why it holds.
It may state two separate claims as one.
A conclusion the paper draws from its own results — it cites no other source for it, so there is none to check. The quote shows it is in the paper.
In the paper
“This is of particular concern given Chatbot Arena is a community-driven leaderboard, however, the main beneficiaries of this free human feedback appear to be commercial entities who are frequently preferred for private testing.”
§ The Leaderboard Illusion > 4.1 Disparity in access to Chatbot Arena Data
hedgedcorrelational- Asserted: passes — The authors put it forward as true.
- Checkable: passes — It can be checked against evidence.
- Load-bearing: passes — The paper’s conclusions depend on it.
- Based: passes — The paper gives a reason why it holds.
Probably not a substantial claim.
In the paper
“Finally, it assumes that the comparison network is fully interconnected-that is, every model must be linked directly or indirectly through pairwise matchups.”
§ The Leaderboard Illusion > 2.1 Introduction to the Arena Score
What the sources say
- Not matchedcites Bradley & Terry, 1952
Couldn’t be matched to a paper in Crossref, so it can’t be checked.
plaincorrelational- Asserted: passes — The authors put it forward as true.
- Checkable: passes — It can be checked against evidence.
- Load-bearing: passes — The paper’s conclusions depend on it.
- Based: passes — The paper gives a reason why it holds.
Probably not a substantial claim.
- Not matched
A conclusion the paper draws from its own results — it cites no other source for it, so there is none to check. The quote shows it is in the paper.
In the paper
“We observe that the collective impact of these factors appears to be advantageous to a small handful of providers and is often inconsistent with the stated policy.”
§ The Leaderboard Illusion > 4.1 Disparity in access to Chatbot Arena Data
hedgedconditional- Asserted: passes — The authors put it forward as true.
- Checkable: passes — It can be checked against evidence.
- Load-bearing: passes — The paper’s conclusions depend on it.
- Based: passes — The paper gives a reason why it holds.
It may state two separate claims as one.
A conclusion the paper draws from its own results — it cites no other source for it, so there is none to check. The quote shows it is in the paper.
In the paper
“Multiple factors impact the amount of the data obtained by a given provider, some of which are determined by Chatbot Arena versus others which are within the control of the providers:”
§ The Leaderboard Illusion > 4.1 Disparity in access to Chatbot Arena Data
plaindirect- Asserted: passes — The authors put it forward as true.
- Checkable: passes — It can be checked against evidence.
- Load-bearing: passes — The paper’s conclusions depend on it.
- Based: passes — The paper gives a reason why it holds.
It may state two separate claims as one.
A conclusion the paper draws from its own results — it cites no other source for it, so there is none to check. The quote shows it is in the paper.
In the paper
“Larger labs and companies likely have access to significantly more such data, which, if used, could yield even greater gains.”
§ The Leaderboard Illusion > 4 Results: Impact of Data Access Asymmetries on Arena Scores
hedgedconditional- Asserted: passes — The authors put it forward as true.
- Checkable: passes — It can be checked against evidence.
- Load-bearing: passes — The paper’s conclusions depend on it.
- Based: passes — The paper gives a reason why it holds.
Probably not a substantial claim. It may state two separate claims as one.
In the paper
“The BT model assumes that pairwise comparisons are drawn from an unbiased sampling process, so that each model's skill parameter is estimated independently and based on representative outcomes.”
§ The Leaderboard Illusion > 2.1 Introduction to the Arena Score
What the sources say
- Not matchedcites Bradley & Terry, 1952
Couldn’t be matched to a paper in Crossref, so it can’t be checked.
plain- Asserted: passes — The authors put it forward as true.
- Checkable: passes — It can be checked against evidence.
- Load-bearing: passes — The paper’s conclusions depend on it.
- Based: passes — The paper gives a reason why it holds.
Probably not a substantial claim.
- Not matched
A conclusion the paper draws from its own results — it cites no other source for it, so there is none to check. The quote shows it is in the paper.
In the paper
“This is due to a combination of unequal sampling rates (how often a model appears in a Chatbot Arena battle) and deprecation policies (which models are retired from the arena).”
§ The Leaderboard Illusion > -Charles A. E. Goodhart
plaindirect- Asserted: passes — The authors put it forward as true.
- Checkable: passes — It can be checked against evidence.
- Load-bearing: passes — The paper’s conclusions depend on it.
- Based: passes — The paper gives a reason why it holds.
It may state two separate claims as one.
The paper states this without a source or data behind it here, so there is nothing to check it against. The quote shows it is in the paper.
In the paper
“Deviations from these assumptions, such as biased comparisons or a fragmented graph, can compromise the reliability and consistency of the strength estimates.”
§ The Leaderboard Illusion > 2.1 Introduction to the Arena Score
plainconditional- Asserted: passes — The authors put it forward as true.
- Checkable: passes — It can be checked against evidence.
- Load-bearing: passes — The paper’s conclusions depend on it.
- Based: passes — The paper gives a reason why it holds.
Probably not a substantial claim.
A conclusion the paper draws from its own results — it cites no other source for it, so there is none to check. The quote shows it is in the paper.
In the paper
“Hence, with an”
§ The Leaderboard Illusion > Unbiased Sampling Assumption.
plaindirect- Asserted: passes — The authors put it forward as true.
- Checkable: passes — It can be checked against evidence.
- Load-bearing: passes — The paper’s conclusions depend on it.
- Based: fails — The paper may give no reason why it holds.
Probably not a substantial claim. The paper may give no reason why it holds.
- Rests on an assumption: During LLM development, providers typically end up with multiple final candidate model variants that perform similarly overall but excel on different tasks.
- Rests on an assumption: A strong signal such as a clear lead on an arena-style leaderboard can significantly influence which variant a provider selects as final.
A conclusion the paper draws from its own results — it cites no other source for it, so there is none to check. The quote shows it is in the paper.
In the paper
“We show that these differences lead to distorted and unreliable Arena rankings and create conditions in which providers may be overfitting to Arena-specific dynamics rather than general model quality.”
§ The Leaderboard Illusion > -Charles A. E. Goodhart
hedgeddirect- Asserted: passes — The authors put it forward as true.
- Checkable: passes — It can be checked against evidence.
- Load-bearing: passes — The paper’s conclusions depend on it.
- Based: passes — The paper gives a reason why it holds.
It may state two separate claims as one.
A conclusion the paper draws from its own results — it cites no other source for it, so there is none to check. The quote shows it is in the paper.
In the paper
“Both these policies lead to large data access asymmetries over time.”
§ The Leaderboard Illusion > Abstract
plaindirect- Asserted: passes — The authors put it forward as true.
- Checkable: passes — It can be checked against evidence.
- Load-bearing: passes — The paper’s conclusions depend on it.
- Based: passes — The paper gives a reason why it holds.
It may state two separate claims as one.
A conclusion the paper draws from its own results — it cites no other source for it, so there is none to check. The quote shows it is in the paper.
In the paper
“Indeed, we show that this skews Arena scores upwards and allows a handful of preferred providers to gamify the leaderboard.”
§ The Leaderboard Illusion > Critical Recommendations to Restore Trust to the Chatbot Arena
boosteddirect- Asserted: passes — The authors put it forward as true.
- Checkable: passes — It can be checked against evidence.
- Load-bearing: passes — The paper’s conclusions depend on it.
- Based: passes — The paper gives a reason why it holds.
It may state two separate claims as one.
A conclusion the paper draws from its own results — it cites no other source for it, so there is none to check. The quote shows it is in the paper.
In the paper
“This leads us to believe only certain providers were made aware they could submit multiple private variants, as we observe clear differences in the number and frequency of private testing among providers.”
§ The Leaderboard Illusion > 3.1 Preferred Providers Frequently Use Private Testing
hedgeddirect- Asserted: passes — The authors put it forward as true.
- Checkable: passes — It can be checked against evidence.
- Load-bearing: passes — The paper’s conclusions depend on it.
- Based: passes — The paper gives a reason why it holds.
It may state two separate claims as one.
A conclusion the paper draws from its own results — it cites no other source for it, so there is none to check. The quote shows it is in the paper.
In the paper
“This imbalance in data access exacerbates the performance gap, reinforcing unequal access to high-quality in-distribution data.”
§ The Leaderboard Illusion > -Charles A. E. Goodhart
plaindirect- Asserted: passes — The authors put it forward as true.
- Checkable: passes — It can be checked against evidence.
- Load-bearing: passes — The paper’s conclusions depend on it.
- Based: passes — The paper gives a reason why it holds.
It may state two separate claims as one.
In the paper
“These findings add to prior works that consistently show better corporate access to AI training data across the ecosystem (Longpre et al., 2024c;b).”
§ The Leaderboard Illusion > 4.1 Disparity in access to Chatbot Arena Data
What the sources say
- Not matchedcites Longpre et al., 2024c;b
Couldn’t be matched to a paper in Crossref, so it can’t be checked.
boostedcorrelational- Asserted: passes — The authors put it forward as true.
- Checkable: passes — It can be checked against evidence.
- Load-bearing: fails — The paper’s conclusions may not depend on it.
- Based: passes — The paper gives a reason why it holds.
Probably not a substantial claim. The paper’s conclusions may not depend on it.
- Not matched
A conclusion the paper draws from its own results — it cites no other source for it, so there is none to check. The quote shows it is in the paper.
In the paper
“In evolving task distributions, premature model removal introduces inconsistencies, breaking the BT model's transitivity assumption and distorting rankings.”
§ The Leaderboard Illusion > 5 Results: Impact of Model Deprecation on Arena Scores
plaindirect- Asserted: passes — The authors put it forward as true.
- Checkable: passes — It can be checked against evidence.
- Load-bearing: passes — The paper’s conclusions depend on it.
- Based: passes — The paper gives a reason why it holds.
It may state two separate claims as one.
In the paper
“As we have shown in Section 4.1, this can lead to overfitting and obscures meaningful progress as it makes it difficult to distinguish between models that have legitimately improved versus those that have exploited statistical shortcuts (Ying, 2019).”
§ The Leaderboard Illusion > When my information changes, I alter my conclusions. What do you do, sir? -John Maynard Keynes
What the sources say
- Not checked — no full text of the sourcecites Ying, 2019 source
plaindirect- Asserted: passes — The authors put it forward as true.
- Checkable: passes — It can be checked against evidence.
- Load-bearing: passes — The paper’s conclusions depend on it.
- Based: passes — The paper gives a reason why it holds.
It may state two separate claims as one.
A conclusion the paper draws from its own results — it cites no other source for it, so there is none to check. The quote shows it is in the paper.
In the paper
“We show that shifts in the task distribution highlight the non-stationary nature of the evaluation environment and have important implications for the stability and fairness of model rankings over time.”
§ The Leaderboard Illusion > 5 Results: Impact of Model Deprecation on Arena Scores
plaindirect- Asserted: passes — The authors put it forward as true.
- Checkable: passes — It can be checked against evidence.
- Load-bearing: passes — The paper’s conclusions depend on it.
- Based: passes — The paper gives a reason why it holds.
It may state two separate claims as one.
A conclusion the paper draws from its own results — it cites no other source for it, so there is none to check. The quote shows it is in the paper.
In the paper
“Given the stakes behind ranking highly on Chatbot Arena, it is likely that the data at a provider's disposal from Chatbot Arena is being actively leveraged by different providers to gain an advantage.”
§ The Leaderboard Illusion > 4.2 Risk of Potential Overfitting
hedgedconditional- Asserted: passes — The authors put it forward as true.
- Checkable: fails — It may be too vague to check against evidence.
- Load-bearing: fails — The paper’s conclusions may not depend on it.
- Based: passes — The paper gives a reason why it holds.
Probably not a substantial claim. It may be too vague to check against evidence. The paper’s conclusions may not depend on it.
A conclusion the paper draws from its own results — it cites no other source for it, so there is none to check. The quote shows it is in the paper.
In the paper
“While some level of model removal is inevitable (for example, models are no longer hosted on an API), preserving connectivity means ensuring that comparisons remain sufficiently distributed across active models and that transitions in and out of the pool do not isolate subsets of models from the broader comparison structure.”
§ The Leaderboard Illusion > Experiment Setup:
plaindirect- Asserted: passes — The authors put it forward as true.
- Checkable: fails — It may be too vague to check against evidence.
- Load-bearing: passes — The paper’s conclusions depend on it.
- Based: passes — The paper gives a reason why it holds.
Probably not a substantial claim. It may be too vague to check against evidence. It may state two separate claims as one.
In the paper
“In contrast, Chatbot Arena has been widely adopted in part because it allows human users to ask any questions they want, which creates a non-static test set (Don-Yehiya et al., 2024).”
§ The Leaderboard Illusion > 4.2 Risk of Potential Overfitting
What the sources say
- Not matchedcites Don-Yehiya et al., 2024
Couldn’t be matched to a paper in Crossref, so it can’t be checked.
plaindirect- Asserted: passes — The authors put it forward as true.
- Checkable: passes — It can be checked against evidence.
- Load-bearing: passes — The paper’s conclusions depend on it.
- Based: passes — The paper gives a reason why it holds.
It may state two separate claims as one.
- Not matched
A conclusion the paper draws from its own results — it cites no other source for it, so there is none to check. The quote shows it is in the paper.
In the paper
“If Ronald has had no matches with anyone who has played Tom, we can no longer infer reliably what their rankings are relative to each other.”
§ The Leaderboard Illusion > Proprietary
plain- Asserted: passes — The authors put it forward as true.
- Checkable: passes — It can be checked against evidence.
- Load-bearing: passes — The paper’s conclusions depend on it.
- Based: fails — The paper may give no reason why it holds.
Probably not a substantial claim. The paper may give no reason why it holds.
A conclusion the paper draws from its own results — it cites no other source for it, so there is none to check. The quote shows it is in the paper.
In the paper
“The user base of the Arena leans towards developers, which could result in the over-indexing of puzzles, math problems, and questions such as How many r's are there in strawberry?. 22”
§ The Leaderboard Illusion > 4.2 Risk of Potential Overfitting
hedgedconditional- Asserted: passes — The authors put it forward as true.
- Checkable: passes — It can be checked against evidence.
- Load-bearing: passes — The paper’s conclusions depend on it.
- Based: passes — The paper gives a reason why it holds.
It may state two separate claims as one.
A conclusion the paper draws from its own results — it cites no other source for it, so there is none to check. The quote shows it is in the paper.
In the paper
“It would enable the community to help in the process of continuing to improve this community benchmark.”
§ The Leaderboard Illusion > When my information changes, I alter my conclusions. What do you do, sir? -John Maynard Keynes
hedgeddirect- Asserted: passes — The authors put it forward as true.
- Checkable: fails — It may be too vague to check against evidence.
- Load-bearing: passes — The paper’s conclusions depend on it.
- Based: passes — The paper gives a reason why it holds.
Probably not a substantial claim. It may be too vague to check against evidence.
A conclusion the paper draws from its own results — it cites no other source for it, so there is none to check. The quote shows it is in the paper.
In the paper
“support more balanced and transparent evaluations”
§ The Leaderboard Illusion > When my information changes, I alter my conclusions. What do you do, sir? -John Maynard Keynes
plaindirect- Asserted: passes — The authors put it forward as true.
- Checkable: fails — It may be too vague to check against evidence.
- Load-bearing: passes — The paper’s conclusions depend on it.
- Based: passes — The paper gives a reason why it holds.
Probably not a substantial claim. It may be too vague to check against evidence.
In the paper
“To do so, we measure relative improvements on the 500 English LMArena ArenaHard prompts, an in-distribution test set published by Chatbot Arena that demonstrates exceptionally high correlation (98.6%) with human preference rankings from Chatbot Arena battles (Li et al., 2024c).”
§ The Leaderboard Illusion > 4.2 Risk of Potential Overfitting
What the sources say
- Not matchedcites Li et al., 2024c
Couldn’t be matched to a paper in Crossref, so it can’t be checked.
boostedcorrelational- Asserted: passes — The authors put it forward as true.
- Checkable: passes — It can be checked against evidence.
- Load-bearing: passes — The paper’s conclusions depend on it.
- Based: passes — The paper gives a reason why it holds.
It may state two separate claims as one.
- Not matched
In the paper
“This avoids disparities over time and a status quo where proprietary models are benefiting more from valuable and freely given human data”
§ The Leaderboard Illusion > When my information changes, I alter my conclusions. What do you do, sir? -John Maynard Keynes
What the sources say
- Not checked — no full text of the sourcecites Sambasivan et al., 2021 source
plaindirect- Asserted: passes — The authors put it forward as true.
- Checkable: passes — It can be checked against evidence.
- Load-bearing: passes — The paper’s conclusions depend on it.
- Based: passes — The paper gives a reason why it holds.
Probably not a substantial claim. It may state two separate claims as one.
A conclusion the paper draws from its own results — it cites no other source for it, so there is none to check. The quote shows it is in the paper.
In the paper
“improve confidence in leaderboard dynamics over time.”
§ The Leaderboard Illusion > When my information changes, I alter my conclusions. What do you do, sir? -John Maynard Keynes
hedgeddirect- Asserted: passes — The authors put it forward as true.
- Checkable: fails — It may be too vague to check against evidence.
- Load-bearing: passes — The paper’s conclusions depend on it.
- Based: passes — The paper gives a reason why it holds.
Probably not a substantial claim. It may be too vague to check against evidence.
A conclusion the paper draws from its own results — it cites no other source for it, so there is none to check. The quote shows it is in the paper.
In the paper
“Deviations from transitivity or a fragmented comparison graph can compromise the reliability and consistency of the strength estimates.”
§ The Leaderboard Illusion > Proprietary
plainconditional- Asserted: passes — The authors put it forward as true.
- Checkable: passes — It can be checked against evidence.
- Load-bearing: passes — The paper’s conclusions depend on it.
- Based: fails — The paper may give no reason why it holds.
Probably not a substantial claim. The paper may give no reason why it holds. It may state two separate claims as one.
A conclusion the paper draws from its own results — it cites no other source for it, so there is none to check. The quote shows it is in the paper.
In the paper
“Doing so would align the platform's operations with its methodological innovations”
§ The Leaderboard Illusion > When my information changes, I alter my conclusions. What do you do, sir? -John Maynard Keynes
hedgeddirect- Asserted: fails — The authors may not put it forward as true.
- Checkable: fails — It may be too vague to check against evidence.
- Load-bearing: fails — The paper’s conclusions may not depend on it.
- Based: passes — The paper gives a reason why it holds.
Probably not a substantial claim. The authors may not put it forward as true. It may be too vague to check against evidence. The paper’s conclusions may not depend on it.
In the paper
“Benchmarking has played a central role in shaping research priorities and incentives within the deep learning community (Koch & Peterson, 2024).”
§ The Leaderboard Illusion > 8.1 Meta-studies on the Rigor of Benchmarking in AI
What the sources say
- Not matchedcites Koch & Peterson, 2024
Couldn’t be matched to a paper in Crossref, so it can’t be checked.
plaindirect- Asserted: passes — The authors put it forward as true.
- Checkable: passes — It can be checked against evidence.
- Load-bearing: fails — The paper’s conclusions may not depend on it.
- Based: passes — The paper gives a reason why it holds.
Probably not a substantial claim. The paper’s conclusions may not depend on it.
- Not matched
A conclusion the paper draws from its own results — it cites no other source for it, so there is none to check. The quote shows it is in the paper.
In the paper
“This suggests that gains from Chatbot Arena data are highly specific and do not translate to broader generalization, raising important questions about whether leaderboard improvements reflect meaningful progress or simply overfitting to a narrow evaluation distribution.”
§ The Leaderboard Illusion > 4.2 Risk of Potential Overfitting
hedged- Asserted: passes — The authors put it forward as true.
- Checkable: passes — It can be checked against evidence.
- Load-bearing: passes — The paper’s conclusions depend on it.
- Based: passes — The paper gives a reason why it holds.
It may state two separate claims as one.
A conclusion the paper draws from its own results — it cites no other source for it, so there is none to check. The quote shows it is in the paper.
In the paper
“This violates core assumptions of the BT model, namely, that rankings reflect transitive and consistently sampled matchups, ultimately compromising the validity of inferred rankings.”
§ The Leaderboard Illusion > 5.1 Transitivity Under Changing Evaluation Conditions
plaindirect- Asserted: passes — The authors put it forward as true.
- Checkable: passes — It can be checked against evidence.
- Load-bearing: passes — The paper’s conclusions depend on it.
- Based: passes — The paper gives a reason why it holds.
It may state two separate claims as one.
In the paper
“As demonstrated by Ford Jr (1957), the maximum likelihood estimate does not exist if models can be partitioned into two nonempty subsets without comparisons between them or if all comparisons between the two groups are one-sided (i.e., one group always wins).”
§ The Leaderboard Illusion > 5.2 Sparse Battle History Risks
What the sources say
- Not matchedcites Ford Jr (1957)
Couldn’t be matched to a paper in Crossref, so it can’t be checked.
boosteddirect- Asserted: passes — The authors put it forward as true.
- Checkable: passes — It can be checked against evidence.
- Load-bearing: passes — The paper’s conclusions depend on it.
- Based: passes — The paper gives a reason why it holds.
It may state two separate claims as one.
- Not matched
A conclusion the paper draws from its own results — it cites no other source for it, so there is none to check. The quote shows it is in the paper.
In the paper
“This formulation effectively prioritizes under-evaluated and high-variance pairs, aligning sampling with the goal of rapidly reducing uncertainty in rankings.”
§ The Leaderboard Illusion > When my information changes, I alter my conclusions. What do you do, sir? -John Maynard Keynes
plaindirect- Asserted: passes — The authors put it forward as true.
- Checkable: passes — It can be checked against evidence.
- Load-bearing: passes — The paper’s conclusions depend on it.
- Based: passes — The paper gives a reason why it holds.
It may state two separate claims as one.
The paper states this without a source or data behind it here, so there is nothing to check it against. The quote shows it is in the paper.
In the paper
“The BT model assumes a sufficiently connected comparison graph to produce globally consistent rankings.”
§ The Leaderboard Illusion > 5 Results: Impact of Model Deprecation on Arena Scores
plain- Asserted: passes — The authors put it forward as true.
- Checkable: passes — It can be checked against evidence.
- Load-bearing: passes — The paper’s conclusions depend on it.
- Based: passes — The paper gives a reason why it holds.
Probably not a substantial claim.
A conclusion the paper draws from its own results — it cites no other source for it, so there is none to check. The quote shows it is in the paper.
In the paper
“Since model win-rates are task-dependent, battle outcomes change accordingly.”
§ The Leaderboard Illusion > 5.1 Transitivity Under Changing Evaluation Conditions
plaindirect- Asserted: passes — The authors put it forward as true.
- Checkable: passes — It can be checked against evidence.
- Load-bearing: passes — The paper’s conclusions depend on it.
- Based: fails — The paper may give no reason why it holds.
Probably not a substantial claim. The paper may give no reason why it holds.
A conclusion the paper draws from its own results — it cites no other source for it, so there is none to check. The quote shows it is in the paper.
In the paper
“Both trends above suggest that 1) sustained access to up-to-date prompt data and 2) the volume of sampled prompts in a given month offer a significant competitive advantage in predicting performance in subsequent months.”
§ The Leaderboard Illusion > 4.2 Risk of Potential Overfitting
hedgeddirect- Asserted: passes — The authors put it forward as true.
- Checkable: passes — It can be checked against evidence.
- Load-bearing: passes — The paper’s conclusions depend on it.
- Based: passes — The paper gives a reason why it holds.
It may state two separate claims as one.
A conclusion the paper draws from its own results — it cites no other source for it, so there is none to check. The quote shows it is in the paper.
In the paper
“Lastly, using price as a filtering criterion is problematic since it's subject to change, varies across hosting platforms, and is not inherently tied to a model's performance or utility.”
§ The Leaderboard Illusion > When my information changes, I alter my conclusions. What do you do, sir? -John Maynard Keynes
plain- Asserted: passes — The authors put it forward as true.
- Checkable: fails — It may be too vague to check against evidence.
- Load-bearing: passes — The paper’s conclusions depend on it.
- Based: passes — The paper gives a reason why it holds.
Probably not a substantial claim. It may be too vague to check against evidence. It may state two separate claims as one.
A conclusion the paper draws from its own results — it cites no other source for it, so there is none to check. The quote shows it is in the paper.
In the paper
“In this section, we show that the deprecation policy can lead to a sparse matrix and disconnected comparison graphs, which in turn distort the resulting rankings.”
§ The Leaderboard Illusion > 5.2 Sparse Battle History Risks
boosteddirect- Asserted: passes — The authors put it forward as true.
- Checkable: passes — It can be checked against evidence.
- Load-bearing: passes — The paper’s conclusions depend on it.
- Based: passes — The paper gives a reason why it holds.
It may state two separate claims as one.
A conclusion the paper draws from its own results — it cites no other source for it, so there is none to check. The quote shows it is in the paper.
In the paper
“Similarly, code-specialized models may benefit from the increasing volume of coding tasks, but only if they continue to participate in evaluation.”
§ The Leaderboard Illusion > 5.1 Transitivity Under Changing Evaluation Conditions
hedgedconditional- Asserted: passes — The authors put it forward as true.
- Checkable: passes — It can be checked against evidence.
- Load-bearing: unclear — It is unclear whether the paper’s conclusions depend on it.
- Based: passes — The paper gives a reason why it holds.
It may state two separate claims as one.
A conclusion the paper draws from its own results — it cites no other source for it, so there is none to check. The quote shows it is in the paper.
In the paper
“These probabilities reflect the models' varying strengths across tasks, mirroring the real-world observation that models excel at different types of prompts.”
§ The Leaderboard Illusion > 5.1 Transitivity Under Changing Evaluation Conditions
plaincorrelational- Asserted: passes — The authors put it forward as true.
- Checkable: passes — It can be checked against evidence.
- Load-bearing: fails — The paper’s conclusions may not depend on it.
- Based: passes — The paper gives a reason why it holds.
Probably not a substantial claim. The paper’s conclusions may not depend on it.
A conclusion the paper draws from its own results — it cites no other source for it, so there is none to check. The quote shows it is in the paper.
In the paper
“Transitivity is a critical property that allows for inferring rankings using fewer data points.”
§ The Leaderboard Illusion > Proprietary
plaindirect- Asserted: passes — The authors put it forward as true.
- Checkable: passes — It can be checked against evidence.
- Load-bearing: passes — The paper’s conclusions depend on it.
- Based: fails — The paper may give no reason why it holds.
Probably not a substantial claim. The paper may give no reason why it holds.
A conclusion the paper draws from its own results — it cites no other source for it, so there is none to check. The quote shows it is in the paper.
In the paper
“Providing transparency into the full suite of models that were tested, deprecated, and how often they were sampled against which other models, would enable the oversight and trust in the benchmark that Chatbot Arena affirms in their policies.”
§ The Leaderboard Illusion > When my information changes, I alter my conclusions. What do you do, sir? -John Maynard Keynes
hedgeddirect- Asserted: passes — The authors put it forward as true.
- Checkable: fails — It may be too vague to check against evidence.
- Load-bearing: passes — The paper’s conclusions depend on it.
- Based: passes — The paper gives a reason why it holds.
Probably not a substantial claim. It may be too vague to check against evidence.
A conclusion the paper draws from its own results — it cites no other source for it, so there is none to check. The quote shows it is in the paper.
In the paper
“In the scenario without deprecation, we observe the true rankings given that the BT model remains reliable because it reflects performance across the full history of interactions.”
§ The Leaderboard Illusion > 5.1 Transitivity Under Changing Evaluation Conditions
plaindirect- Asserted: passes — The authors put it forward as true.
- Checkable: passes — It can be checked against evidence.
- Load-bearing: passes — The paper’s conclusions depend on it.
- Based: passes — The paper gives a reason why it holds.
It may state two separate claims as one.
The paper states this without a source or data behind it here, so there is nothing to check it against. The quote shows it is in the paper.
In the paper
“live leaderboards offer several advantages over static task benchmarks, including a lower risk of data contamination and greater adaptability to evolving evaluation needs.”
§ The Leaderboard Illusion > 8.2 Human Voting-based Benchmarks
plaindirect- Asserted: passes — The authors put it forward as true.
- Checkable: passes — It can be checked against evidence.
- Load-bearing: unclear — It is unclear whether the paper’s conclusions depend on it.
- Based: passes — The paper gives a reason why it holds.
It may state two separate claims as one.
The paper states this without a source or data behind it here, so there is nothing to check it against. The quote shows it is in the paper.
In the paper
“Although dynamic, live benchmarks like Chatbot Arena significantly reduce the risk of overfitting”
§ The Leaderboard Illusion > 8.1 Meta-studies on the Rigor of Benchmarking in AI
boosteddirect- Asserted: passes — The authors put it forward as true.
- Checkable: passes — It can be checked against evidence.
- Load-bearing: passes — The paper’s conclusions depend on it.
- Based: fails — The paper may give no reason why it holds.
Probably not a substantial claim. The paper may give no reason why it holds.
None of the sources cited for this claim could be matched to a paper in Crossref, so there is nothing to check it against.
In the paper
“Commonly used benchmarks often fail to capture real-world performance, creating a gap between test scores and practical utility”
§ The Leaderboard Illusion > Quality of data and limited reproducibility.
What the sources say
- Not matchedcites Ott et al., 2022
Couldn’t be matched to a paper in Crossref, so it can’t be checked.
- Not matchedcites Parli, 2022
Couldn’t be matched to a paper in Crossref, so it can’t be checked.
plaindirect- Asserted: passes — The authors put it forward as true.
- Checkable: passes — It can be checked against evidence.
- Load-bearing: passes — The paper’s conclusions depend on it.
- Based: passes — The paper gives a reason why it holds.
It may state two separate claims as one.
- Not matched
A conclusion the paper draws from its own results — it cites no other source for it, so there is none to check. The quote shows it is in the paper.
In the paper
“As private variants are also new models, they receive high sampling weights as well.”
§ The Leaderboard Illusion > I Silent Model Deprecation: Additional Details
plaindirect- Asserted: passes — The authors put it forward as true.
- Checkable: passes — It can be checked against evidence.
- Load-bearing: passes — The paper’s conclusions depend on it.
- Based: passes — The paper gives a reason why it holds.
It may state two separate claims as one.
In the paper
“In practice, Chatbot Arena does not rely solely on a model's Arena Score for ranking.Instead, it also considers the confidence intervals associated with these scores.”
§ The Leaderboard Illusion > 9 Conclusion
What the sources say
- Not matchedcites Chiang et al., 2024
Couldn’t be matched to a paper in Crossref, so it can’t be checked.
plaincorrelational- Asserted: passes — The authors put it forward as true.
- Checkable: passes — It can be checked against evidence.
- Load-bearing: passes — The paper’s conclusions depend on it.
- Based: passes — The paper gives a reason why it holds.
It may state two separate claims as one.
- Not matched
A conclusion the paper draws from its own results — it cites no other source for it, so there is none to check. The quote shows it is in the paper.
In the paper
“These vulnerabilities raise concerns about the overall trustworthiness of Chatbot Arena.”
§ The Leaderboard Illusion > 8.2 Human Voting-based Benchmarks
plainconditional- Asserted: passes — The authors put it forward as true.
- Checkable: fails — It may be too vague to check against evidence.
- Load-bearing: fails — The paper’s conclusions may not depend on it.
- Based: passes — The paper gives a reason why it holds.
Probably not a substantial claim. It may be too vague to check against evidence. The paper’s conclusions may not depend on it.
The paper states this without a source or data behind it here, so there is nothing to check it against. The quote shows it is in the paper.
In the paper
“Human judgment has long been regarded as the gold standard for evaluating the quality of model-generated outputs.”
§ The Leaderboard Illusion > 8.2 Human Voting-based Benchmarks
plain- Asserted: passes — The authors put it forward as true.
- Checkable: passes — It can be checked against evidence.
- Load-bearing: fails — The paper’s conclusions may not depend on it.
- Based: fails — The paper may give no reason why it holds.
Probably not a substantial claim. The paper’s conclusions may not depend on it. The paper may give no reason why it holds.
None of the sources cited for this claim could be matched to a paper in Crossref, so there is nothing to check it against.
In the paper
“This phenomenon is well-studied in the theory of order statistics (see Arnold et al. (1992); David & Nagaraja (2003)).”
§ The Leaderboard Illusion > 9 Conclusion
What the sources say
- Not matchedcites Arnold et al. (1992)
Couldn’t be matched to a paper in Crossref, so it can’t be checked.
- Not matchedcites David & Nagaraja (2003)
Couldn’t be matched to a paper in Crossref, so it can’t be checked.
boosted- Asserted: passes — The authors put it forward as true.
- Checkable: passes — It can be checked against evidence.
- Load-bearing: fails — The paper’s conclusions may not depend on it.
- Based: passes — The paper gives a reason why it holds.
Probably not a substantial claim. The paper’s conclusions may not depend on it.
- Not matched
A conclusion the paper draws from its own results — it cites no other source for it, so there is none to check. The quote shows it is in the paper.
In the paper
“Their efforts have democratized access to many models and enabled a large and varied user base to weigh in on what matters in the real world for model selection.”
§ The Leaderboard Illusion > 9 Conclusion
plaindirect- Asserted: passes — The authors put it forward as true.
- Checkable: passes — It can be checked against evidence.
- Load-bearing: fails — The paper’s conclusions may not depend on it.
- Based: fails — The paper may give no reason why it holds.
Probably not a substantial claim. The paper’s conclusions may not depend on it. The paper may give no reason why it holds. It may state two separate claims as one.
A conclusion the paper draws from its own results — it cites no other source for it, so there is none to check. The quote shows it is in the paper.
In the paper
“we note that Chatbot Arena 's policy of informing model providers when testing begins and disclosing model aliases may create conditions conducive to leaderboard manipulation.”
§ The Leaderboard Illusion > 8.2 Human Voting-based Benchmarks
hedgedconditional- Asserted: passes — The authors put it forward as true.
- Checkable: passes — It can be checked against evidence.
- Load-bearing: fails — The paper’s conclusions may not depend on it.
- Based: fails — The paper may give no reason why it holds.
Probably not a substantial claim. The paper’s conclusions may not depend on it. The paper may give no reason why it holds.
A conclusion the paper draws from its own results — it cites no other source for it, so there is none to check. The quote shows it is in the paper.
In the paper
“This work demonstrates the difficulty in maintaining fair evaluations, despite best intentions.”
§ The Leaderboard Illusion > 9 Conclusion
boosted- Asserted: passes — The authors put it forward as true.
- Checkable: fails — It may be too vague to check against evidence.
- Load-bearing: passes — The paper’s conclusions depend on it.
- Based: passes — The paper gives a reason why it holds.
Probably not a substantial claim. It may be too vague to check against evidence.
What the paper did — it cites no source for this, so there is none to check. The quote shows it is in the paper.
In the paper
“To ensure a fair assessment, we only considered models that appeared in battles on days when we collected a minimum of 100 samples from Chatbot Arena.”
§ The Leaderboard Illusion > Additional information
plainn = 100- Asserted: passes — The authors put it forward as true.
- Checkable: passes — It can be checked against evidence.
- Load-bearing: passes — The paper’s conclusions depend on it.
- Based: passes — The paper gives a reason why it holds.
Probably not a substantial claim.
- Rests on an assumption: The scraped random sample is representative of all Chatbot Arena battles during the period studied.
A conclusion the paper draws from its own results — it cites no other source for it, so there is none to check. The quote shows it is in the paper.
In the paper
“This disparity underscores a significant competitive advantage for large-industry labs, making it increasingly challenging for open-source efforts and smaller institutions to match the scale and diversity of data available to proprietary model developers.”
§ The Leaderboard Illusion > G Data Access Estimation for Different Providers
plaindirect- Asserted: passes — The authors put it forward as true.
- Checkable: passes — It can be checked against evidence.
- Load-bearing: passes — The paper’s conclusions depend on it.
- Based: passes — The paper gives a reason why it holds.
It may state two separate claims as one.
- Rests on an assumption: The number of model API calls is a valid measure of the volume of data available to model providers.
A conclusion the paper draws from its own results — it cites no other source for it, so there is none to check. The quote shows it is in the paper.
In the paper
“many of these issues may have gradually emerged as the leaderboard took on outsized importance in visibility to providers.”
§ The Leaderboard Illusion > 9 Conclusion
hedgedconditional- Asserted: passes — The authors put it forward as true.
- Checkable: fails — It may be too vague to check against evidence.
- Load-bearing: fails — The paper’s conclusions may not depend on it.
- Based: fails — The paper may give no reason why it holds.
Probably not a substantial claim. It may be too vague to check against evidence. The paper’s conclusions may not depend on it. The paper may give no reason why it holds.
In the paper
“Chatbot Arena (Chiang et al., 2024) has made substantial efforts to ensure reliability and security, including malicious user detection, bot protection via Google reCAPTCHA v3, vote limits per IP address, prompt de-duplication, and other safeguards 6 .”
§ The Leaderboard Illusion > 8.2 Human Voting-based Benchmarks
What the sources say
- Not matchedcites Chiang et al., 2024
Couldn’t be matched to a paper in Crossref, so it can’t be checked.
plain- Asserted: passes — The authors put it forward as true.
- Checkable: passes — It can be checked against evidence.
- Load-bearing: fails — The paper’s conclusions may not depend on it.
- Based: passes — The paper gives a reason why it holds.
Probably not a substantial claim. The paper’s conclusions may not depend on it. It may state two separate claims as one.
- Not matched
A conclusion the paper draws from its own results — it cites no other source for it, so there is none to check. The quote shows it is in the paper.
In the paper
“Such patterns can be readily learned by today's large language models, potentially leading to overfitting on the Chatbot Arena leaderboard.”
§ The Leaderboard Illusion > H Analysis of Prompt Repetitions in Arena Data
hedgedconditional- Asserted: passes — The authors put it forward as true.
- Checkable: passes — It can be checked against evidence.
- Load-bearing: passes — The paper’s conclusions depend on it.
- Based: passes — The paper gives a reason why it holds.
It may state two separate claims as one.
A conclusion the paper draws from its own results — it cites no other source for it, so there is none to check. The quote shows it is in the paper.
In the paper
“This imbalance in data access exacerbates the performance gap, reinforcing unequal access to high-quality in-distribution data.”
§ The Leaderboard Illusion > I Silent Model Deprecation: Additional Details
plaindirect- Asserted: passes — The authors put it forward as true.
- Checkable: passes — It can be checked against evidence.
- Load-bearing: passes — The paper’s conclusions depend on it.
- Based: passes — The paper gives a reason why it holds.
It may state two separate claims as one.
The paper relies on this without support.
During LLM development, providers typically end up with multiple final candidate model variants that perform similarly overall but excel on different tasks.
“Having to pick from multiple final”
The paper relies on this without support.
A strong signal such as a clear lead on an arena-style leaderboard can significantly influence which variant a provider selects as final.
“A strong signal-such as a clear lead on an arena-style leaderboard-can significantly influence this decision, tipping the preference toward specific variants that perform best under the given evaluation framework.”
The paper relies on this without support.
Prompts from a large and diverse user base, such as Chatbot Arena users, serve as a valuable signal for modeling user interests and preferences.
“Prompts from a large and diverse user base, such as those from Chatbot Arena users, serve as a valuable signal for modeling user interests and preferences.”
The paper relies on this without support.
In practice, a provider would likely optimize the differences in the variants they are testing to maximize the signal from the Arena users.
“In practice, a provider would likely optimize the differences in the variants they are testing to maximize the signal from the Arena users.”
The authors state this as an assumption.
The distribution of Chatbot Arena prompts is constantly changing.
“However, this assumes that the distribution is constantly changing.”
The authors state this as an assumption.
Evaluation conditions remain constant for transitivity to hold.
“Assumption 1: Evaluation conditions remain constant.Transitivity relies on the assumption that evaluation conditions remain constant-that is, paired comparisons must come from a consistent set of tasks or contexts.”
The authors state this as an assumption.
The network of comparisons must be fully interconnected for BT reliability.
“Assumption 2: Network of comparisons must be fully interconnected.Every model must be linked directly or indirectly through pairwise matchups.”
The paper relies on this without support.
The scraped-random-sample is representative of battles over time on Chatbot Arena.
“We use this scraped-random-sample, which is a representative random sample over time, to answer a few critical questions:”
The paper relies on this without support.
Model self-identification reliably attributes private models to their respective providers.
“Since the identity of anonymous models is not publicly disclosed, we use model self-identification as a proxy-prompting each model directly and observing how it responds.”
The paper relies on this without support.
The classification of models into proprietary, open-weight, and open-source categories is valid.
“We group the licenses found for models available on the public leaderboard into 3 categories i.e.Proprietary, Open-Weights and Open-Source.”
The paper relies on this without support.
The number of model API calls is a valid measure of the volume of data available to model providers.
“the total no. of API calls used to represent the data available to the model providers is 5M”
The paper relies on this without support.
A model's sampling rate determines the amount of data its provider receives.
“The sampling rate determines the amount of times a model is shown to everyday users, and the amount of data a provider receives.”
The paper relies on this without support.
The scraped random sample is representative of all Chatbot Arena battles during the period studied.
“We determine the maximum sampling rate of providers based on scraped-random-sample, which is limited to the specific period during which we collected this data (January 2025 to March 2025).”
“To ensure a fair assessment, we only considered models that appeared in battles on days when we collected a minimum of 100 samples from Chatbot Arena.”
The paper relies on this without support.
The de-anonymizing prompt reliably reveals the true provider of private models.
“The table lists the private models captured in our scraped-random-sample or scraped-vision-sample, along with the number of responses revealing their identities and corresponding examples.”
“It's possible that some private models appeared in more battles, but we couldn't capture their responses to our de-anonymizing prompt due to scraping errors.”
The paper relies on this without support.
The historical-battles dataset is representative of the overall task distribution on Chatbot Arena.
“We leverage historical-battles dataset as a key resource for quantifying task distribution drift (see Figure 11):”
Self-check
Percentages, sums and reported differences re-computed from the paper’s own numbers.
Each contradiction between two passages listed here was confirmed by an independent check.
Rated minor: it would not touch a result — a value no result rests on, a p-value that stays on the same side of the significance level, or a conflict that is clerical, resolved elsewhere in the paper, or outside its own findings.
In the paper
§ The Leaderboard Illusion > 5.1 Transitivity Under Changing Evaluation Conditions
“Each of the four models participates in 1000 battles, and the resulting outcomes are used to compute initial rankings.”
§ The Leaderboard Illusion > 5.1 Transitivity Under Changing Evaluation Conditions
“• Scenario I: without deprecation.We simulate all 2000 battles across both phases, with all four models participating throughout.”
Rated minor: it would not touch a result — a value no result rests on, a p-value that stays on the same side of the significance level, or a conflict that is clerical, resolved elsewhere in the paper, or outside its own findings.
In the paper
§ The Leaderboard Illusion > 9 Conclusion
“Theorem 1 For every N ≥ 2, E[ βBest ] > E[ βk ] ⇐⇒ Var( βk ) = 0.”
§ The Leaderboard Illusion > 9 Conclusion
“If Var( β1 ) = 0, then F is a step function with a single jump (a constant distribution), and F (x) -F (x) N = 0 for all x, yielding equality.”
Citations
Cites
ImageNet: A large-scale hierarchical image database
Deng, J., Dong, W., Socher, R., Li, L.-J., Li, K., & Fei-Fei, L. (2009) · 2009 IEEE Conference on Computer Vision and Pattern Recognition · doi:10.1109/cvpr.2009.5206848 · Cited by 65,333
Scaling Laws for Neural Language Models
Kaplan, J., McCandlish, S., Henighan, T., Brown, T. B., Chess, B., Child, R., Gray, S., Radford, A., Wu, J., & Amodei, D. (2020) · arXiv · doi:10.48550/arxiv.2001.08361 · Cited by 9,550
SuperGlue: Learning Feature Matching With Graph Neural Networks
Sarlin, P.-E., DeTone, D., Malisiewicz, T., & Rabinovich, A. (2020) · IEEE Computer Society Conference on Computer Vision and Pattern Recognition/Proceedings - IEEE Computer Society Conference on Computer Vision and Pattern Recognition/Proceedings · doi:10.1109/cvpr42600.2020.00499 · Cited by 3,234
Training Language Models to Follow Instructions with Human Feedback
Ouyang, L., Wu, J., Jiang, X., Almeida, D., Wainwright, C., Mishkin, P., Zhang, C., Agarwal, S., Slama, K., Ray, A., et al. (2022) · Advances in Neural Information Processing Systems 35 · doi:10.52202/068431-2011 · Cited by 3,117
David, H. A., & Nagaraja, H. N. (2003) · Wiley series in probability and statistics · doi:10.1002/0471722162 · Cited by 2,418
An Overview of Overfitting and its Solutions
Ying, X. (2019) · Journal of Physics: Conference Series · doi:10.1088/1742-6596/1168/2/022022 · Cited by 2,352
Judging LLM-as-a-Judge with MT-Bench and Chatbot Arena
Zheng, L., Chiang, W.-L., Sheng, Y., Zhuang, S., Wu, Z., Zhuang, Y., Lin, Z., Li, Z., Li, D., Xing, E. P., et al. (2023) · arXiv · doi:10.48550/arxiv.2306.05685 · Cited by 1,888
RANK ANALYSIS OF INCOMPLETE BLOCK DESIGNS: THE METHOD OF PAIRED COMPARISONS
BRADLEY, R. A., & TERRY, M. E. (1952) · Biometrika · doi:10.1093/biomet/39.3-4.324 · Cited by 1,434
Gemma Team, Kamath, A., Ferret, J., Pathak, S., Vieillard, N., Merhej, R., Perrin, S., Matejovicova, T., Ramé, A., Rivière, M., et al. (2025) · arXiv · doi:10.48550/arxiv.2503.19786 · Cited by 1,156
Deep reinforcement learning from human preferences
Christiano, P., Leike, J., Brown, T. B., Martic, M., Legg, S., & Amodei, D. (2017) · arXiv · doi:10.48550/arxiv.1706.03741 · Cited by 1,058
Research works printed but not linked: 10
- Barry C. Arnold, N. Balakrishnan, and H. N. Nagaraja. A First Course in Order Statistics. Wiley, Hoboken, NJ, 1992.
- Mark E Glickman. Parameter estimation in large dynamic paired comparison experiments. Applied Statistics, pp. 377-394, 1999.
- Shahriar Golchin and Mihai Surdeanu. Time travel in LLMs: Tracing data contamination in large language models. In The Twelfth International Conference on Learning Representations, 2024. URL https://openreview.net/forum?id=2Rwq6c3tvr. Google. Introducing gemma 3: The most capable model you can run on a single gpu or tpu, 2025. URL https://blog.google/technology/developers/gemma-3/. Accessed: 2025-04-09.
- Donna Harman. Overview of the first trec conference. In Proceedings of the 16th annual international ACM SIGIR conference on Research and development in information retrieval, pp. 36-47, 1993.
- Dan Hendrycks, Collin Burns, Steven Basart, Andy Zou, Mantas Mazeika, Dawn Song, and Jacob Steinhardt. Measuring massive multitask language understanding. Proceedings of the Interna- tional Conference on Learning Representations (ICLR), 2021.
- David R Hunter. Mm algorithms for generalized bradley-terry models. The annals of statistics, 32 (1):384-406, 2004.
- Seungone Kim, Jamin Shin, Yejin Cho, Joel Jang, Shayne Longpre, Hwaran Lee, Sangdoo Yun, Seongjin Shin, Sungdong Kim, James Thorne, et al. Prometheus: Inducing fine-grained eval- uation capability in language models. In The Twelfth International Conference on Learning Representations, 2023.
- Tianle Li, Wei-Lin Chiang, Evan Frick, Lisa Dunlap, Tianhao Wu, Banghua Zhu, Joseph E Gon- zalez, and Ion Stoica. From crowdsourced data to high-quality benchmarks: Arena-hard and benchbuilder pipeline. arXiv preprint arXiv:2406.11939, 2024c. · arXiv
- Shayne Longpre, Stella Biderman, Alon Albalak, Hailey Schoelkopf, Daniel McDuff, Sayash Kapoor, Kevin Klyman, Kyle Lo, Gabriel Ilharco, Nay San, Maribeth Rauh, Aviya Skowron, Bertie Vid- gen, Laura Weidinger, Arvind Narayanan, Victor Sanh, David Ifeoluwa Adelani, Percy Liang, Rishi Bommasani, Peter Henderson, Sasha Luccioni, Yacine Jernite, and Luca Soldaini. The re- sponsible foundation model development cheatsheet: A review of tools & resources. Transactions on Machine Learning Research, 2024a. ISSN 2835-8856. URL https://openreview.net/forum ?id=tH1dQH20eZ. Survey Certification.
- Manley Roberts, Himanshu Thakur, Christine Herlihy, Colin White, and Samuel Dooley. To the cutoff... and beyond? a longitudinal perspective on llm data contamination. In The Twelfth International Conference on Learning Representations, 2023.
Cited by
Sorted by citations
International AI Safety Report 2026Preprint
Bengio, Y., Clare, S., Prunkl, C., Andriushchenko, M., Bucknall, B., Murray, M., Bommasani, R., Casper, S., Davidson, T., Douglas, R., et al. (2026) · arXiv (Cornell University) · doi:10.48550/arxiv.2602.21012 · Cited by 73
Self-citationSynthesizing scientific literature with retrieval-augmented language models
Asai, A., He, J., Shao, R., Shi, W., Singh, A., Chang, J. C., Lo, K., Soldaini, L., Feldman, S., D’Arcy, M., et al. (2026) · Nature · doi:10.1038/s41586-025-10072-4 · Cited by 38
Scaling Laws For Scalable Oversight
Engels, J., Baek, D. D., Kantamneni, S., & Tegmark, M. (2025) · neural information processing systems · doi:10.52202/085713-3254 · Cited by 38
The 2025 Foundation Model Transparency Index
Wan, A., Klyman, K., Kapoor, S., Maslej, N., Longpre, S., Xiong, B., Liang, P., & Bommasani, R. (2026) · SuperIntelligence - Robotics - Safety & Alignment · doi:10.70777/si.v2i4.17165 · Cited by 39
Self-citationEvaluating LLM Metrics Through Real-World CapabilitiesPreprint
Miller, J. K., & Tang, W. (2025) · arXiv (Cornell University) · doi:10.48550/arxiv.2505.08253 · Cited by 29
HeuriGym: An Agentic Benchmark for LLM-Crafted Heuristics in Combinatorial OptimizationPreprint
Chen, H., Wang, Y., Cai, Y., Hu, H., Li, J., Huang, S., Deng, C., Liang, R., Kong, S., Ren, H. M., et al. (2025) · arXiv (Cornell University) · doi:10.48550/arxiv.2506.07972 · Cited by 23
STREAM (ChemBio): A Standard for Transparently Reporting Evaluations in AI Model ReportsPreprint
McCaslin, T., Alaga, J., Nedungadi, S., Donoughe, S., Reed, T., Bommasani, R., Painter, C., & Righetti, L. (2025) · arXiv (Cornell University) · doi:10.48550/arxiv.2508.09853 · Cited by 21
Artificial Intelligence Index Report 2026Preprint
Sajadieh, S., Fattorini, L., Perrault, R., Gil, Y., Parli, V., Santarlasci, L., Pava, J., Maslej, N., Altman, R. B., Brynjolfsson, E., et al. (2026) · arXiv (Cornell University) · doi:10.48550/arxiv.2606.15708 · Cited by 20
Moëll, B., Farestam, F., & Beskow, J. (2025) · Frontiers in Artificial Intelligence · doi:10.3389/frai.2025.1557920 · Cited by 15
Autonomous Research Agents: A Survey of AI Scientists and the Verification GapPreprint
Ding, T., Nannapaneni, A., Liu, B., & Zhang, L. (2026) · arXiv (Cornell University) · doi:10.48550/arxiv.2608.05179 · Cited by 16
One Tokenizer To Rule Them All: Emergent Language Plasticity via Multilingual Tokenizers
Abagyan, D., Salamanca, A., Cruz-Salinas, A. F., Cao, K., Lin, H., Locatelli, A., Fadaee, M., Üstün, A., & Hooker, S. (2026) · Proceedings of the conference - Association for Computational Linguistics. Meeting · doi:10.18653/v1/2026.acl-long.141 · Cited by 13
Self-citationRating Roulette: Self-Inconsistency in LLM-As-A-Judge Frameworks
Haldar, R., & Hockenmaier, J. (2025) · Findings of the Association for Computational Linguistics: EMNLP 2025 · doi:10.18653/v1/2025.findings-emnlp.1361 · Cited by 11
Neither Valid nor Reliable? Investigating the Use of LLMs as Judges
Chehbouni, K., Haddou, M., Cheung, J. C., & Farnadi, G. (2025) · Advances in Neural Information Processing Systems 38 · doi:10.52202/085713-3029 · Cited by 10
A Single Character can Make or Break Your LLM EvalsPreprint
Su, J., Zhang, J., Ullrich, K., Bottou, L., & Ibrahim, M. (2025) · arXiv (Cornell University) · doi:10.48550/arxiv.2510.05152 · Cited by 9
Completion $\neq$ Collaboration: Scaling Collaborative Effort with AgentsPreprint
Shen, S. Z., Chen, V., Gu, K., Ross, A., Ma, Z., Ross, J., Gu, A., Si, C., Chi, W., Peng, A., et al. (2025) · arXiv (Cornell University) · doi:10.48550/arxiv.2510.25744 · Cited by 9
Visually Prompted Benchmarks Are Surprisingly FragilePreprint
Feng, H., Lian, L., Dunlap, L., Shu, J., Wang, X., Wang, R., Darrell, T., Suhr, A., & Kanazawa, A. (2025) · arXiv (Cornell University) · doi:10.48550/arxiv.2512.17875 · Cited by 8
Evaluating the Unseen Capabilities: How Many Theorems Do LLMs Know?Preprint
Li, X., Xin, J., Long, Q., & Su, W. J. (2025) · arXiv (Cornell University) · doi:10.48550/arxiv.2506.02058 · Cited by 7
EvalCards: A Framework for Standardized Evaluation ReportingPreprint
Dhar, R., Villegas, D. S., Karamolegkou, A., Schiavone, A., Yuan, Y., Chen, X., Li, J., Frank, S., Grazia, L. D., Swain, M., et al. (2025) · arXiv (Cornell University) · doi:10.48550/arxiv.2511.21695 · Cited by 7
UQ: Assessing Language Models on Unsolved QuestionsPreprint
Nie, F., Liu, K. Z., Wang, Z., Sun, R., Liu, W., Shi, W., Yao, H., Zhang, L., Ng, A. Y., Zou, J., et al. (2025) · arXiv (Cornell University) · doi:10.48550/arxiv.2508.17580 · Cited by 7
Self-citationExpanding External Access to Frontier AI Models for Dangerous Capability Evaluations
Charnock, J., Tlaie, A., O'Brien, K., Casper, S., & Homewood, A. (2026) · ACM Conference on Fairness, Accountability, and Transparency (FAccT) · doi:10.1145/3805689.3812365 · Cited by 6
Position: LLM Watermarking Should Align Stakeholders’ Incentives for Practical Adoption
Liu, Y., Zhao, X., Song, D. X., Wornell, G. W., & Bu, Y. (2026) · Findings of the Association for Computational Linguistics: ACL (Findings of ACL) · doi:10.18653/v1/2026.findings-acl.1290 · Cited by 6
MELAC: Massive Evaluation of Large Language Models with Alignment of Culture in Persian LanguagePreprint
Farsi, F., Aghababaloo, F., Motlagh, S. S., Ghofrani, P., SadraeiJavaheri, M., Bali, S., Shabani, A., Bijary, F., Zamaninejad, G., Salehoof, A., et al. (2025) · arXiv (Cornell University) · doi:10.48550/arxiv.2508.00673 · Cited by 5
Emergence WebVoyager: Toward Consistent and Transparent Evaluation of (Web) Agents in The WildPreprint
Akkil, D., Allaham, M., Raj, A., Abuelsaad, T., & Kokku, R. (2026) · arXiv (Cornell University) · doi:10.48550/arxiv.2603.29020 · Cited by 5
In Benchmarks We Trust ... Or Not?
Gevers, I., Marez, V. D., Nooten, J. V., Lemmens, J., Kosar, A., Lotfi, E., Banar, N., Fivez, P., Bruyne, L. D., & Daelemans, W. M. P. (2025) · Conference on Empirical Methods in Natural Language Processing (EMNLP) · doi:10.18653/v1/2025.emnlp-main.1208 · Cited by 3
On Evaluating LLM Alignment by Evaluating LLMs as Judges
Liu, Y., Liu, P., & Cohan, A. (2025) · neural information processing systems · doi:10.52202/085713-5051 · Cited by 3
The Flaw of Averages: Measuring Benchmark-Level Distributional Robustness
Uzunoğlu, A., Li, T., & Khashabi, D. (2026) · Conference on Empirical Methods in Natural Language Processing (EMNLP) · doi:10.18653/2026.emnlp-main.1895 · Cited by 3
Benchmarking AI: Toward Inclusive Evaluation of Language Models
Jovanovic, M., & Campbell, M. (2025) · Computer · doi:10.1109/mc.2025.3575880 · Cited by 3
Eye of Judgement: Dissecting the Evaluation of Russian-speaking LLMs with POLLUXPreprint
Martynov, N., Mordasheva, A., Gorbetskiy, D., Astafurov, D., Isaeva, U., Basyrova, E., Skachkov, S., Berestova, V., Ivanov, N., Zanina, V., et al. (2025) · arXiv (Cornell University) · doi:10.48550/arxiv.2505.24616 · Cited by 3
A Protocol for Trustless Verification Under UncertaintyPreprint
Shi, D., & Joo, K. (2025) · arXiv (Cornell University) · doi:10.48550/arxiv.2507.00631 · Cited by 3
Termignon, L., Zilinskas, S., Pélissier, H., Barrot, A., Chesnais, N., & Gavoty, E. (2026) · arXiv (Cornell University) · doi:10.48550/arxiv.2602.06669 · Cited by 3
Leaderboard Incentives: Model Rankings under Strategic Post-TrainingPreprint
Chen, Y., Zhang, G., & Hardt, M. (2026) · arXiv (Cornell University) · doi:10.48550/arxiv.2603.08371 · Cited by 3
MedArena: Comparing LLMs for Medicine-in-the-Wild Clinician PreferencesPreprint
Wu, E., Wu, K., Hom, J., Yi, P. H., Zhang, A., Lozano, A., Nirschl, J., Tangney, J., Byram, K., Dymm, B., et al. (2026) · arXiv (Cornell University) · doi:10.48550/arxiv.2603.15677 · Cited by 3
Strategic Candidacy in Generative AI ArenasPreprint
Hays, C., Li, R., Flanigan, B., & Raghavan, M. (2026) · arXiv (Cornell University) · doi:10.48550/arxiv.2603.26891 · Cited by 3
Pluralistic LeaderboardsPreprint
Haghtalab, N., Procaccia, A. D., Shao, H., Wang, S. L., & Yang, K. (2026) · arXiv (Cornell University) · doi:10.48550/arxiv.2606.02547 · Cited by 3
Ren, X., Zhai, W., Pu, T., Zhu, Y., Zhu, Y., Wei, H., & Zhao, B. (2026) · arXiv (Cornell University) · doi:10.48550/arxiv.2608.02442 · Cited by 3
Quantifying Uncertainty in Error Consistency: Towards Reliable Behavioral Comparison of Classifiers
Klein, T., Meyen, S., Brendel, W., Wichmann, F. A., & Meding, K. (2025) · neural information processing systems · doi:10.52202/085713-1702 · Cited by 2
Human at the Center: A Framework for Human‐Driven AI Development
Hu, D., Acosta-Navas, D., Gaube, S., Mozannar, H., Taylor, M. E., Dvijotham, K., & Bondi, E. (2025) · AI Magazine · doi:10.1002/aaai.70043 · Cited by 2
Active Evaluation of General Agents: Problem Definition and Comparison of Baseline Algorithms
Lanctot, M., Larson, K. S., Gemp, I., & Kaisers, M. (2026) · Adaptive Agents and Multi-Agents Systems · doi:10.65109/pubn4692 · Cited by 2
There is no free benchmark: An institutional view of legal AI benchmarking
Guha, N., Zhang, A. K., Tsang, C., Manning, C. D., Nyarko, J., & Ho, D. E. (2026) · Proceedings of the National Academy of Sciences · doi:10.1073/pnas.2509757122 · Cited by 3
Dynamically Allocating Evaluation Effort for Model Ranking
Zouhar, V., Kreutzer, J., Lavie, A., Kocmi, T., Post, M., Bojar, O., & Sachan, M. (2026) · Findings of the Association for Computational Linguistics: EMNLP (Findings of EMNLP) · doi:10.18653/2026.findings-emnlp.360 · Cited by 2
A Systematic Review of LLM Advancements from GPT-3 to Reasoning Agents
Nykonenko, A. (2025) · Artificial Intelligence · doi:10.15407/jai2025.03.032 · Cited by 2
Reward Models are Metrics in a Trench CoatPreprint
Gehrmann, S. (2025) · arXiv (Cornell University) · doi:10.48550/arxiv.2510.03231 · Cited by 2
Living Synthetic Benchmarks: A Neutral and Cumulative Framework for Simulation StudiesPreprint
Bartos̆, F., Pawel, S., & Siepe, B. S. (2025) · arXiv (Cornell University) · doi:10.48550/arxiv.2510.19489 · Cited by 2
Towards a Large Physics BenchmarkPreprint
Barman, K. G., Caron, S., Hasibi, F., Shalugin, E. D., Marcet, Y., Otte, J., de Regt, H. W., & Moody, M. (2025) · arXiv (Cornell University) · doi:10.48550/arxiv.2507.21695 · Cited by 2
CapBencher: Give Your LLM Benchmark a Built-in Alarm for Test-Set OverfittingPreprint
Ishida, T., Lodkaew, T., & Yamane, I. (2025) · arXiv (Cornell University) · doi:10.48550/arxiv.2505.18102 · Cited by 2
Unpacking Human Preference for LLMs: Demographically Aware Evaluation with the HUMAINE FrameworkPreprint
Petrova, N., Gordon, A., & Blindow, E. (2026) · arXiv (Cornell University) · doi:10.48550/arxiv.2603.04409 · Cited by 2
LLM Olympiad: Why Model Evaluation Needs a Sealed ExamPreprint
Cruz, J. C. B., & Aji, A. F. (2026) · arXiv (Cornell University) · doi:10.48550/arxiv.2603.23292 · Cited by 2
LLM Evaluation as Tensor Completion: Low Rank Structure and Semiparametric EfficiencyPreprint
Li, J., Simchi‐Levi, D., & Sun, W. W. (2026) · arXiv (Cornell University) · doi:10.48550/arxiv.2604.05460 · Cited by 2
On Challenges in Evaluation Methodology: A ReviewPreprint
Dhar, R., Peng, Q., & Søgaard, A. (2026) · arXiv (Cornell University) · doi:10.48550/arxiv.2604.25923 · Cited by 2
K-Bench: measuring model performance on real scientific agent requestsPreprint
Brueckner, A., Patel, D., He, Y., & Kassis, T. (2026) · arXiv (Cornell University) · doi:10.48550/arxiv.2608.21601 · Cited by 2
Agent Evaluation Reliability: More Tasks Won't (Always) Fix An Agent LeaderboardPreprint
Hardy, M., Azam, R., Reuel, A., Kochenderfer, M. J., & Koyejo, S. (2026) · arXiv (Cornell University) · Cited by 2
Self-citationQuantifying construct validity in large language model evaluations
Kearns, R. O. (2026) · arXiv · Cited by 1
Exploiting Leaderboards for Large-Scale Distribution of Malicious Models
Suri, A., Chaudhari, H., Peng, Y., Naseh, A., Oprea, A., & Houmansadr, A. (2026) · IEEE Symposium on Security and Privacy (S&P) · doi:10.1109/sp63933.2026.00044 · Cited by 1
The Progress Illusion: Revisiting meta-evaluation standards of LLM evaluators
Xu, T. R., Gaur, V., Leqi, L., & Goyal, T. (2025) · Findings of the Association for Computational Linguistics: EMNLP (Findings of EMNLP) · doi:10.18653/v1/2025.findings-emnlp.1036 · Cited by 1
Boughorbel, S., Dalvi, F., Durrani, N., & Hawasly, M. (2025) · Conference on Empirical Methods in Natural Language Processing (EMNLP) · doi:10.18653/v1/2025.emnlp-main.1598 · Cited by 1
Model Consistency as a Cheap yet Predictive Proxy for LLM Elo Scores
Ramaswamy, A., Demeure, N., & Rrapaj, E. (2025) · Conference on Empirical Methods in Natural Language Processing (EMNLP) · doi:10.18653/v1/2025.emnlp-main.1534 · Cited by 1
Scaling Collaborative Effort with Agents
Shen, S. Z., Chen, V., Gu, K., Ross, A., Ma, Z., Ross, J., Gu, A., Si, C., Chi, W., Peng, A., et al. (2026) · Findings of the Association for Computational Linguistics: ACL (Findings of ACL) · doi:10.18653/v1/2026.findings-acl.595 · Cited by 1
Zheng, J.-S., Xuan, R., Qin, B., He, Z., Tongshuai.ren, T. R., Li, X., Yao, J.-G., & Yang, X. (2025) · Proceedings of the conference - Association for Computational Linguistics. Meeting · doi:10.18653/v1/2025.acl-demo.56 · Cited by 1
Emergent evaluation hubs in a decentralizing large language model ecosystemPreprint
Cebrián, M., Kito, T., & Fernandez, R. C. (2025) · arXiv (Cornell University) · doi:10.48550/arxiv.2510.01286 · Cited by 1
Deprecating Benchmarks: Criteria and FrameworkPreprint
Joaquin, A. S., Gipiškis, R., Staufer, L., & Gil, A. (2025) · arXiv (Cornell University) · doi:10.48550/arxiv.2507.06434 · Cited by 1
Branching Out: Broadening AI Measurement and Evaluation with Measurement TreesPreprint
Greenberg, C. S., Hall, P., Jensen, T., Greene, K., & Amironesei, R. (2025) · arXiv (Cornell University) · doi:10.48550/arxiv.2509.26632 · Cited by 1
Expanding the AI evaluation toolbox with statistical models
Keller, A., Kwegyir-Aggrey, K., Steed, R., Rao, A., Sharp, J. L., & Bergman, A. S. (2026) · doi:10.6028/nist.ai.800-3 · Cited by 1
Reflections and New Directions for Human-Centered Large Language ModelsPreprint
Ziems, C., Zhao, D., Wang, R., Jörke, M., Rushdi, A., Deepak, A., Yu, S., Agarwal, A., Agarwal, H., Aránguiz-Dias, G., et al. (2026) · arXiv (Cornell University) · doi:10.48550/arxiv.2605.06901 · Cited by 1
How Hard is it to Rig a Benchmark? A Social Choice Analysis of Leaderboard RobustnessPreprint
Gordienko, P., Schollmeyer, G., Kreuter, F., & Jansen, C. (2026) · arXiv (Cornell University) · doi:10.48550/arxiv.2605.23628 · Cited by 1
Balance of Benchmarks: Semantic Density Reweighting for Task-Conditioned Model ComparisonPreprint
Lin, J.-K., & Lin, H.-Y. (2026) · arXiv (Cornell University) · doi:10.48550/arxiv.2608.30044 · Cited by 1
How Sensitive Are LLM Leaderboard Claims to Hidden Model Selection?Preprint
Yang, C., & Chen, J. (2026) · arXiv (Cornell University) · doi:10.48550/arxiv.2609.28177 · Cited by 1
The AI Evaluation EcosystemPreprint
Dave, Y., Truong, S., Wang, S., & Koyejo, S. (2026) · arXiv (Cornell University) · doi:10.48550/arxiv.2610.09296 · Cited by 1
Self-citationIs Word2Vec Dead for Topic Modeling? A Case Study on Hospitality Opinion Mining
Azaïs, M.-A., Guillaume, J., & Coustaty, M. (2025) · Communications in computer and information science · doi:10.1007/978-3-032-06136-2_11
Beyond Ordinal Preferences: Why Alignment Needs Cardinal Human FeedbackPreprint
Whitfill, P., & Slocum, S. (2025) · arXiv (Cornell University) · doi:10.48550/arxiv.2508.08486
Strüver, N. (2025) · Platforms & Society · doi:10.1177/29768624251399288
EigenBench: A Comparative Behavioral Measure of Value AlignmentPreprint
Chang, J., Piff, L., Sana, S., Li, J. X., & Levine, L. (2025) · arXiv (Cornell University) · doi:10.48550/arxiv.2509.01938
Mirror, Mirror on the Wall -- Which is the Best Model of Them All?Preprint
Sayed, D., & Schuldt, H. (2025) · arXiv (Cornell University) · doi:10.48550/arxiv.2512.02043
Usability Evaluation of the Local Large Language Models
Kivimäki, T. (2025) · UTUPub (University of Turku)
Inclusion Arena: An Open Platform for Evaluating Large Foundation Models with Real-World AppsPreprint
Wang, K., He, H., Liu, L., Liang, R., Lan, Z., & Li, J. (2025) · arXiv (Cornell University) · doi:10.48550/arxiv.2508.11452
Gaming the Arena: AI Model Evaluation and the Viral Capture of AttentionPreprint
Hind, S. (2025) · arXiv (Cornell University) · doi:10.48550/arxiv.2512.15252
Bhattarai, K., Keloth, V. K., Wright, D., Loza, A. J., Ren, Y., & Xu, H. (2026) · arXiv (Cornell University) · doi:10.48550/arxiv.2601.12632
Biological risk and the AI capability shift
Turner, S. D. (2026) · doi:10.59350/zp9qy-3gg73
The Benchmark Illusion: How Bounded AI Performance Becomes Unsupported Institutional ProofPreprint
Devin, A. (2026) · SSRN Electronic Journal · doi:10.2139/ssrn.6135667
K-Sort Eval: Efficient Preference Evaluation for Visual Generation via Corrected VLM-as-a-JudgePreprint
Li, Z., Li, J., Liu, X., Zhao, W., Du, P., Zhou, K., Gu, Q., You, Y., Dong, Z., & Keutzer, K. (2026) · arXiv (Cornell University) · doi:10.48550/arxiv.2602.09411
A Theoretical Framework for Adaptive Utility-Weighted BenchmarkingPreprint
Waggoner, P. (2026) · arXiv (Cornell University) · doi:10.48550/arxiv.2602.12356
InterPol: De-anonymizing LM Arena via Interpolated Preference Learning
Cho, M., & Kim, J. (2026) · Conference on Empirical Methods in Natural Language Processing (EMNLP) · doi:10.18653/2026.emnlp-main.1121
MELAC: Massive Evaluation of Large Language Models with Alignment of Culture in Persian Language
Farsi, F., Aghababaloo, F., Motlagh, S. S., Ghofrani, P., SadraeiJavaheri, M., Bali, S., Shabani, A. H., Bijary, F., Zamaninejad, G., Salehoof, A., et al. (2025) · International Joint Conference on Natural Language Processing and Conference of the Asia-Pacific Chapter of the Association for Computational Linguistics (IJCNLP-AACL) · doi:10.18653/v1/2025.ijcnlp-long.105
Dynamic Normativity: Learning Human Preferences
Corrêa, N. K. (2026) · The International library of ethics, law and technology · doi:10.1007/978-3-032-22150-6_5
Making GenAI valuable: Benchmarks, singularities, and the enrichment economy
Aradau, C., & Blanke, T. (2026) · Big Data & Society · doi:10.1177/20539517261451463
Yuming, Huang, Liu, Y., Ding, P., Wang, L., & Wan, J. (2026) · arXiv (Cornell University) · doi:10.48550/arxiv.2605.27914
Validity Threats for Foundation Model ResearchPreprint
König, G., Pawelczyk, M., Ulrike Von Luxburg, A., & Bordt, S. (2026) · arXiv (Cornell University) · doi:10.48550/arxiv.2606.05029
Don't Trust the Process: When Verifiability Undermines AI Accountability
Paris, T., Moon, A., & Guo, J. (2026) · ACM Conference on Fairness, Accountability, and Transparency (FAccT) · doi:10.1145/3805689.3812373
Cabrera, L. M., D'Arcy, J., & Saxton-Knight, I. (2026) · Workshop on Evaluating Evaluations (EvalEval) · doi:10.18653/v1/2026.evaleval-1.20
Progressive Disclosure for LLM-Maintained Wiki Knowledge Bases: a Preregistered AblationPreprint
Cochran, T. O. (2026) · arXiv (Cornell University) · doi:10.48550/arxiv.2607.04576
Shilov, E. (2026) · arXiv (Cornell University) · doi:10.48550/arxiv.2607.06411
Wang, Z. (2026) · Aston Publications Explorer (Aston University)
Li, K., Gao, J., & Wang, D. (2026) · arXiv (Cornell University) · doi:10.48550/arxiv.2607.24063
ChaosAthena: A Framework to Compare Gen AI Model States - A Post-Training Quantization Case Study
Vaz, F. L. (2026) · Portuguese National Funding Agency for Science, Research and Technology (RCAAP Project by FCT)
Reducing Manual Intervention in Deep Learning
Zhang, M. R. (2026) · TSpace (University of Toronto)
Turning Domain Expertise into Multi-Dimensional Evaluation of Biomedical AI with KareninaPreprint
Carli, F., Rusina, P. V., Ai, L., Küchenhoff, L., To, P. K. P., McDonagh, E. M., Lobentanzer, S., Petroni, F., Dugourd, A. J. F., Ochoa, D., et al. (2026) · bioRxiv (Cold Spring Harbor Laboratory) · doi:10.64898/2026.09.01.748513
MESA: Requirements-Oriented Review of AI Benchmarks as Measurement Instruments
Raposo, V., & Alwidian, S. (2026) · IEEE International Requirements Engineering Conference Workshops (REW) · doi:10.1109/rew72749.2026.00076
Responsible Language Model Design for Complex Populations
Fleisig, E. (2026) · eScholarship (California Digital Library)
LEGIT: Credentialing Protocol for Trustworthy AI Agent MarketplacesPreprint
Drew, S., & Zhou, J. (2026) · arXiv (Cornell University) · doi:10.48550/arxiv.2609.21325
Rai, S. (2026) · SSRN Electronic Journal · doi:10.2139/ssrn.7503218
Whose Facts Count? A Culturally Responsive Audit of LLM Evaluation BenchmarksPreprint
Zahra, F. T., Sk., M. S. I., & Chung, R. (2026) · arXiv (Cornell University)
Metadata
- Authors
- Singh, S., Nan, Y., Wang, A., D'Souza, D., Kapoor, S., Üstün, A., Koyejo, S., Deng, Y., Longpre, S., Smith, N. A., Ermis, B., Fadaee, M., & Hooker, S.
- Affiliations
- Cohere (Canada) (US)
- Princeton University (US)
- Stanford University (US)
- University of Waterloo (CA)
- Massachusetts Institute of Technology (US)
- University of Washington (US)
- Venue
- arXiv
- Publisher
- arXiv
- Published
- 2025
- Pages
- 86910-86964
- ISSN
- 1049-5258 (ISSN-L)
- arXiv
- 2504.20879
- OpenAlex
- W4417172194
- Semantic Scholar
- dc3b7ca920f25223101ba36227a894d37c238df1
- Cited by
- 108
- References
- 45
- Citations by year
- 2026: 66 · 2025: 42
- FWCI
- 39.24
- Type
- conference paper
- Language
- en
- Open access
- green
- arxiv.org
- Licence
- Locations
- neural information processing systems (publishedVersion)
- arXiv (Cornell University) (submittedVersion, cc-by-sa)
- arXiv (Cornell University)
- Topics
- Physical Sciences › Computer Science › Artificial Intelligence › Ethics and Social Impacts of AI
- Physical Sciences › Computer Science › Artificial Intelligence › Topic Modeling
- Physical Sciences › Computer Science › Artificial Intelligence › Natural Language Processing Techniques
- Keywords
- Chatbot Arena, AI benchmarking, LLM evaluation, assessment fairness, large language models
About these checks
Registry, retraction, Cites and statistics results are computed, not judged, with one exception: a printed reference that no index lists is read once by a model before it counts as a citation error. Claims are extracted by a model and kept only when their quote appears verbatim in the text; each cited source is then checked, with a model’s help, for whether it says what the claim relies on. Those verdicts can be wrong — read the claim’s quote and the cited source before relying on one.
A language model drew the claims from the paper on 2026-11-08, under version 3 of the claim definition (model deepseek-v4.1-flash, prompt extract-v3).
A second model labelled each claim on 2026-11-08 (model jev-1.13-20260917, definition revision gold-guideline-v0.2).
Cited sources are checked with a language model’s help (gpt-6-sol).
Statistics and arithmetic are recomputed, not judged.
Confidence bands are shown only for fields calibrated on our annotated test set. None is calibrated yet, so no band is shown.
What counts as a claim ›How we measure confidence ›How we check this ›
Are you an author, or do you see a problem with this page? Request a review
