

The DOI matches its Crossref record; 49 of the 52 references it cites were found in a registry or an index.
Significant increase of surface ozone at a rural site, north of eastern China
Open accessPublished version of a preprint
Abstract
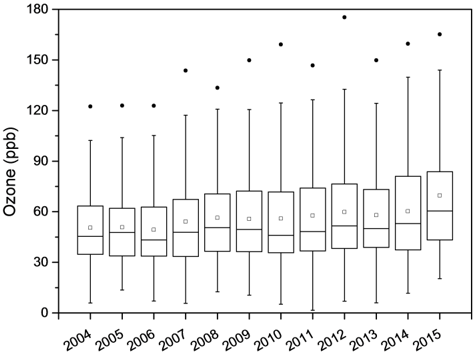
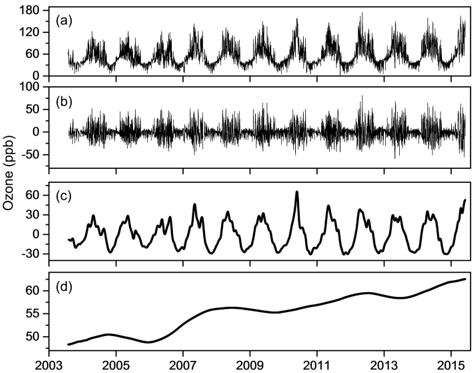
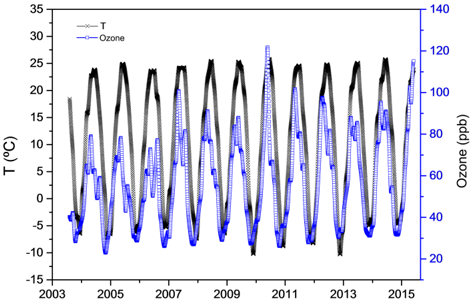
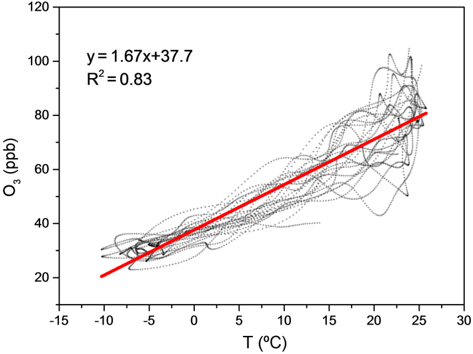
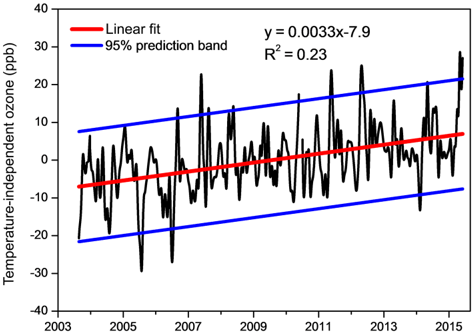
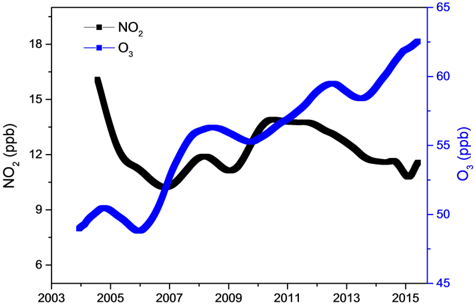
Abstract. Ozone pollution has become one of the top environmental concerns in eastern China. Quantifying temporal trend of surface ozone concentrations is very meaningful to assess the impacts of the anthropogenic precursor reductions and the effects of emission control strategies. The level of surface ozone is impacted by both emissions of precursors and meteorological conditions. In order to examine the variation trend of ozone from 2003 to 2015 in Shangdianzi regional atmosphere background station, the modified KZ filter method was performed in this study to remove the influence of meteorological fluctuations on ozone concentrations. Results reveal that the short-term component, seasonal component and long-term component of ozone account for 36.4, 57.6 and 2.2 % of the total variance, respectively. The long-term trend shows that the surface daily maximum 8-h O3 has undergone a significant increase during 2003–2015, with a rate of 1.1 ppb yr−1. We find that the increase was completely resulted from the change of the emissions when the influence of the meteorological factors was eliminated. Furthermore, the variation of NO2 indicated that VOCs seemed to play more important role in the increase trend of the surface ozone.
Overview
The claims and statistics of this paper haven’t been checked yet.
Run the check — free, no account needed. It reads the open-access text and checks the sources it cites.
Integrity signals
Registry
Cites
Statistics
Figures
Verification
Claims the paper makes
The claims and statistics of this paper haven’t been checked yet.
Run the check — free, no account needed. It reads the open-access text and checks the sources it cites.
Claims other papers make about this one
Each is checked against this paper’s own text: does it say what the citing paper says it does?
In the citing paper
“observations made at a rural site (Dadianzi) 100 km northeast Beijing showed a steady increase in annual averages of the 8-h daily max ozone concentrations from 2004 to 2015 (13).”
From Ozone pollution: A Major health hazard worldwide (2019) · cites this paper as [13]
Self-check
Percentages, sums and reported differences re-computed from the paper’s own numbers.
The self-check needs the paper’s full text.
Citations
Cites
A Pacific Interdecadal Climate Oscillation with Impacts on Salmon Production
Mantua, N. J., Hare, S. R., Zhang, Y., Wallace, J. M., & Francis, R. C. (1997) · Bulletin of the American Meteorological Society · doi:10.1175/1520-0477(1997)078 · Cited by 7,180
Monks, P. S., Archibald, A. T., Colette, A., Cooper, O. R., Coyle, M., Derwent, R. G., Fowler, D., Granier, C., Law, K. S., Mills, G., et al. (2015) · Atmospheric chemistry and physics · doi:10.5194/acp-15-8889-2015 · Cited by 1,720
An Asian emission inventory of anthropogenic emission sources for the period 1980–2020
Ohara, T., Akimoto, H., Kurokawa, J., Horii, N., Yamaji, K., Yan, X., & Hayasaka, T. (2007) · Atmospheric chemistry and physics · doi:10.5194/acp-7-4419-2007 · Cited by 1,411
Increase in tropospheric nitrogen dioxide over China observed from space
Richter, A., Burrows, J. P., Nüß, H., Granier, C., & Niemeier, U. (2005) · Nature · doi:10.1038/nature04092 · Cited by 1,332
Granier, C., Bessagnet, B., Bond, T. C., d'Angiola, A., van der Gon, H. D., Frost, G. J., Heil, A., Kaiser, J. W., Kinne, S., Klimont, Z., et al. (2011) · Climatic Change · doi:10.1007/s10584-011-0154-1 · Cited by 906
Nobre, P., & Srukla, J. (1996) · Journal of Climate · doi:10.1175/1520-0442(1996)009 · Cited by 893
Kurokawa, J., Ohara, T., Morikawa, T., Hanayama, S., Janssens‐Maenhout, G., Fukui, T., Kawashima, K., & Akimoto, H. (2013) · Atmospheric chemistry and physics · doi:10.5194/acp-13-11019-2013 · Cited by 855
Global distribution and trends of tropospheric ozone: An observation-based review
Cooper, O. R., Parrish, D. D., Ziemke, J. R., Balashov, N., Cupeiro, M., Galbally, I. E., Gilge, S., Horowitz, L. W., Jensen, N. R., Lamarque, J., et al. (2014) · Elementa Science of the Anthropocene · doi:10.12952/journal.elementa.000029 · Cited by 724
Increasing surface ozone concentrations in the background atmosphere of Southern China, 1994–2007
Wang, T., Wei, X., Ding, A., Poon, C. N., Lam, K. S., Li, Y. S., Chan, L. Y., & Anson, M. (2009) · Atmospheric chemistry and physics · doi:10.5194/acp-9-6217-2009 · Cited by 400
Temperature and Recent Trends in the Chemistry of Continental Surface Ozone
Pusede, S. E., Steiner, A. L., & Cohen, R. C. (2015) · Chemical Reviews · doi:10.1021/cr5006815 · Cited by 343
Research works printed but not linked: 4
- Eskridge, R. E., Ku, J. Y., Rao, S. T., Porter, P. S., and Zurbenko, I. G.: Separating Different Scales of Motion in Time Series of Meteorological Variables, B. Am. Meteorol. Soc., 78, 1473–1483, 10.1175/1520-0477(1997)0782.0.CO;2, 1997. · DOI
- IPCC: Climate Change 2013 – The Physical Science Basis, Cambridge University Press, Cambridge, 1552 pp., 2013.
- NRC (National Research Council): Rethinking the Ozone Problem in Urban and Regional Air Pollution, National Academy Press, Washington, D.C., 1991.
- Penkett, S. A.: Indications and causes of ozone increase in the troposphere, in: Rowland, F. S. and Isaksen, I. S. A., The Changing Atmosphere, J. Wiley&Sons, p. 91, 1988.
Cited by
Sorted by citations
Wang, T., Xue, L., Brimblecombe, P., Lam, Y. F., Li, L., & Zhang, L. (2016) · The Science of The Total Environment · doi:10.1016/j.scitotenv.2016.10.081 · Cited by 1,898
Anthropogenic drivers of 2013–2017 trends in summer surface ozone in China
Li, K., Jacob, D. J., Liao, H., Shen, L., Zhang, Q., & Bates, K. H. (2019) · Proceedings of the National Academy of Sciences · doi:10.1073/pnas.1812168116 · Cited by 1,804
Severe Surface Ozone Pollution in China: A Global Perspective
Lu, X. H., Hong, J., Zhang, L., Cooper, O. R., Schultz, M. G., Xu, X., Wang, T., Gao, M. C., Zhao, Y., & Zhang, Y. (2018) · Environmental Science & Technology Letters · doi:10.1021/acs.estlett.8b00366 · Cited by 1,043
Ozone pollution: A Major health hazard worldwide
Zhang, J. (., Wei, Y., & Fang, Z. (2019) · Frontiers in Immunology · doi:10.3389/fimmu.2019.02518 · Cited by 828
Chen, Z., Chen, D., Zhao, C., Kwan, M., Cai, J., Zhuang, Y., Zhao, B., Wang, X., Чэн, Б., Yang, J., et al. (2020) · Environment International · doi:10.1016/j.envint.2020.105558 · Cited by 756
Metadata
- Authors
- Ma, Z., Xu, J., Quan, W., Zhang, Z., Lin, W., & Xu, X.
- Affiliations
- China Meteorological Administration (CN)
- Chinese Academy of Meteorological Sciences (CN)
- Corresponding author
- Lin, Weili
- Venue
- Atmospheric chemistry and physics
- Publisher
- Copernicus GmbH
- Published
- 2016-03-24
- Volume
- 16
- Issue
- 6
- Pages
- 3969-3977
- ISSN
- 1680-7316 (ISSN-L)
- 1680-7324
- OpenAlex
- W2304410378
- Cited by
- 332
- References
- 52
- Citations by year
- 2026: 6 · 2025: 21 · 2024: 30 · 2023: 42 · 2022: 52 · 2021: 50 · 2020: 49 · 2019: 40 · 2018: 21 · 2017: 16 · 2016: 5
- FWCI
- 16.68
- Type
- journal article
- Language
- en
- Open access
- gold
- doi.org
- Licence
- Locations
- Atmospheric chemistry and physics (publishedVersion, cc-by)
- DOAJ (DOAJ: Directory of Open Access Journals) (submittedVersion, cc-by-sa)
- Funders
- National Natural Science Foundation of China (41475135)
- Natural Science Foundation of Beijing Municipality (8132025, 8152018)
- Topics
- Physical Sciences › Earth and Planetary Sciences › Atmospheric Science › Atmospheric chemistry and aerosols
- Physical Sciences › Earth and Planetary Sciences › Atmospheric Science › Atmospheric Ozone and Climate
- Physical Sciences › Environmental Science › Global and Planetary Change › Atmospheric and Environmental Gas Dynamics
- Keywords
- surface ozone, ozone trends, North China Plain, VOC emissions, NO2, seasonal ozone variation
About these checks
Registry, retraction, Cites and statistics results are computed, not judged, with one exception: a printed reference that no index lists is read once by a model before it counts as a citation error. Claims are extracted by a model and kept only when their quote appears verbatim in the text; each cited source is then checked, with a model’s help, for whether it says what the claim relies on. Those verdicts can be wrong — read the claim’s quote and the cited source before relying on one.
Statistics and arithmetic are recomputed, not judged.
Confidence bands are shown only for fields calibrated on our annotated test set. None is calibrated yet, so no band is shown.
What counts as a claim ›How we measure confidence ›How we check this ›
Are you an author, or do you see a problem with this page? Request a review
