

Quality control and correction method for air temperature data from a citizen science weather station network in Leuven, Belgium
Open accessPreprint — published as 10.5194/essd-14-4681-2022 · Paper page
The DOI matches its Crossref record; 47 of the 47 references it cites were found in a registry or an index; 1 of the 69 sources its claims cite were checked for support.
Abstract
The dataset is accompanied by a newly developed station specific temperature quality control (QC) and correction procedure.
Overview
CoChat Summary
TL;DR
The paper presents the Leuven.cool citizen-science network of around 100 low-cost WH2600 weather stations and a three-level station-specific quality control and correction procedure for air temperature. The method removes implausible measurements and corrects inter-station and intra-station biases, reducing the mean temperature difference versus official RMI stations from 0.15 ± 0.56 K to 0.00 ± 0.28 K.
Key findings
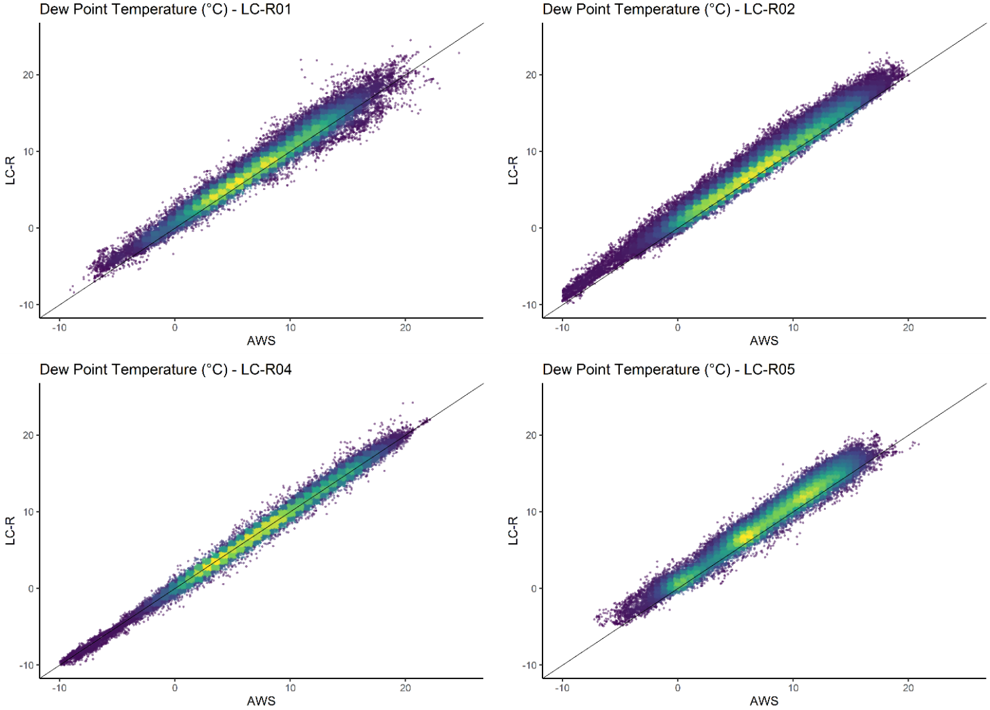
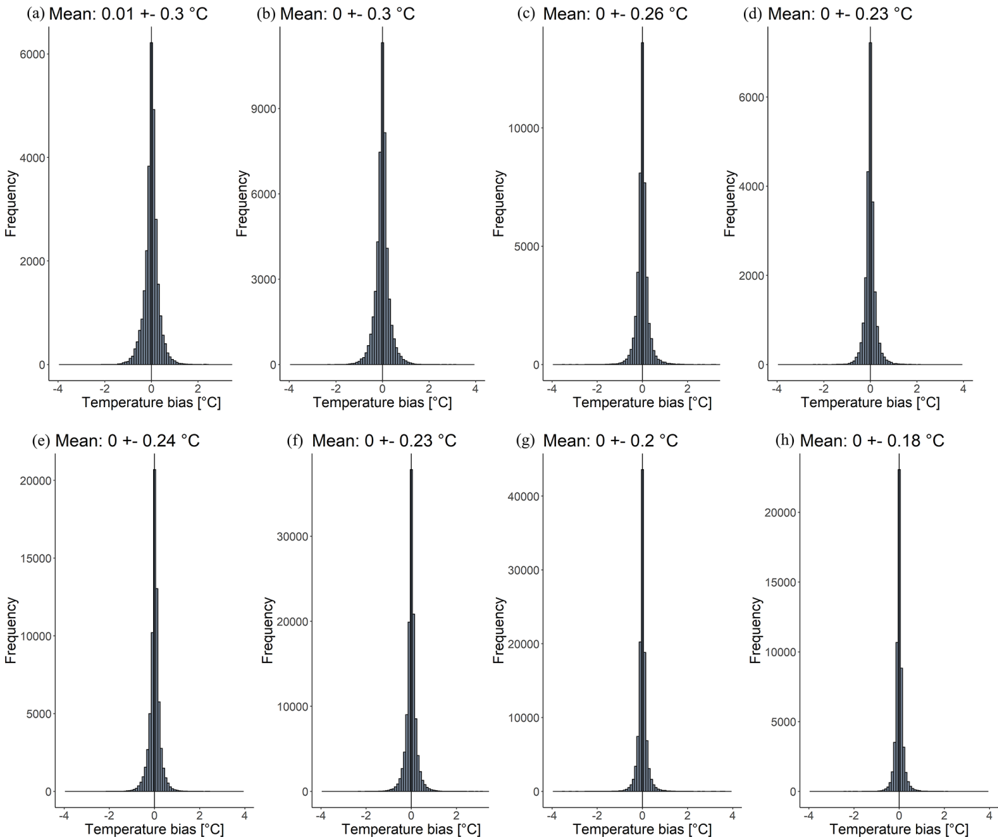
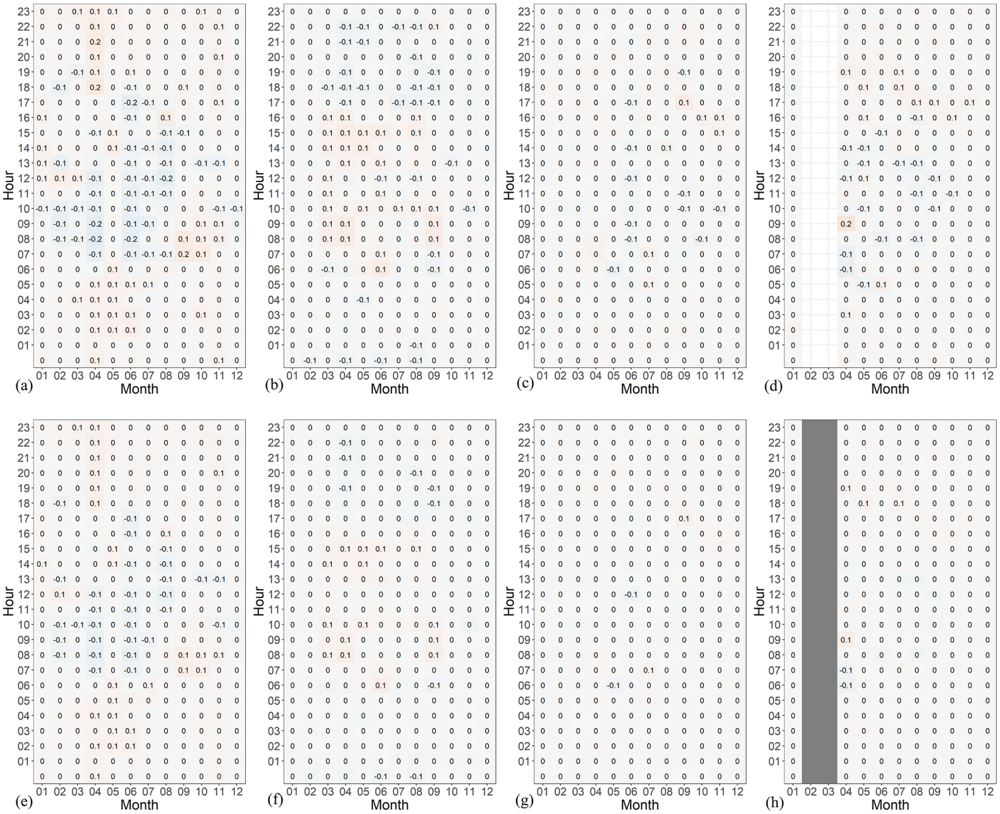
- The QC method reduced the mean temperature difference ± standard deviation between four low-cost reference stations and official RMI stations from 0.15 ± 0.56 K to 0.00 ± 0.28 K.
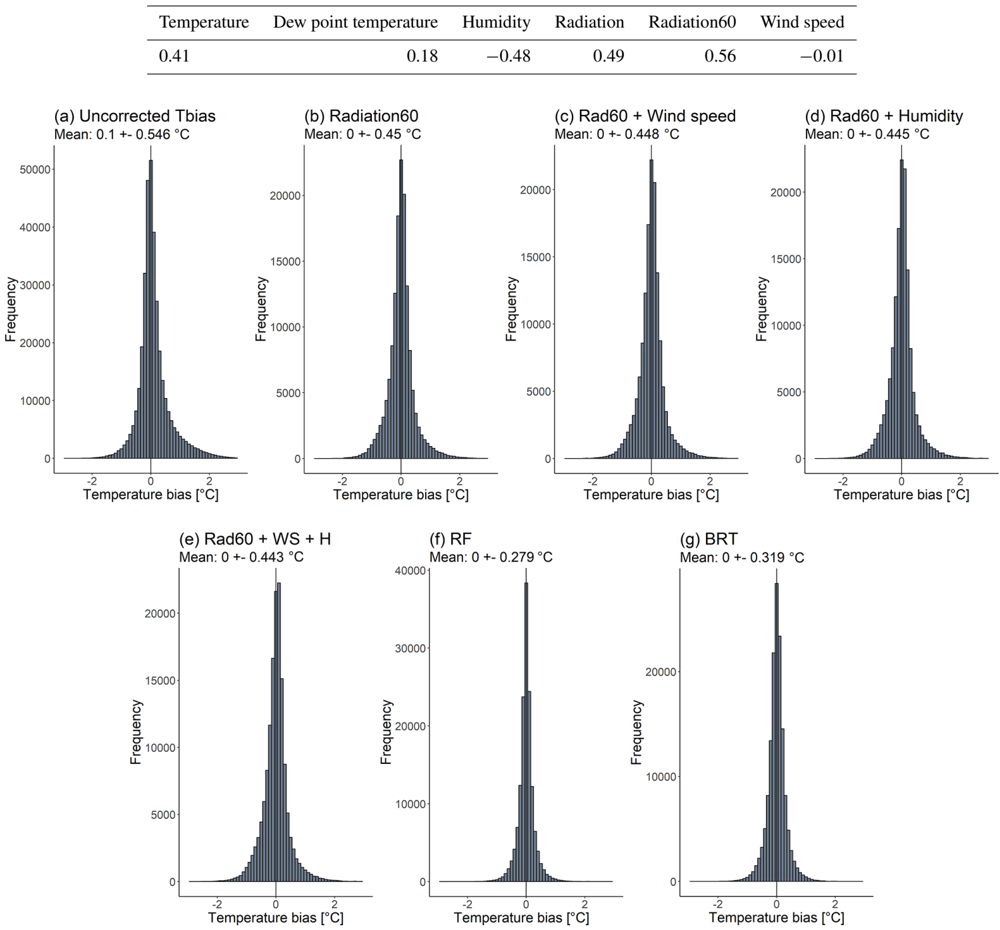
- A random forest model performed best for intra-station bias prediction, with R² = 0.741 and RMSE = 0.279, compared with boosted regression trees (R² = 0.658, RMSE = 0.319) and simpler radiation-based models (e.g. radiation60: R² = 0.321, RMSE = 0.450).
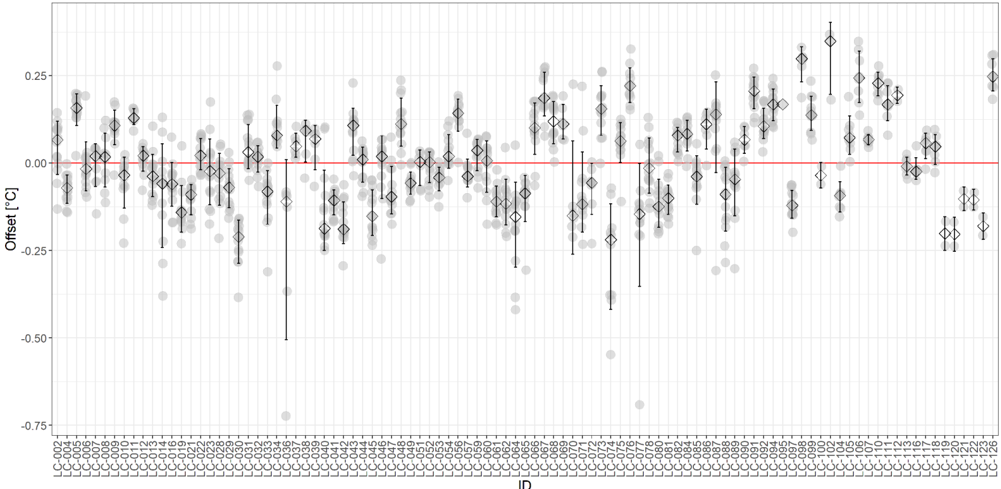
- For the Leuven.cool network, only 0.5 %–1 % of observations per year were flagged as outliers during QC level 1; QC level 2 gave a mean station offset of 0.010 °C, with station LC-102 highest at 0.349 °C and LC-074 lowest at −0.220 °C.
- QC level 3 reduced summer mean temperatures and standard deviations by up to −0.40 °C and −0.36 °C, respectively, with little change in winter.
Methods
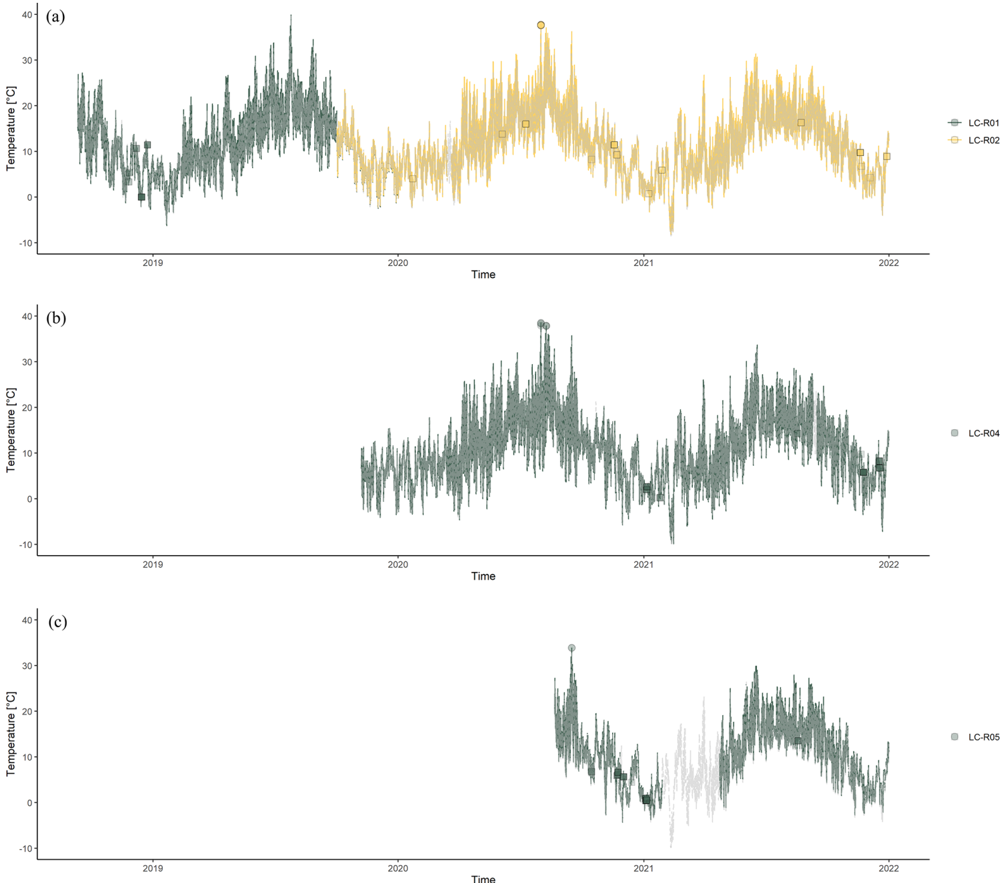
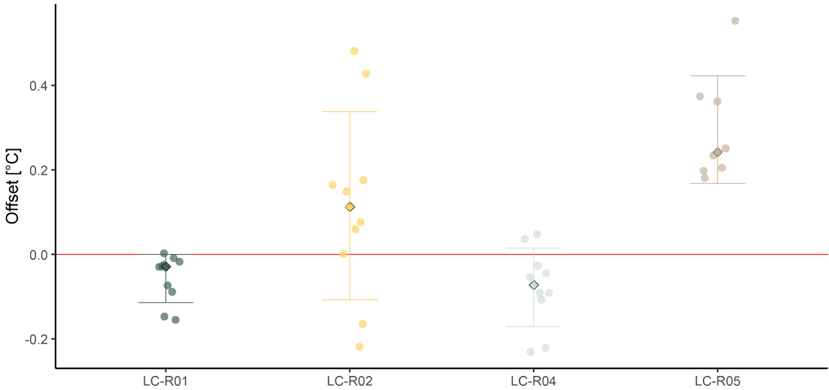
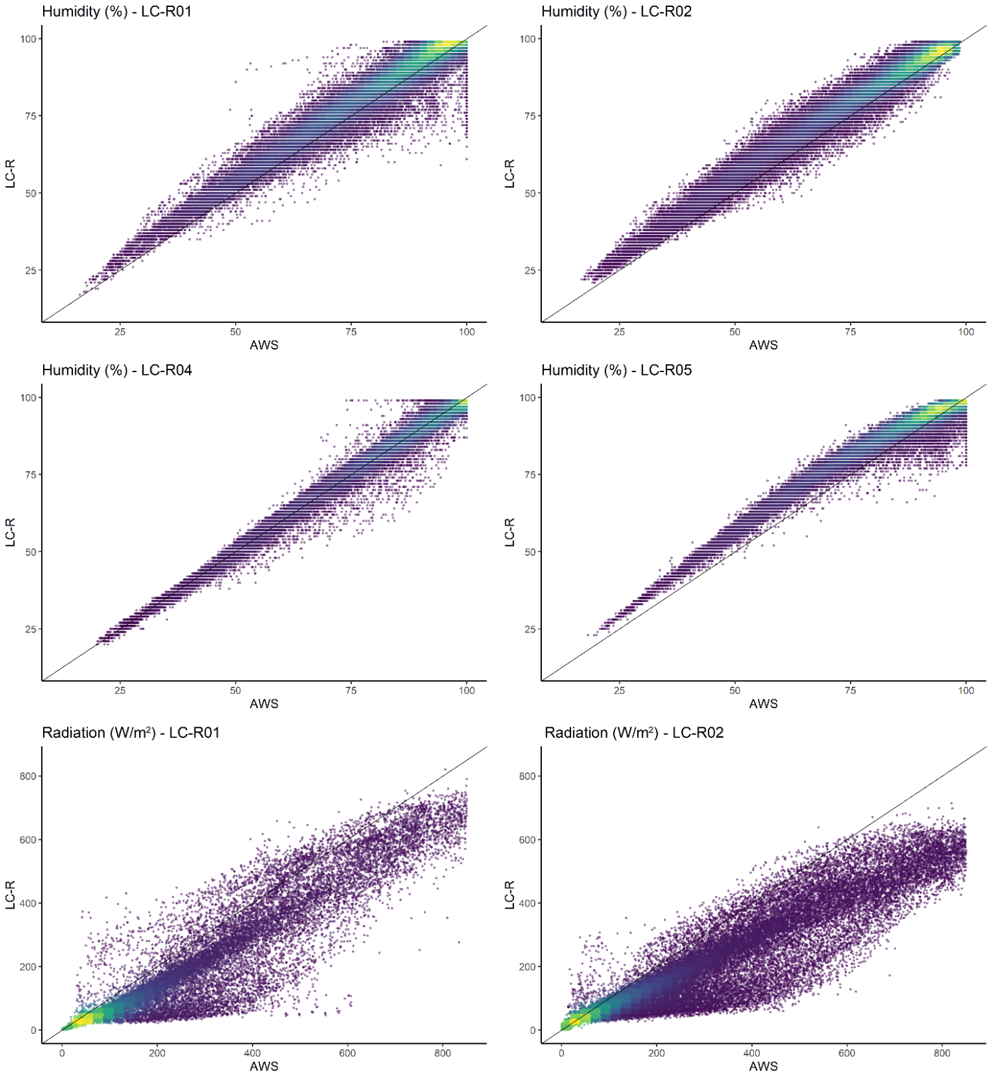
- The study uses the Leuven.cool network of 106 low-cost Fine Offset WH2600 stations across Leuven, Belgium, with data from July 2019 to December 2021 aggregated to 10 min observations; four reference stations (LC-R01, LC-R02, LC-R04, LC-R05) were installed next to official RMI AWS in Uccle, Diepenbeek and Humain.
- The QC procedure has three levels: L1 outlier detection (range, temporal step/persistence, and spatial Z-score tests), L2 inter-station fixed bias correction using uniform-temperature episodes, and L3 intra-station bias correction using a random forest trained on 60 % of LC-R data and validated on 40 %.
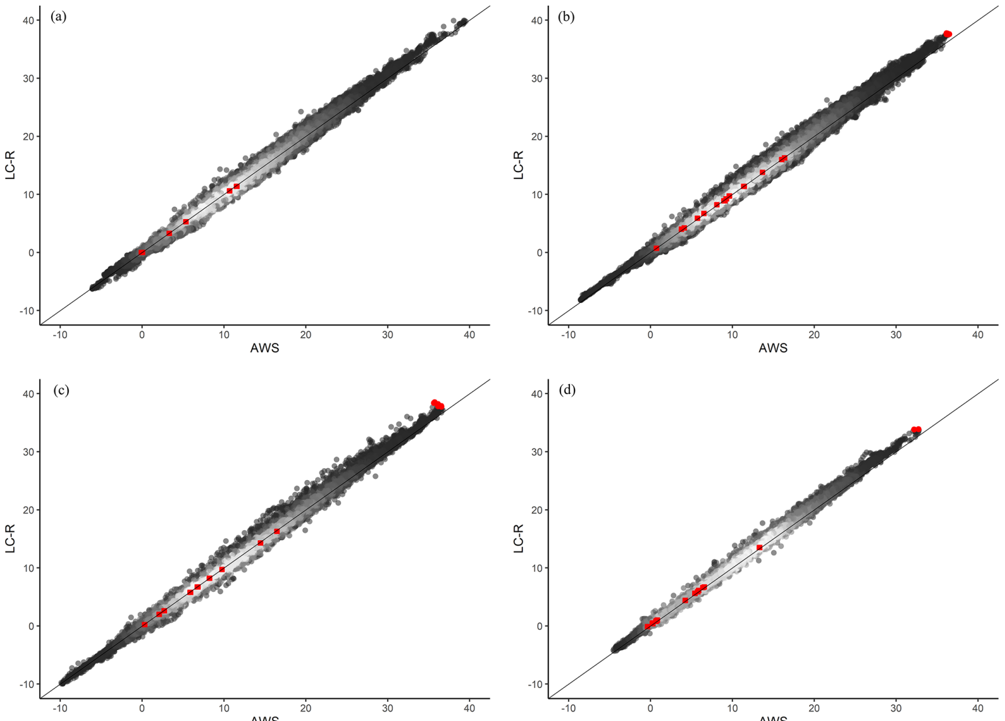
- Evaluation compares LC-R station temperatures with AWS temperatures after each QC level; the method is then applied to the Leuven.cool LC-X network.
Limitations
- The paper states that transferring the method to other networks or regions requires recalibration of QC parameters; QC L1.1 needs climate thresholds, QC L1.3 and L2 require a dense station network and are less suitable for single or few stations, and QC L3 needs additional data such as radiation and wind speed.
- The paper notes that the reference-station spatial outlier test is not ideal because each reference station has only one neighbour, except LC-R01 and LC-R02 in Uccle during a 4-month overlap; it also notes possible bias because the RF model was trained on 60 % of the LC-R dataset and applied to the complete LC-R dataset, with test-only results giving 0.00 ± 0.28 °C versus 0.00 ± 0.22 °C for the complete dataset.
- Evident from the text: only air temperature undergoes quality control and correction, while other variables receive only a qualitative assessment; the network is unevenly distributed across LCZ classes and some LCZ classes are missing due to practical installation constraints.
Model-written summary. Check it against the paper before relying on it.
Integrity signals
Registry
Cites
Statistics
Figures








Verification
Claims the paper makes
1 Valid · 0 Not valid · 42 Not checked · 114 Own results and interpretations
The cited sources support only part of this claim — read each source’s verdict below.
In the paper
“The dataset can also help refine existing weather forecast models which are currently mostly based on official rural observations (Sgoff et al., 2022).”
§ Quality control and correction method for air temperature data from a citizen science weather station network in Leuven, Belgium > Application potential of the quality-controlled and corrected Leuven.cool dataset
What the sources say
- Partly supportedcites Sgoff et al., 2022 sourceExperimental — accuracy not yet measured
The Introduction says crowdsourced observations can fill gaps in conventional networks and help improve forecasts, supporting the dataset’s potential use. But §2.1 does not establish that forecast models are mostly based on official rural observations: it says the conventional observations assimilated in this study include several sources and are dominated in number by aircraft measurements. (LLM, conf=0.86)
plainstates a possible cause- Asserted: passes — The authors put it forward as true.
- Checkable: passes — It can be checked against evidence.
- Load-bearing: unclear — It is unclear whether the paper’s conclusions depend on it.
- Based: passes — The paper gives a reason why it holds.
- Partly supported
A result the paper reports from its own data — it cites no other source for it, so there is none to check. The quote shows it is in the paper.
In the paper
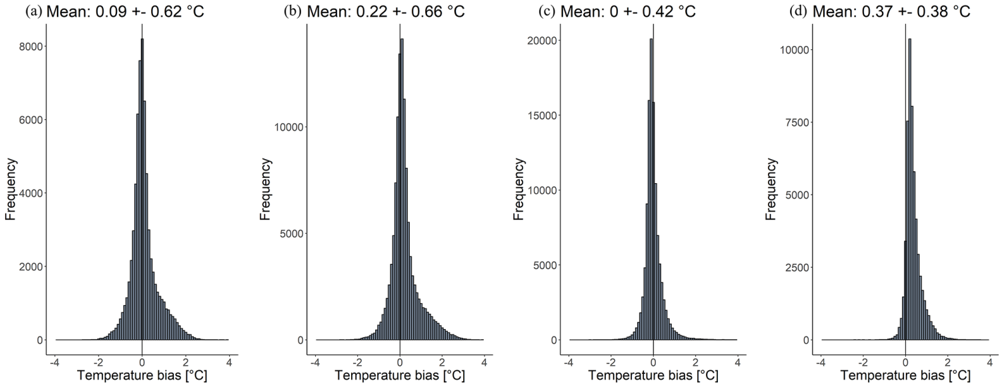
“The QC method is able to reduce this bias from 0.15 ± 0.56 to 0.00 ± 0.28 K.”
§ Quality control and correction method for air temperature data from a citizen science weather station network in Leuven, Belgium > Abstract
plainstates a cause- Asserted: passes — The authors put it forward as true.
- Checkable: passes — It can be checked against evidence.
- Load-bearing: passes — The paper’s conclusions depend on it.
- Based: passes — The paper gives a reason why it holds.
A result the paper reports from its own data — it cites no other source for it, so there is none to check. The quote shows it is in the paper.
In the paper
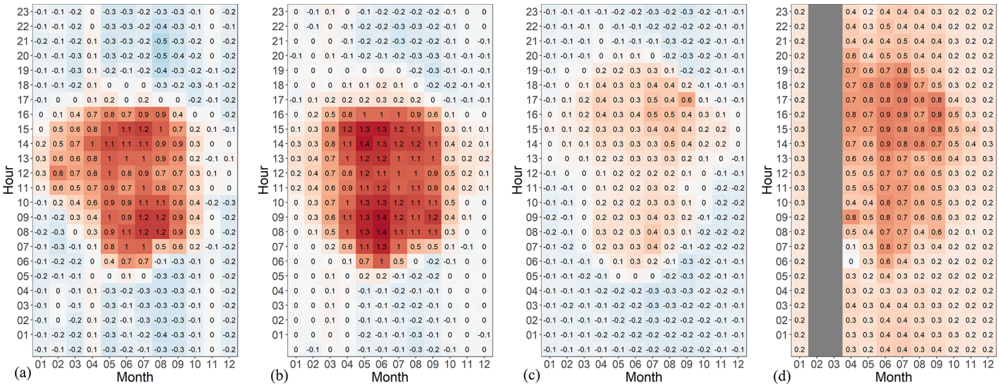
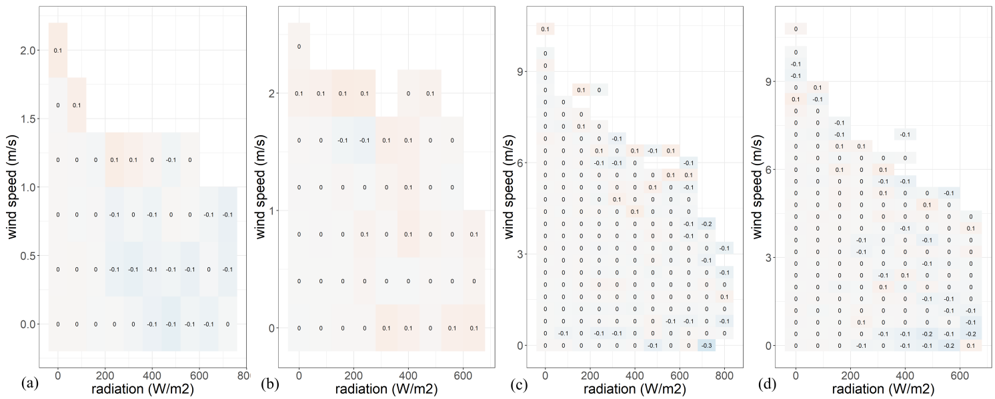
“A positive temperature bias with a strong relation to the incoming solar radiation was found between the CWS data and the official data.”
§ Quality control and correction method for air temperature data from a citizen science weather station network in Leuven, Belgium > Abstract
boostedstates an association- Asserted: passes — The authors put it forward as true.
- Checkable: passes — It can be checked against evidence.
- Load-bearing: passes — The paper’s conclusions depend on it.
- Based: passes — The paper gives a reason why it holds.
A result the paper states — it cites no source for it, so there is none to check. The quote shows it is in the paper.
In the paper
“The Leuven.cool network is a uniform network in the sense that only one weather station type (Fine Offset WH2600) is used for the entire network.”
§ Quality control and correction method for air temperature data from a citizen science weather station network in Leuven, Belgium > Introduction
plain- Asserted: passes — The authors put it forward as true.
- Checkable: passes — It can be checked against evidence.
- Load-bearing: passes — The paper’s conclusions depend on it.
- Based: passes — The paper gives a reason why it holds.
A result the paper reports from its own data — it cites no other source for it, so there is none to check. The quote shows it is in the paper.
In the paper
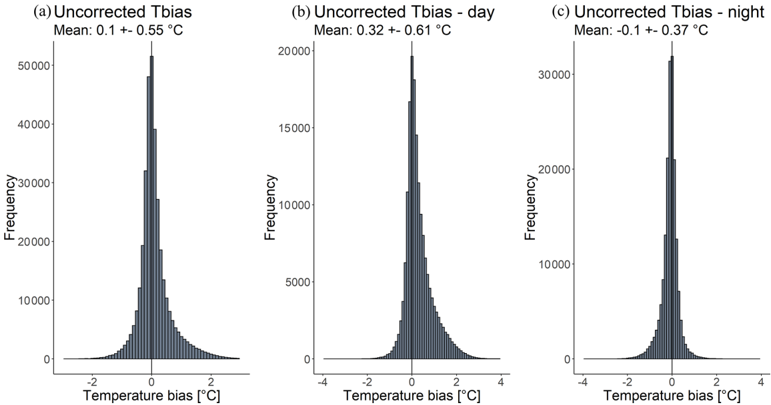
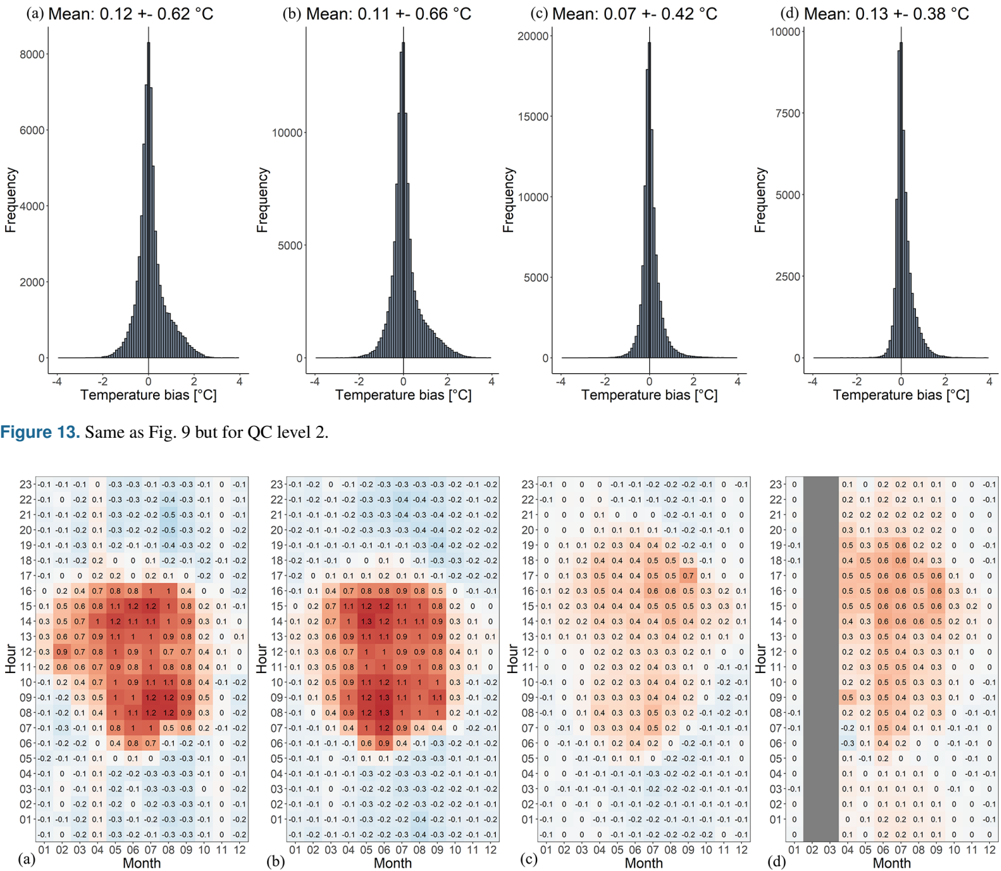
“Figure 3 further suggests a higher standard deviation during daytime (0.61 • C) compared with night-time (0.37 • C), both with a remarkably skewed (and opposite) distribution.”
§ Quality control and correction method for air temperature data from a citizen science weather station network in Leuven, Belgium > The intra-station temperature bias
hedgedstates an association- Asserted: passes — The authors put it forward as true.
- Checkable: passes — It can be checked against evidence.
- Load-bearing: unclear — It is unclear whether the paper’s conclusions depend on it.
- Based: passes — The paper gives a reason why it holds.
65 more claims
Create a free account to see all 157 claims and to verify the 6 references still open.
- It may state two separate claims as one. 57
- The quote only partly states this claim. 4
- Probably not a substantial claim. 34
Self-check
Percentages, sums and reported differences re-computed from the paper’s own numbers.
Each contradiction between two passages listed here was confirmed by an independent check.
Rated minor: it would not touch a result — a value no result rests on, a p-value that stays on the same side of the significance level, or a conflict that is clerical, resolved elsewhere in the paper, or outside its own findings.
In the paper
§ Quality control and correction method for air temperature data from a citizen science weather station network in Leuven, Belgium > Quality control level 1 -outlier detection
“180 observations change less than 0.05 • C within 2 h.”
§ Quality control and correction method for air temperature data from a citizen science weather station network in Leuven, Belgium > Conclusions
“less than 0.05 • C (TOb ThresMin ) within 3 h (TOb Timespan ) are”
Rated minor: it would not touch a result — a value no result rests on, a p-value that stays on the same side of the significance level, or a conflict that is clerical, resolved elsewhere in the paper, or outside its own findings.
In the paper
“the standard deviation does slightly increase by 0.5 to 0.7 • C when using the test dataset only.The mean temperature difference ± standard deviation for all LC-R stations increases from 0.00 ± 0.22 to 0.00 ± 0.28 • C.”
§ Quality control and correction method for air temperature data from a citizen science weather station network in Leuven, Belgium > Additional information
Reported 0.5 · recomputed 0.06
Citations
Cites
World map of the Köppen-Geiger climate classification updated
Kottek, M., Grieser, J., Beck, C., Rudolf, B., & Rubel, F. (2006) · Meteorologische Zeitschrift · doi:10.1127/0941-2948/2006/0130 · Cited by 11,456 · cited 1×
“Leuven has a warm temperate climate with no dry season and a warm summer (Cfb), no influence from mountains or seas, and overall weak topography (Kottek et al., 2006).”
Background(IPCC), I. P. O. C. C. (2023) · doi:10.1017/9781009157896 · Cited by 6,972
Local Climate Zones for Urban Temperature Studies
Stewart, I. D., & Oke, T. R. (2012) · Bulletin of the American Meteorological Society · doi:10.1175/bams-d-11-00019.1 · Cited by 4,419
Arnfield, A. J. (2003) · International Journal of Climatology · doi:10.1002/joc.859 · Cited by 3,543 · cited 3×
“Such episodes occur under breezy cloudy conditions with no rainfall (Arnfield, 2003; Kidder and Essenwanger, 1995).”
BackgroundCity size and the urban heat island
Oke, T. R. (1973) · Atmospheric Environment (1967) · doi:10.1016/0004-6981(73)90140-6 · Cited by 2,535 · cited 1×
“Fixed pairs of stations (e.g. Bassani et al., 2022; Oke, 1973) or mobile transect approaches (e.g. Kousis et al., 2021) have traditionally been used to quantify this phenomenon.”
A review on the generation, determination and mitigation of Urban Heat Island
RIZWAN, A. M., DENNIS, L. Y. C., & LIU, C. (2008) · Journal of Environmental Sciences · doi:10.1016/s1001-0742(08)60019-4 · Cited by 1,950 · cited 1×
“…due to the computational power capacity, these models only take a limited number of variables into account, making them less suitable for real-life applications (Rizwan et al., 2008); additionally, they often lack observational data to train and validate their simulations (Heaviside et al., 2017).”
BackgroundCastell, N., Dauge, F. R., Schneider, P., Vogt, M., Lerner, U., Fishbain, B., Broday, D., & Bartonova, A. (2017) · Environment International · doi:10.1016/j.envint.2016.12.007 · Cited by 1,039 · cited 1×
“…2020; Fenner et al., 2017; Napoly et al., 2018; Meier et al., 2017; Hammerberg et al., 2018; Feichtinger et al., 2020), rainfall (de Vos et al., 2019, 2020, 2017), wind speed (Chen et al., 2021; de Vos et al., 2020) and air pollution (EEA, 2019; Castell et al., 2017) within complex urban settings.”
BackgroundThe Urban Heat Island: Implications for Health in a Changing Environment
Heaviside, C., Macintyre, H., & Vardoulakis, S. (2017) · Current Environmental Health Reports · doi:10.1007/s40572-017-0150-3 · Cited by 849 · cited 3×
“However, both methods are not ideal: pairs of stations lack detailed spatial information, whereas transects often miss a temporal component (Chapman et al., 2017; Heaviside et al., 2017).”
BackgroundMasson, V., Le Moigne, P., Martin, E., Faroux, S., Alias, A., Alkama, R., Belamari, S., Barbu, A., Boone, A., Bouyssel, F., et al. (2013) · Geoscientific Model Development · doi:10.5194/gmd-6-929-2013 · Cited by 831
A systematic review and scientific critique of methodology in modern urban heat island literature
Stewart, I. D. (2011) · International Journal of Climatology · doi:10.1002/joc.2141 · Cited by 752
Research works printed but not linked: 3
- Ahrens, C. D.: Meteorology Today: An Introduction to Weather, Climate, and the Environment, 9th Edn., Brooks/Cole, 549 pp., 2009. · DOI
- Rizwan, A. M., Dennis, L. Y. C., and Lia, C.: A review on the generation, determination and mitigation of Urban Heat Island, J. Environ. Sci., 20, 120-128, https://doi.org/10.1016/S1001- 0742(08)60019-4, 2008. · DOI
- Stewart, I. D. and Oke, T. R.: Local climate zones for urban studies, B. Am. Meteorol. Soc., 93, 1879-1900, https://doi.org/10.1175/BAMS-D-11-00019. · DOI · Paper page
Cited by
Beele, E., Aerts, R., Reyniers, M., & Somers, B. (2024) · Landscape and Urban Planning · doi:10.1016/j.landurbplan.2024.105121 · Cited by 127
Self-citationUrban tree canopies drive human heat stress mitigation
Gillerot, L., Landuyt, D., Frenne, P. D., Muys, B., & Verheyen, K. (2023) · Urban forestry & urban greening · doi:10.1016/j.ufug.2023.128192 · Cited by 96
Observations from Personal Weather Stations—EUMETNET Interests and Experience
Hahn, C., Garcia‐Martí, I., Sugier, J., Emsley, F., Beaulant, A.-L., Oram, L., Strandberg, E., Lindgren, E., Martyn, S., & Ziska, F. (2022) · Climate · doi:10.3390/cli10120192 · Cited by 43
Medina, D. C., Delgado, M. G., Ramos, J. S., Amores, T. R. P., Rodríguez, L. R., & Domínguez, S. Á. (2024) · Sustainable Cities and Society · doi:10.1016/j.scs.2024.105208 · Cited by 35
Automatic quality control of weather data for timely decisions in agriculture
Dandrifosse, S., Jago, A., Huart, J. P., Michaud, V., Planchon, V., & Rosillon, D. (2024) · Smart Agricultural Technology · doi:10.1016/j.atech.2024.100445 · Cited by 24
Metadata
- Authors
- Beele, E., Reyniers, M., Aerts, R., & Somers, B.
- Affiliations
- KU Leuven (BE)
- Royal Meteorological Institute of Belgium (BE)
- Sciensano (Belgium) (BE)
- Venue
- Earth System Science Data Discussions
- Publisher
- Copernicus GmbH
- Published
- 2022-05-02
- Volume
- 14
- Issue
- 10
- Pages
- 4681-4717
- ISSN
- 1866-3508 (ISSN-L)
- OpenAlex
- W4307361576
- Cited by
- 44
- References
- 46
- Citations by year
- 2026: 16 · 2025: 13 · 2024: 7 · 2023: 4 · 2022: 4
- FWCI
- 2.04
- Type
- journal article
- Language
- en
- Open access
- gold
- doi.org
- Licence
- Locations
- Earth system science data (publishedVersion, cc-by)
- DOAJ (DOAJ: Directory of Open Access Journals) (submittedVersion, cc-by-sa)
- Lirias (KU Leuven) (submittedVersion, cc-by)
- Funders
- Fonds Wetenschappelijk Onderzoek (1SE0621N)
- Topics
- Physical Sciences › Environmental Science › Environmental Engineering › Urban Heat Island Mitigation
- Physical Sciences › Computer Science › Computer Science Applications › Mobile Crowdsensing and Crowdsourcing
- Physical Sciences › Environmental Science › Management, Monitoring, Policy and Law › Environmental Monitoring and Data Management
- Keywords
- air temperature, citizen science, data quality control, temperature bias correction, random forest, urban heat island, urban climate monitoring, low-cost weather station, Leuven, solar radiation
About these checks
Registry, retraction, Cites and statistics results are computed, not judged, with one exception: a printed reference that no index lists is read once by a model before it counts as a citation error. Claims are extracted by a model and kept only when their quote appears verbatim in the text; each cited source is then checked, with a model’s help, for whether it says what the claim relies on. Those verdicts can be wrong — read the claim’s quote and the cited source before relying on one.
The claim verdicts this report counts are experimental: their accuracy is not yet measured.
A language model drew the claims from the paper on 2026-11-11, under version 3 of the claim definition (model deepseek-v4.1-flash, prompt extract-v3).
A second model labelled each claim on 2026-11-11 (model jev-1.13-20260917, definition revision gold-guideline-v0.2).
Cited sources are checked with a language model’s help (gpt-6-sol).
Statistics and arithmetic are recomputed, not judged.
Confidence bands are shown only for fields calibrated on our annotated test set. None is calibrated yet, so no band is shown.
What counts as a claim ›How we measure confidence ›How we check this ›
Are you an author, or do you see a problem with this page? Request a review
How to cite
Cite CoChat for the checks on this page, and the paper for its own findings.
- This page
- CoChat. (2026). Citation check: Quality control and correction method for air temperature data from a citizen science weather station network in Leuven, Belgium. https://app.cochat.ai/papers/10.5194/essd-2022-113
- The paper
- Beele, E., Reyniers, M., Aerts, R., & Somers, B. (2022). Quality control and correction method for air temperature data from a citizen science weather station network in Leuven, Belgium. Earth System Science Data Discussions. https://doi.org/10.5194/essd-2022-113
Data sources
Bibliographic data: Semantic Scholar, OpenAlex, Crossref.
Contains information from the Semantic Scholar Academic Graph Datasets, made available under the ODC Attribution License (ODC-BY 1.0).
Semantic Scholar’s data is described in: Kinney, R., et al. (2023). The Semantic Scholar Open Data Platform. arXiv:2301.10140.
