

The DOI matches its Crossref record; 120 of the 121 references it cites were found in a registry or an index, and 1 are not checked yet.
A fully coupled solid-particle microphysics scheme for stratospheric aerosol injections within the aerosol–chemistry–climate model SOCOL-AERv2
Open accessPublished version of a preprint
Abstract
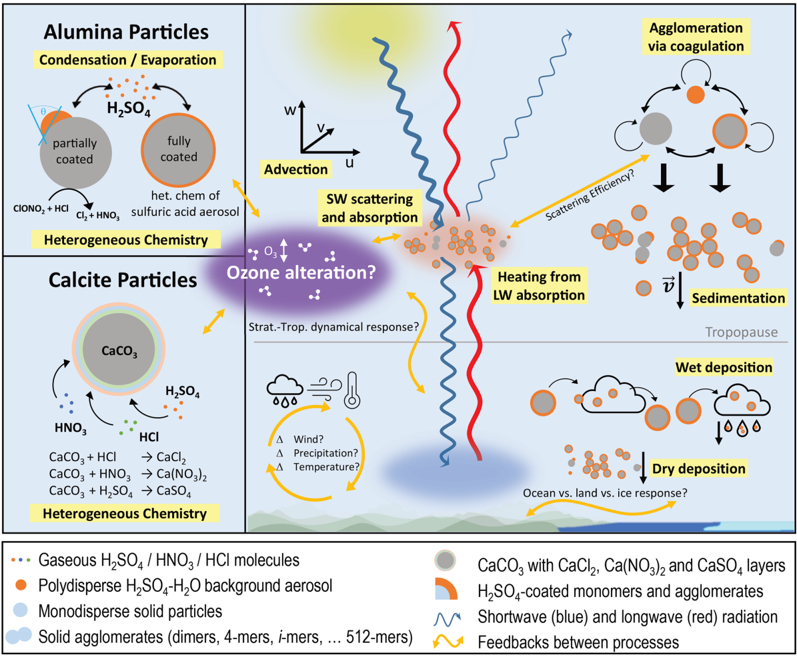
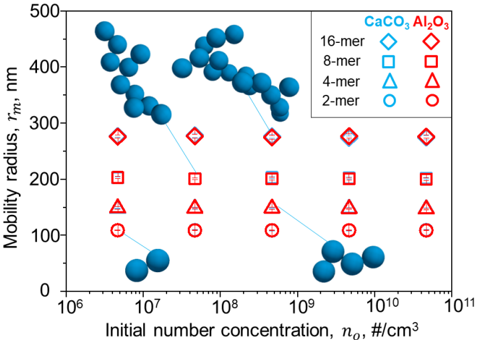
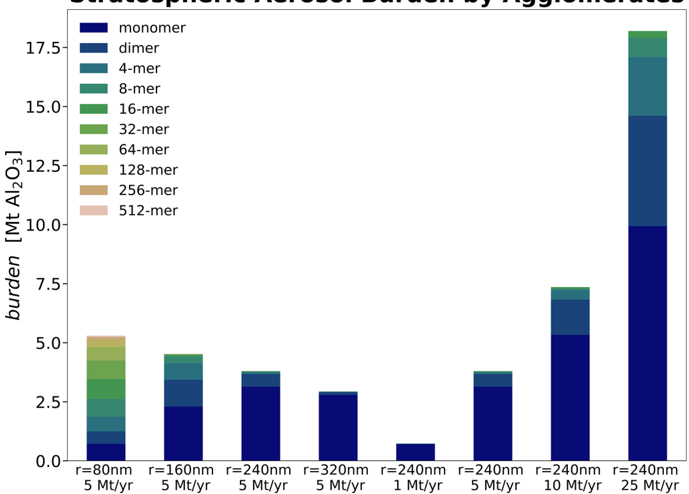
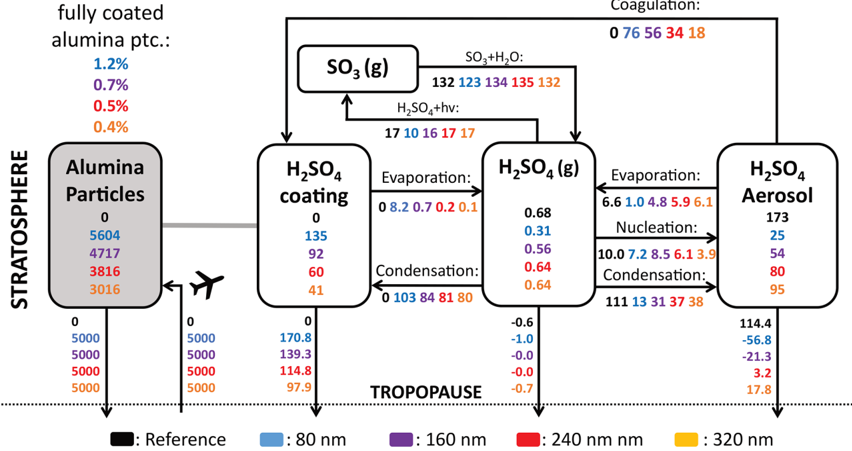
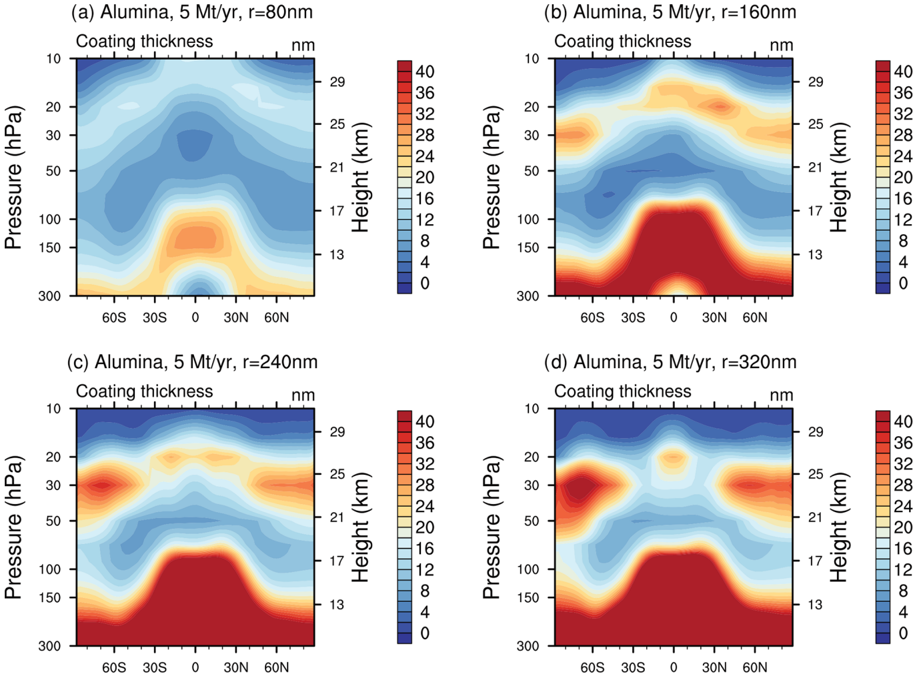
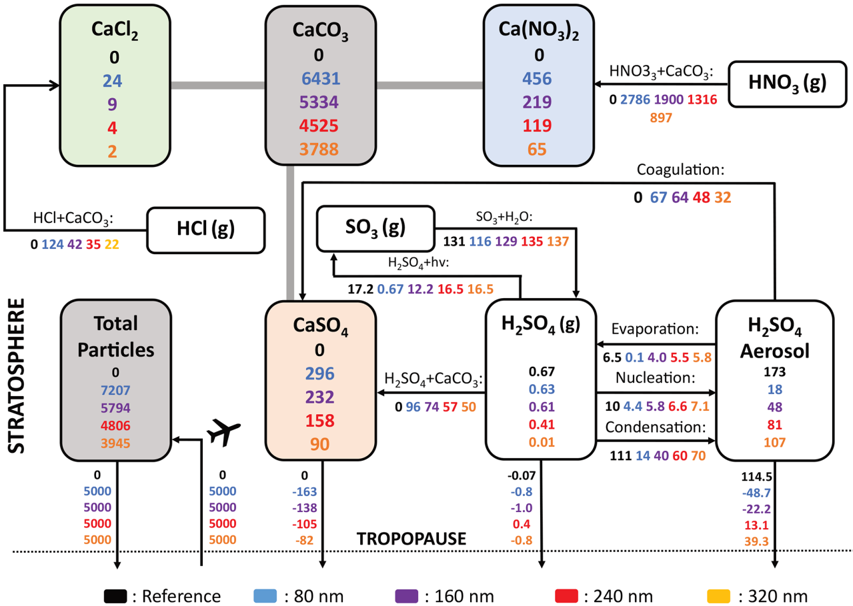
Recent studies have suggested that injection of solid particles such as alumina and calcite particles for stratospheric aerosol injection (SAI) instead of sulfur-based injections could reduce some of the adverse side effects of SAI such as ozone depletion and stratospheric heating. Here, we present a version of the global aerosol–chemistry–climate model SOCOL-AERv2 and the Earth system model (ESM) SOCOLv4 which incorporate a solid-particle microphysics scheme for assessment of SAI of solid particles. Microphysical interactions of the solid particle with the stratospheric sulfur cycle were interactively coupled to the heterogeneous chemistry scheme and the radiative transfer code (RTC) for the first time within an ESM. Therefore, the model allows simulation of heterogeneous chemistry at the particle surface as well as feedbacks between microphysics, chemistry, radiation and climate. We show that sulfur-based SAI results in a doubling of the stratospheric aerosol burden compared to the same mass injection rate of calcite and alumina particles with a radius of 240 nm. Most of the sulfuric acid aerosol mass resulting from SO 2 injection does not need to be lifted to the stratosphere but is formed after in situ oxidation and subsequent water uptake in the stratosphere. Therefore, to achieve the same radiative forcing, larger injection rates are needed for calcite and alumina particle injection than for sulfur-based SAI. The stratospheric sulfur cycle would be significantly perturbed, with a reduction in stratospheric sulfuric acid burden by 53 %, when injecting 5 Mt yr −1 (megatons per year) of alumina or calcite particles of 240 nm radius. We show that alumina particles will acquire a sulfuric acid coating equivalent to about 10 nm thickness if the sulfuric acid is equally distributed over the whole available particle surface area in the lower stratosphere. However, due to the steep contact angle of sulfuric acid on alumina particles, the sulfuric acid coating would likely not cover the entire alumina surface, which would result in available surface for heterogeneous reactions other than the ones on sulfuric acid. When applying realistic uptake coefficients of 1.0, 10 −5 and 10 −4 for H 2 SO 4 , HCl and HNO 3 , respectively, the same scenario with injections of calcite particles results in 94 % of the particle mass remaining in the form of CaCO 3 . This likely keeps the optical properties of the calcite particles intact but could significantly alter the heterogeneous reactions occurring on the particle surfaces. The major process uncertainties of solid-particle SAI are (1) the solid-particle microphysics in the injection plume and degree of agglomeration of solid particles on the sub-ESM grid scale, (2) the scattering properties of the resulting agglomerates, (3) heterogeneous chemistry on the particle surface, and (4) aerosol–cloud interactions. These uncertainties can only be addressed with extensive, coordinated experimental and modelling research efforts. The model presented in this work offers a useful tool for sensitivity studies and incorporating new experimental results on SAI of solid particles.
Overview
The claims and statistics of this paper haven’t been checked yet.
Free: it reads the open-access text and checks the first 5 claims that cite a source we can check. Create a free account to check every claim.
Integrity signals
Registry
Cites
Statistics
Figures


Verification
Claims the paper makes
The claims and statistics of this paper haven’t been checked yet.
Free: it reads the open-access text and checks the first 5 claims that cite a source we can check. Create a free account to check every claim.
Claims other papers make about this one
Each is checked against this paper’s own text: does it say what the citing paper says it does?
The source backs part of the claim, not all of it — or backs it for a different population, condition or comparison.
In the citing paper
“However, the use of these minerals has primarily been modeled with the assumption that they could be dispersed on a grid box scale with a single, optimal sub-micron particle size11,12.”
From Engineering and logistical concerns add practical limitations to stratospheric aerosol injection strategies (2025) · cites this paper as [11]
Experimental — accuracy not yet measuredThe source backs part of the claim, not all of it — or backs it for a different population, condition or comparison.
In the citing paper
“Vattioni (2024) and Weisenstein (2015) find that for continuous monomer injections over a large spread (S - N), coagulation increases with increases injection rate and decreasing monomer size, potentially favoring smaller local fluxes of monomers11,12.”
From Engineering and logistical concerns add practical limitations to stratospheric aerosol injection strategies (2025) · cites this paper as [11]
Experimental — accuracy not yet measuredThe cited source says what the claim attributes to it.
In the citing paper
“The impact of fractal aggregate formation on solid forcing efficiency has only been modeled as a result of coagulation during the lifetime of optimally dispersed monomers11.”
From Engineering and logistical concerns add practical limitations to stratospheric aerosol injection strategies (2025) · cites this paper as [11]
Self-check
Percentages, sums and reported differences re-computed from the paper’s own numbers.
The self-check needs the paper’s full text.
Citations
Cites
Mlawer, E. J., Taubman, S. J., Brown, P. D., Iacono, M. J., & Clough, S. A. (1997) · Journal of Geophysical Research: Atmospheres · doi:10.1029/97jd00237 · Cited by 8,419 · cited 2×
“…(2015), we accounted for condensation of H 2 SO 4 , not only on fully coated but also on partially coated solid particles The H 2 SO 4 condensation rates on solid particles are calculated as a function of the SAD of solid particles, their number density, the molecular diffusion coefficient of H 2…”
Calvin, K., Dasgupta, D., Krinner, G., Mukherji, A., Thorne, P. W., Trisos, C., Romero, J., Aldunce, P., Barrett, K., Blanco, G., et al. (2023) · doi:10.59327/ipcc/ar6-9789291691647 · Cited by 6,896
O’Neill, B. C., Kriegler, E., Ebi, K. L., Kemp-Benedict, E., Riahi, K., Rothman, D. S., van Ruijven, B. J., van Vuuren, D. P., Birkmann, J., Kok, K., et al. (2017) · Global Environmental Change · doi:10.1016/j.gloenvcha.2015.01.004 · Cited by 3,359
Parameterization of surface resistances to gaseous dry deposition in regional-scale numerical models
Wesely, M. L. (1989) · Atmospheric Environment (1967) · doi:10.1016/0004-6981(89)90153-4 · Cited by 2,304
Albedo enhancement by stratospheric sulfur injections: a contribution to resolve a policy dilemma?
Crutzen, P. J. (2006) · Climatic Change · doi:10.1007/s10584-006-9101-y · Cited by 1,541 · cited 1×
“…such as the Mt. Pinatubo eruption 1991 (e.g. Arfeuille et al., 2013; Thomason et al., 2018; Baran and Foot, 1994; Kovilakam et al., 2020) allow for model evaluation of the chemical and radiative impacts of large stratospheric sulfur emissions (e.g. Deshler et al., 2019; Quaglia et al., 2023).”
Mauritsen, T., Bader, J., Becker, T., Behrens, J., Bittner, M., Brokopf, R., Brovkin, V., Claussen, M., Crueger, T., Esch, M., et al. (2019) · Journal of Advances in Modeling Earth Systems · doi:10.1029/2018ms001400 · Cited by 1,520
Predicting global atmospheric ice nuclei distributions and their impacts on climate
DeMott, P. J., Prenni, A. J., Liu, X., Kreidenweis, S. M., Petters, M. D., Twohy, C. H., Richardson, M. S., Eidhammer, T., & Rogers, D. C. (2010) · Proceedings of the National Academy of Sciences · doi:10.1073/pnas.0910818107 · Cited by 1,453
Atmospheric component of the MPI‐M Earth System Model: ECHAM6
Stevens, B., Giorgetta, M., Esch, M., Mauritsen, T., Crueger, T., Rast, S., Salzmann, M., Schmidt, H., Bader, J., Block, K., et al. (2013) · Journal of Advances in Modeling Earth Systems · doi:10.1002/jame.20015 · Cited by 1,379 · cited 1×
“3) of a falling particle are in equilibrium (i.e F G F D ). i air p m ,i i 0 t ,i”
Ghosh, G. (1999) · Optics Communications · doi:10.1016/s0030-4018(99)00091-7 · Cited by 1,226
Roeckner, E., Brokopf, R., Esch, M., Giorgetta, M., Hagemann, S., Kornblueh, L., Manzini, E., Schlese, U., & Schulzweida, U. (2006) · Journal of Climate · doi:10.1175/jcli3824.1 · Cited by 1,183
Research works printed but not linked: 4
- Bohren, C. F. and Huffman, D. R.: Absorption and scattering of light by small particles, John Wiley & Sons, 0.1002/9783527618156, 2008.
- Burns, W. C.: Climate geoengineering: solar radiation management and its implications for intergenerational equity, Stanford Journal of Law, Science & Policy, 4, 39–55, 2011.
- Seinfeld, J. H. and Pandis, S. N.: Atmospheric Chemistry and Physics: From Air Pollution to Climate Change, John Wiley & Sons Inc., ISBN 978-1-118-94740-1, 1997.
- Teller, E., Wood, L., and Hyde, R.: Global warming and ice ages: I. Prospects for physics-based modulation of global change, Tech. rep., Lawrence Livermore National Lab., https://www.osti.gov/servlets/purl/611779 (last access: 4 November 2024), 1996.
Cited by
Maloney, C., Portmann, R. W., Ross, M. N., & Rosenlof, K. H. (2025) · Journal of Geophysical Research Atmospheres · doi:10.1029/2024jd042442 · Cited by 35
“Recent work by Vattioni et al. (2024) showed that sulfate may not coat solid aluminum aerosols uniformly, which adds further uncertainty about the composition of these aerosols in the stratosphere.”
Vattioni, S., Käslin, S. K., Dykema, J. A., Luo, B., Sukhodolov, T., Sedláčék, J., Keutsch, F. N., Peter, T., & Chiodo, G. (2024) · Geophysical Research Letters · doi:10.1029/2024gl110575 · Cited by 20
“In this study, we do not consider heterogeneous chem-137 istry at the solid particle surface nor the interaction with sulfuric acid aerosols via co-138 agulation and condensation, since these effects are subject to large uncertainty (Vattioni et al., 2023; Vattioni, Weber, et al., 2024).”
BackgroundMethodInfluentialSelf-citationRecent Advances in Radiative Cooling: From Fundamentals to Commercial Applications
Keawmuang, H., Park, J., Lee, H., Choi, S., So, S., Lim, C., Badloe, T., Hyeon, C., Jeong, M., Lee, D., et al. (2026) · ACS Applied Materials & Interfaces · doi:10.1021/acsami.6c00074 · Cited by 15
Vattioni, S., Peter, T., Weber, R., Dykema, J. A., Luo, B., Stenke, A., Feinberg, A., Sukhodolov, T., Keutsch, F. N., Ammann, M., et al. (2025) · Communications Earth & Environment · doi:10.1038/s43247-025-02038-1 · Cited by 13
“However, using smaller particles would alsoleadtomoreef fi cientagglomerationthroughcoagulation,whichinturn reduces the backward to forward scattering ratio of visible light 22,34 .”
InfluentialSelf-citationNear-future rocket launches could slow ozone recovery
Revell, L. E., Bannister, M. T., Brown, T. F. M., Sukhodolov, T., Vattioni, S., Dykema, J. A., Frame, D. J., Cater, J. E., Chiodo, G., & Rozanov, E. (2025) · npj Climate and Atmospheric Science · doi:10.1038/s41612-025-01098-6 · Cited by 21
“SOCOLv4 was recently updated with a solid particle microphysics 67 .”
InfluentialSelf-citation
Metadata
- Authors
- Vattioni, S., Weber, R., Feinberg, A., Stenke, A., Dykema, J. A., Luo, B., Kelesidis, G. A., Bruun, C. A., Sukhodolov, T., Keutsch, F. N., Peter, T., & Chiodo, G.
- Affiliations
- Harvard University (US)
- Consejo Superior de Investigaciones Científicas (ES)
- ETH Zurich (CH)
- Rutgers, The State University of New Jersey (US)
- Physikalisch-Meteorologisches Observatorium Davos (CH)
- Corresponding author
- Vattioni, Sandro
- ORCID
- Venue
- Geoscientific Model Development
- Publisher
- Copernicus GmbH
- Published
- 2024-11-06
- Volume
- 17
- Issue
- 21
- Pages
- 7767-7793
- ISSN
- 1991-959X (ISSN-L)
- 1991-9603
- OpenAlex
- W4404114873
- Cited by
- 17
- References
- 117
- Citations by year
- 2026: 7 · 2025: 7 · 2024: 3
- FWCI
- 3.00
- Type
- journal article
- Language
- en
- Open access
- gold
- doi.org
- Licence
- Locations
- Geoscientific model development (publishedVersion, cc-by)
- DORA Eawag (Swiss Federal Institute of Aquatic Science and Technology (Eawag)) (submittedVersion, cc-by)
- DIGITAL.CSIC (Spanish National Research Council (CSIC)) (submittedVersion, cc-by)
- DOAJ (DOAJ: Directory of Open Access Journals) (submittedVersion)
- Repository for Publications and Research Data (ETH Zurich) (submittedVersion, cc-by)
- ETH Zürich Research Collection
- Funders
- Eidgenössische Technische Hochschule Zürich (ETH-1719-2)
- Simons Foundation (SFIMPS-SRM-00005217, SFI-MPS-SRM-00005223, SFI-MPS-SRM-00005208)
- Topics
- Physical Sciences › Environmental Science › Global and Planetary Change › Climate Change and Geoengineering
- Physical Sciences › Environmental Science › Global and Planetary Change › Atmospheric aerosols and clouds
- Physical Sciences › Earth and Planetary Sciences › Atmospheric Science › Atmospheric chemistry and aerosols
- Keywords
- stratospheric aerosol injection, calcite particles, alumina particles, heterogeneous chemistry, aerosol-cloud interactions, radiative forcing, aerosol-cloud feedback, water absorption, contact angle, uptake coefficient, ozone depletion
About these checks
Registry, retraction, Cites and statistics results are computed, not judged, with one exception: a printed reference that no index lists is read once by a model before it counts as a citation error. Claims are extracted by a model and kept only when their quote appears verbatim in the text; each cited source is then checked, with a model’s help, for whether it says what the claim relies on. Those verdicts can be wrong — read the claim’s quote and the cited source before relying on one.
Statistics and arithmetic are recomputed, not judged.
Confidence bands are shown only for fields calibrated on our annotated test set. None is calibrated yet, so no band is shown.
What counts as a claim ›How we measure confidence ›How we check this ›
Are you an author, or do you see a problem with this page? Request a review
How to cite
Cite CoChat for the checks on this page, and the paper for its own findings.
- This page
- CoChat. (2026). Citation check: A fully coupled solid-particle microphysics scheme for stratospheric aerosol injections within the aerosol–chemistry–climate model SOCOL-AERv2. https://app.cochat.ai/papers/10.5194/gmd-17-7767-2024
- The paper
- Vattioni, S., Weber, R., Feinberg, A., Stenke, A., Dykema, J. A., Luo, B., Kelesidis, G. A., Bruun, C. A., Sukhodolov, T., Keutsch, F. N., Peter, T., & Chiodo, G. (2024). A fully coupled solid-particle microphysics scheme for stratospheric aerosol injections within the aerosol–chemistry–climate model SOCOL-AERv2. Geoscientific Model Development. https://doi.org/10.5194/gmd-17-7767-2024
Data sources
Bibliographic data: Semantic Scholar, OpenAlex, Crossref.
Contains information from the Semantic Scholar Academic Graph Datasets, made available under the ODC Attribution License (ODC-BY 1.0).
Semantic Scholar’s data is described in: Kinney, R., et al. (2023). The Semantic Scholar Open Data Platform. arXiv:2301.10140.
