

The DOI matches its Crossref record.
Assessment of human immediate response capability related to tsunami threats in Indonesia at a sub-national scale
Abstract
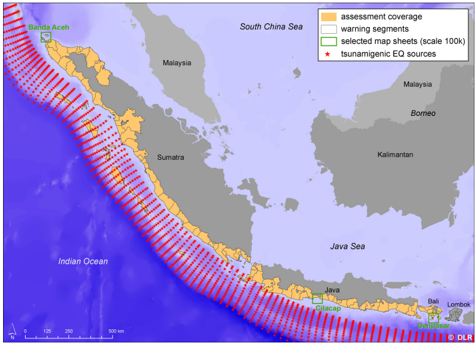
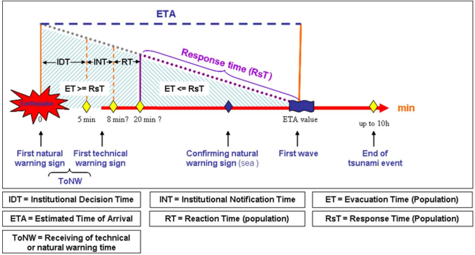
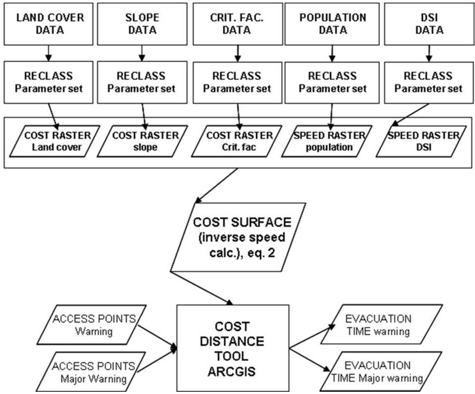
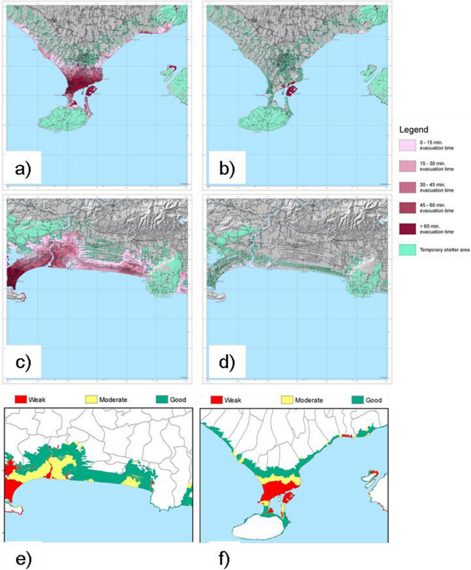
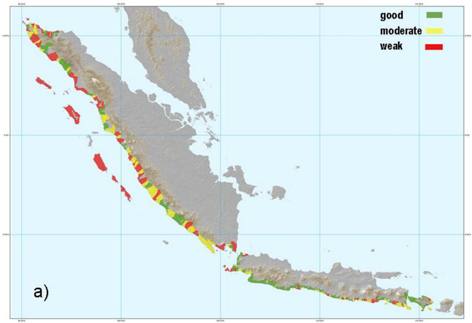
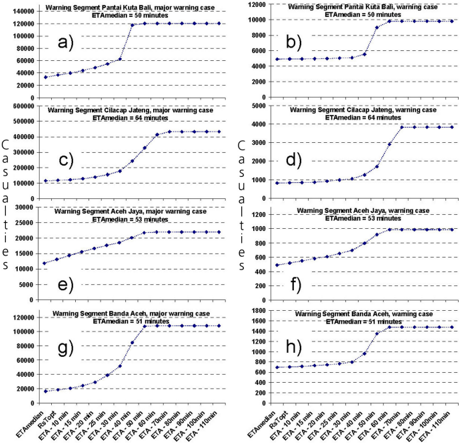
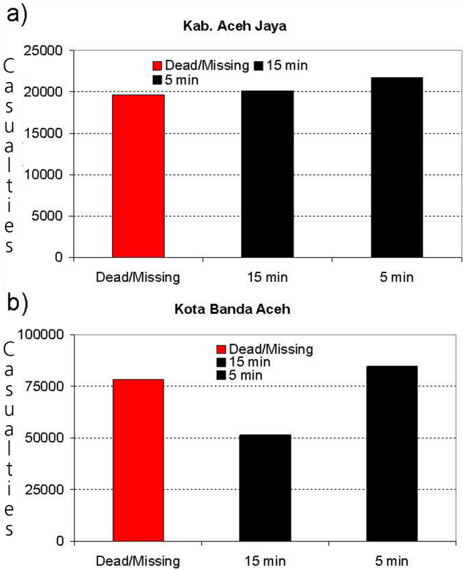
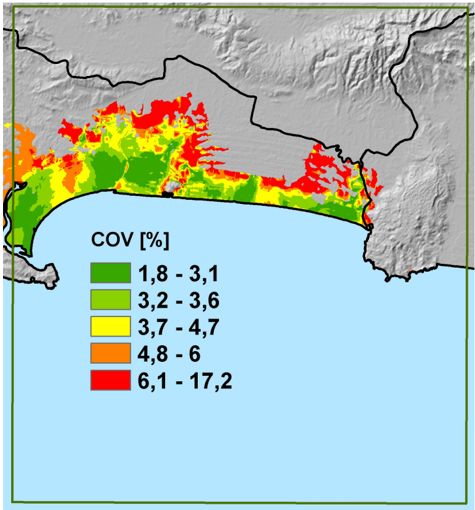
Abstract. Human immediate response is contextualized into different time compartments reflecting the tsunami early warning chain. Based on the different time compartments the available response time and evacuation time is quantified. The latter incorporates accessibility of safe areas determined by a hazard assessment, as well as environmental and demographic impacts on evacuation speed properties assessed using a Cost Distance Weighting GIS approach. Approximately 4.35 million Indonesians live in tsunami endangered areas on the southern coasts of Sumatra, Java and Bali and have between 20 and 150 min to reach a tsunami-safe area. Most endangered areas feature longer estimated-evacuation times and hence the population possesses a weak immediate response capability leaving them more vulnerable to being directly impacted by a tsunami. At a sub-national scale these hotspots were identified and include: the Mentawai islands off the Sumatra coast, various sub-districts on Sumatra and west and east Java. Based on the presented approach a temporal dynamic estimation of casualties and displacements as a function of available response time is obtained for the entire coastal area. As an example, a worst case tsunami scenario for Kuta (Bali) results in casualties of 25 000 with an optimal response time (direct evacuation when receiving a tsunami warning) and 120 000 for minimal response time (no evacuation). The estimated casualties correspond well to observed/reported values and overall model uncertainty is low with a standard error of 5%. The results obtained allow for prioritization of intervention measures such as early warning chain, evacuation and contingency planning, awareness and preparedness strategies down to a sub-district level and can be used in tsunami early warning decision support.
Overview
The claims and statistics of this paper haven’t been checked yet.
Run the check — free, no account needed. It reads the open-access text and checks the sources it cites.
Integrity signals
Registry
Cites
Statistics
Figures
Verification
Claims the paper makes
The claims and statistics of this paper haven’t been checked yet.
Run the check — free, no account needed. It reads the open-access text and checks the sources it cites.
Claims other papers make about this one
Each is checked against this paper’s own text: does it say what the citing paper says it does?
In the citing paper
“The anisotropic LCD model uses cost-distance geoprocessing that also includes the in uence of land cover types(Laghi et al. 2006, Post et al. 2009).”
From Pedestrian evacuation time calculation against tsunami hazard for southern coasts of bodrum peninsula (2023) · cites this paper as Post et al. 2009
Self-check
Percentages, sums and reported differences re-computed from the paper’s own numbers.
The self-check needs the paper’s full text.
Citations
Cites
No references could be resolved yet.
Research works printed but not linked: 7
- Doocy, S., Gorokhovich, Y., Burnham, G., Balk, D., and Robinson, C.: Tsunami Mortality Estimates and Vulnerability Mapping in Aceh, Indonesia, American Journal of Public Health, 97, S146, 2007.
- Drabek, T. E.: Understanding disaster warning responses, The So- cial Science Journal, 36, 515-523, 1999.
- Post, J., Zosseder, K., Wegscheider, S., Steinmetz, T., Riedlinger, T., Strunz, G., Mehl, H., Dech, S., Birkmann, J., Gebert, N., Anwar, H. Z., and Harjono, H.: Risk assessment to low fre- quency -high impact coastal hazard in Indonesia: Integrating tsunami hazard and vulnerability assessment in the context of Early Warning, International Conference on Tsunami Warning (ICTW), Bali, 2008-11-12-2008-11-14, 2008b.
- Saltelli, A., Tarantola, S., Campolongo, F., and Ratto, M.: Sensitiv- ity Analysis in Practice: A Guide to Assessing Scientific Models John Wiley and Sons, Hoboken, NJ 232 pp., 2004.
- Sorensen, J. H.: Hazard Warning Systems: Review of 20 Years of Progress, Natural Hazards Review, 1, 119-125, 2000.
- Sorensen, J. H., Shumpert, B. L., and Vogt, B. M.: Planning for protective action decision making: evacuate or shelter-in-place, Journal of Hazardous Materials, 109, 1-11, 2004.
- Thompson, P.: Simulex: simulated people have needs too. NIST Workshop on Building Occupant Movement during Fire Emer- gencies, NIST, 1-10, 2004.
Cited by
Sorted by citations
Wood, N. J., & Schmidtlein, M. C. (2012) · Natural Hazards · doi:10.1007/s11069-011-9994-2 · Cited by 133
Celikbas, B., Tufekci-Enginar, D., Dogan, G. G., Kolat, C., Santini, M., Annunziato, A., Necmioglu, O., Yalciner, A. C., & Suzen, M. L. (2023) · Natural Hazards · doi:10.1007/s11069-023-06034-6 · Cited by 5
Metadata
- Authors
- Post, J., Wegscheider, S., Mück, M., Zosseder, K., Kiefl, R., Steinmetz, T., & Strunz, G.
- Venue
- Natural Hazards and Earth System Sciences
- Publisher
- Copernicus GmbH
- Published
- 2009-07-06
- Volume
- 9
- Issue
- 4
- Pages
- 1075-1086
- ISSN
- 1684-9981
- Cited by
- 73
- References
- 0
- Language
- en
About these checks
Registry, retraction, Cites and statistics results are computed, not judged, with one exception: a printed reference that no index lists is read once by a model before it counts as a citation error. Claims are extracted by a model and kept only when their quote appears verbatim in the text; each cited source is then checked, with a model’s help, for whether it says what the claim relies on. Those verdicts can be wrong — read the claim’s quote and the cited source before relying on one.
Statistics and arithmetic are recomputed, not judged.
Confidence bands are shown only for fields calibrated on our annotated test set. None is calibrated yet, so no band is shown.
What counts as a claim ›How we measure confidence ›How we check this ›
Are you an author, or do you see a problem with this page? Request a review
