

The DOI matches its Crossref record; 56 of the 56 references it cites were found in a registry or an index; none of the 34 sources its claims cite is checked for support yet.
From Data Streams to Decisions: Multi-Source Hydrometeorological Integration Platforms for Interagency Risk-Management Capacity Building in Data-Limited Regions
Open accessAbstract
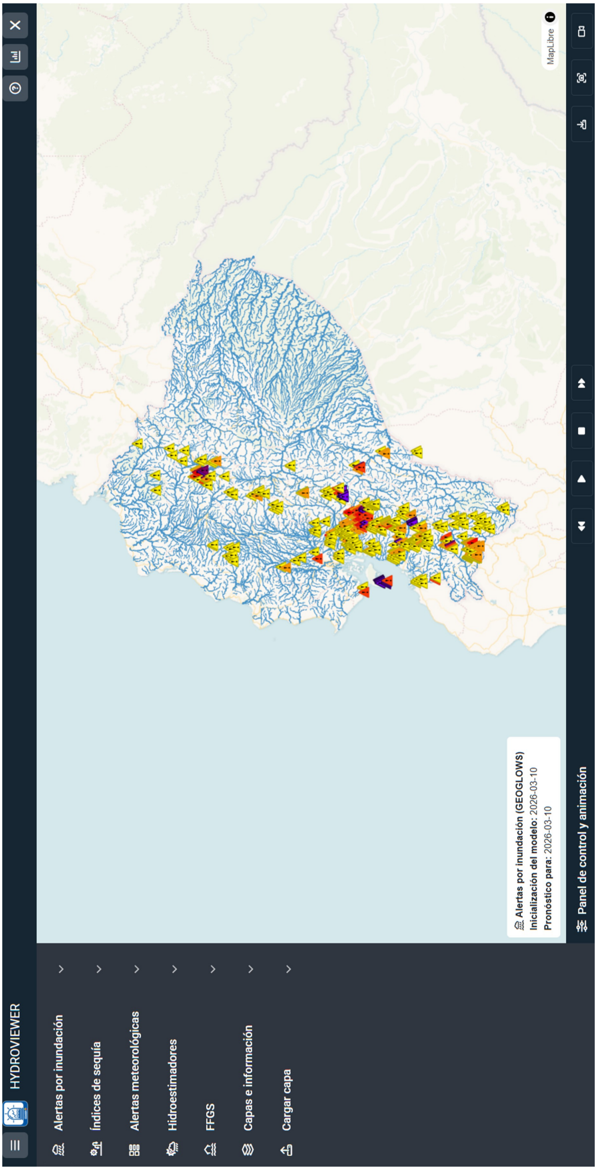
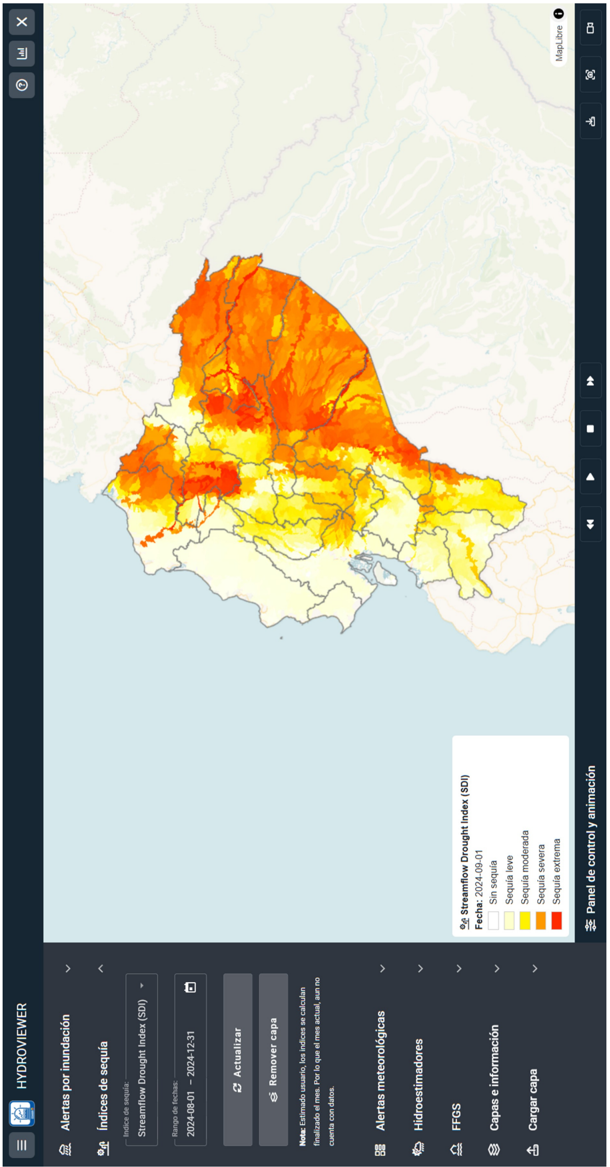
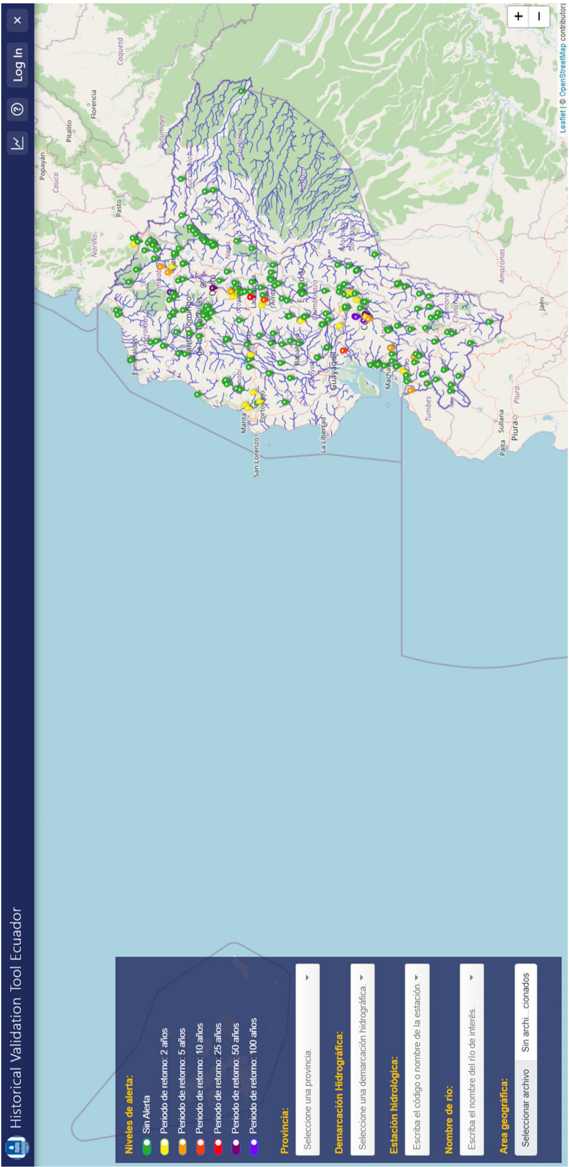
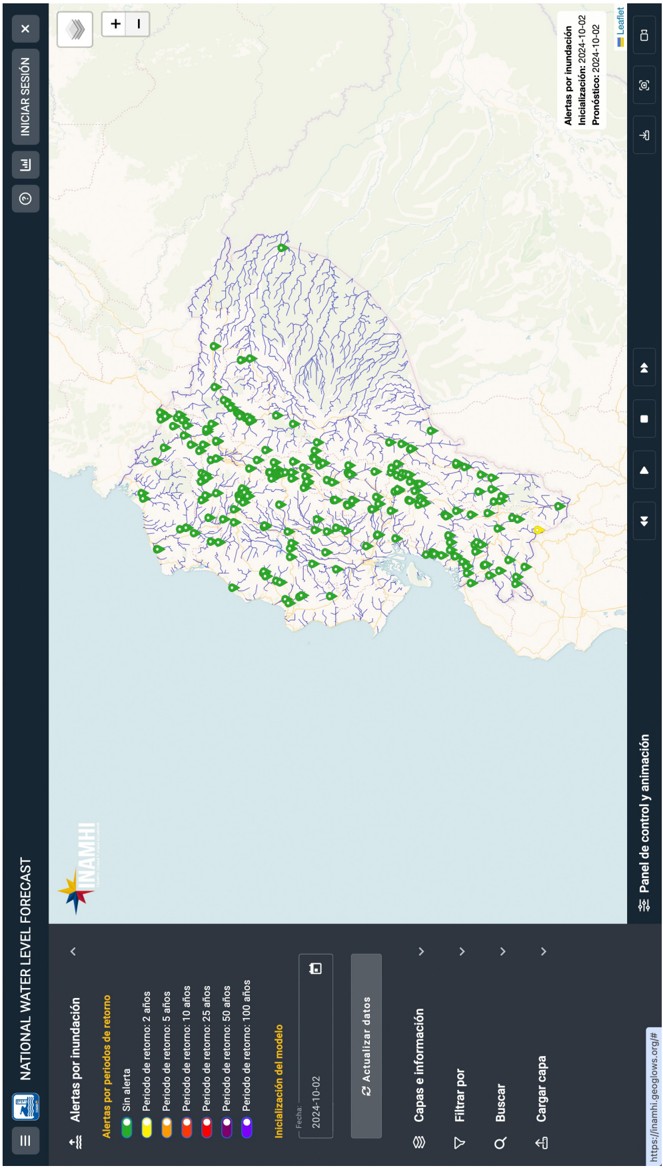
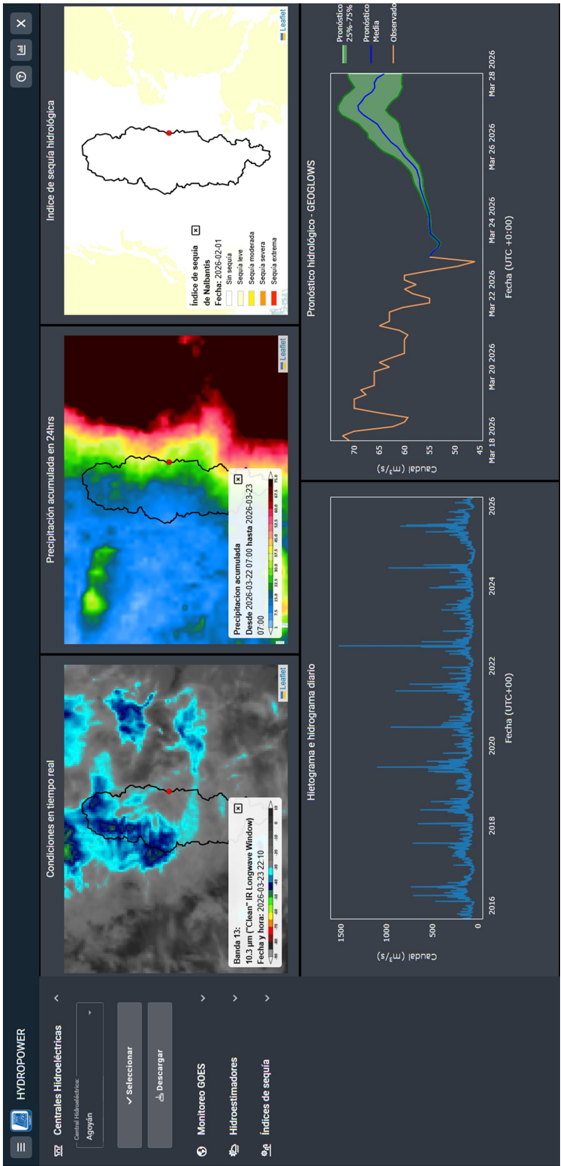
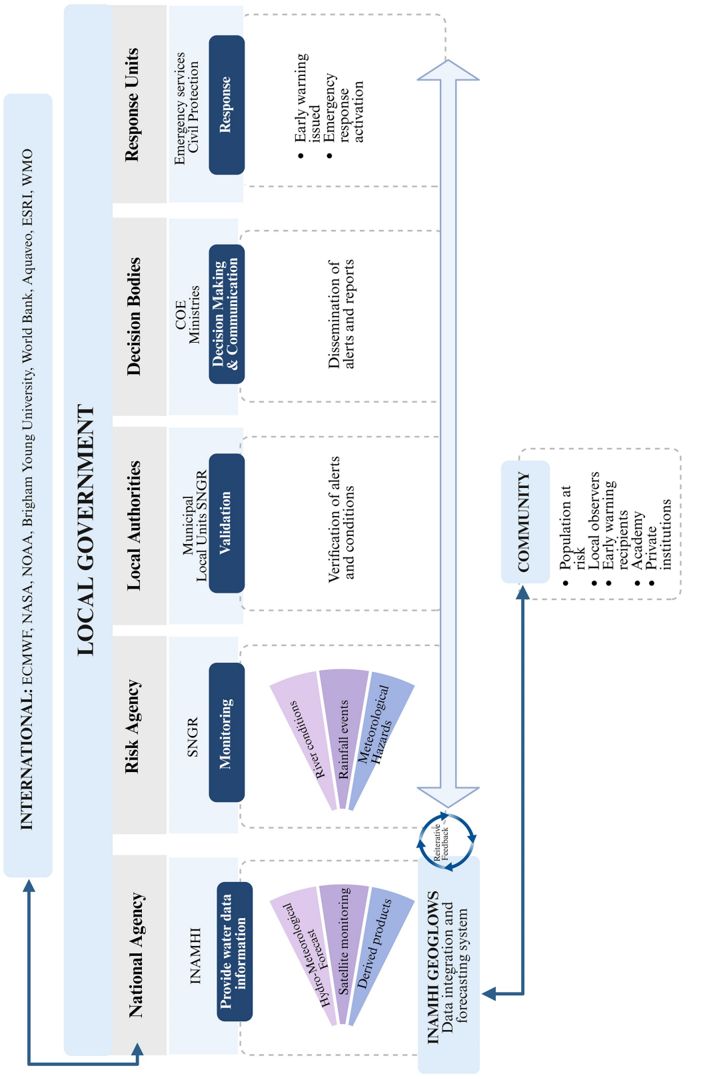
Recent advances in global hydrometeorological modelling and remote sensing have strengthened the monitoring and forecasting of extreme events, particularly where meteorological and hydrological observations are limited. In tropical regions such as Ecuador, steep topographic gradients, strong Pacific-Andes-Amazon contrasts, and pronounced interannual climate variability intensify exposure to floods, droughts, and other hydrometeorological hazards, highlighting the urgent need for integrated decision-support systems. In this regard, thanks to the NASA SERVIR-Amazonia initiative, open-source platforms have been developed to integrate hydrometeorological forecasts with satellite information and deliver actionable products across Ecuador, Brazil, Colombia, and Peru. This work presents the implementation of INAMHI GEOGLOWS in Ecuador, an open-source platform tailored to national needs and structured into five applications: Met Data Explorer, Hydroviewer, Historical Validation Tool, National Water Level Forecast, and Hydropower. The platform integrates near-real-time GOES monitoring, the Flash Flood Guidance System (FFGS), satellite-based precipitation products, numerical weather prediction models, and the GEOGLOWS River Forecast System to support operational monitoring, visualization, forecasting, and informed risk decision-making. Operational records confirm the platform’s effectiveness, with approximately 40 validated flood-warning cases across 38 river basins during 2024–2025. The platform has strengthened interinstitutional capacity, enhancing decision support and interagency coordination through a strategic deployment approach, sustained institutional engagement, and capacity-building that enable long-term operationalization. The platform architecture and deployment strategy are designed to be scalable and transferable to other data-limited regions.
Overview
CoChat Summary
TL;DR
The paper describes INAMHI GEOGLOWS, an open-source multi-source hydrometeorological integration platform implemented in Ecuador under SERVIR-Amazonia, combining GEOGLOWS RFS, NWP, GOES, satellite precipitation, FFGS, and national observations into five web applications. It reports operational adoption in Ecuador with approximately 40 validated flood-warning cases across 38 river basins during 2024–2025 and capacity-building for over 350 technical staff, while outlining scalability and limitations.
Key findings
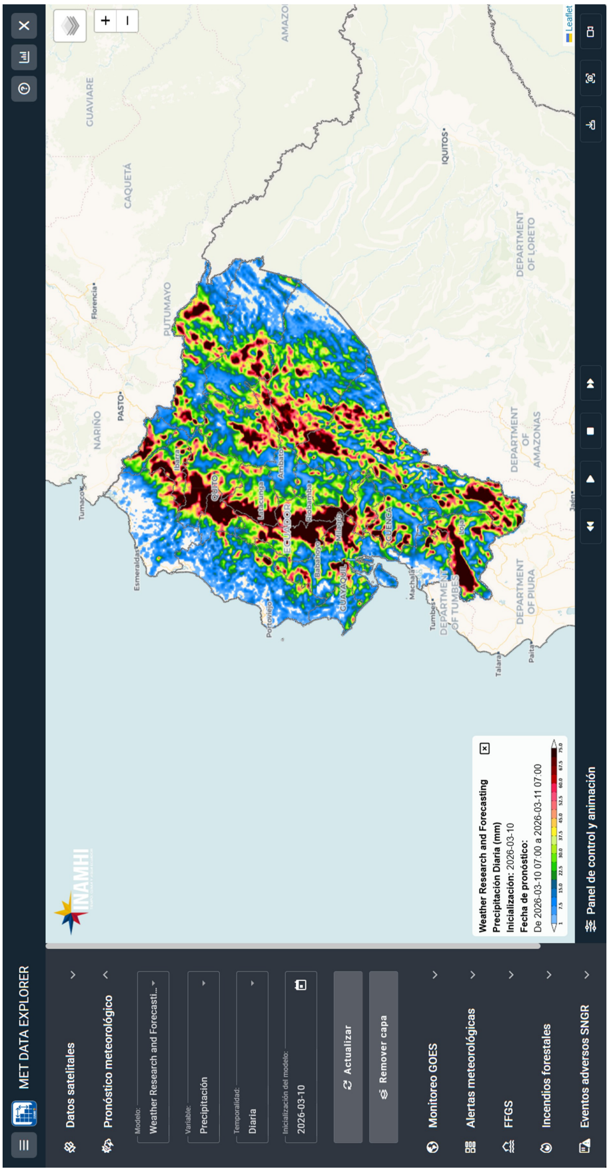
- The platform integrates five applications—Met Data Explorer, Hydroviewer, Historical Validation Tool, National Water Level Forecast, and Hydropower—and uses GEOGLOWS RFS streamflow as the core flood/drought forecast signal, with the GEOGLOWS drainage network clipped to Ecuador yielding approximately 12,000 river reaches.
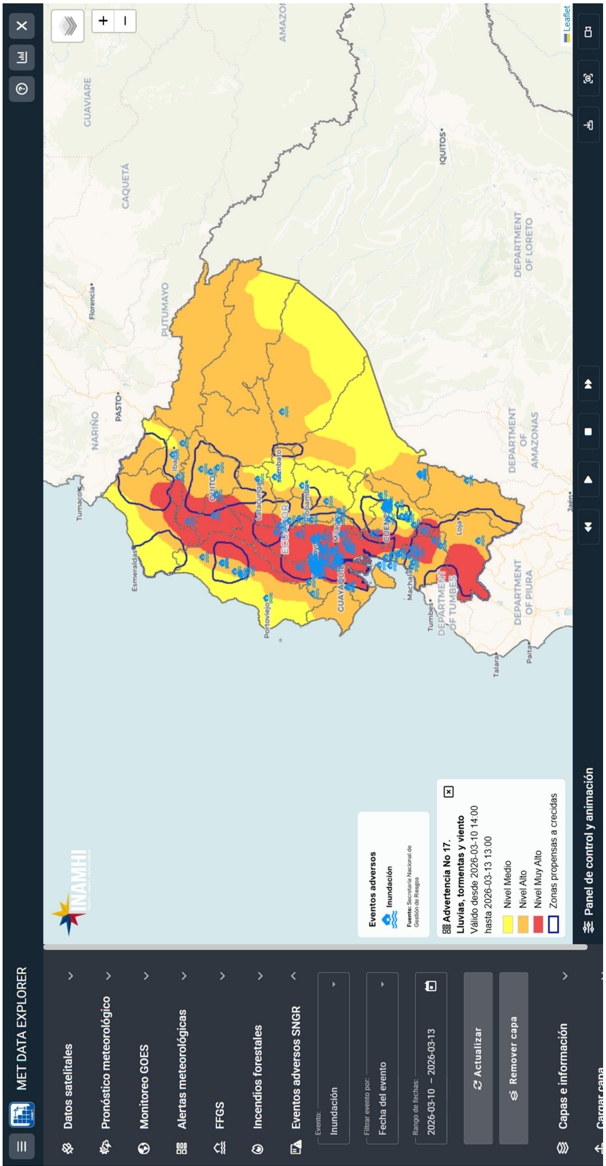
- Operational records from SNGR indicate approximately 40 validated flood-warning cases across 38 river basins during 2024–2025, integrated into an operational verification chain with monitoring shifts, local focal-point validation, technical reports, and impact assessments every two hours.
- Since the platform’s 2022 launch, capacity-building included more than 30 in-person and virtual training sessions and over 350 technical staff trained across INAMHI, SNGR, CENACE, MAG, MAE, ARCA, and universities.
- The platform expanded beyond floods during the 2024 drought and energy crisis, supporting hydropower decision-making for CENACE and wildfire monitoring during the September 2024 Quito outbreak; Colombia, Peru, and Brazil implementations remained more institutionally focused and less multi-sector integrated.
Methods
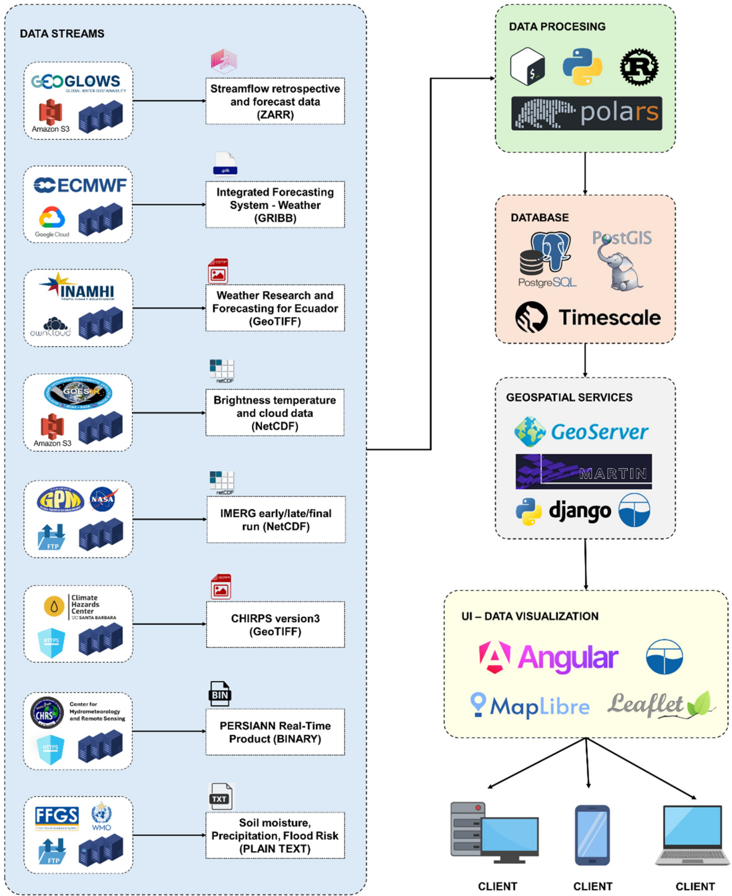
- Design: technical implementation and operational deployment case study of INAMHI GEOGLOWS, structured into data processing, database management, web-based geospatial services, and data visualization, with five operational web applications.
- Data/sample: external streams include GEOGLOWS RFS (retrospective daily streamflow from 1940 to present; 51-member 15-day 3-hourly forecasts; high-resolution 10-day hourly member), ECMWF IFS HRES (~9 km, 137 vertical levels, 4× daily, 10 days), INAMHI WRF (9 km outer, 3 km and 3 km nested, 72 hours), GOES-19 ABI/GLM, IMERG/PERSIANN/CHIRPS, FFGS, INAMHI meteorological warnings, SNGR extreme-event records, and approximately 230 INAMHI gauging stations; HVT uses over 180 stations from a ~250-station network, NWLF uses over 250 stations, with average record length ~33 years and ~29% missing data.
- Analysis: operational records from SNGR for validated flood-warning cases; bias correction via Monthly Flow Duration Curve Quantile Mapping (MFDC-QM) and Discharge-to-Water Level Transformation (DWLT); web services via Python Django, GeoServer, and Martin; warning thresholds based on 2-, 5-, 10-, 25-, and 50-year return periods, with Ecuador’s Hydroviewer locally refined from >50% to 40% ensemble exceedance.
Limitations
- Stated in the paper: long-term sustainability requires continuous investment in personnel, infrastructure, and data services; project-based implementations risk degradation without institutional commitment; warning thresholds rely primarily on return-period thresholds from historical simulations and do not fully capture exposure, vulnerability, local hydraulic conditions, or recent hydrological changes; in-situ observations are sparse, and satellite altimetry/SWOT could help expand coverage.
- Evident from the text: the paper reports operational case counts and platform descriptions but does not present systematic forecast skill scores or quantitative validation metrics (e.g., RMSE, NSE, KGE values) for the platform, although HVT computes such metrics.
- Evident from the text: the detailed operational integration and multi-hazard expansion are demonstrated mainly for Ecuador; transferability claims rest on less-developed implementations in Colombia, Peru, and Brazil, where the text notes lower levels of multi-sector integration and public-facing functionality.
Model-written summary. Check it against the paper before relying on it.
Integrity signals
Registry
Cites
Statistics
Figures
Verification
Claims the paper makes
0 Valid · 2 Not valid · 23 Not checked · 95 Own results and interpretations
A result the paper states — it cites no source for it, so there is none to check. The quote shows it is in the paper.
In the paper
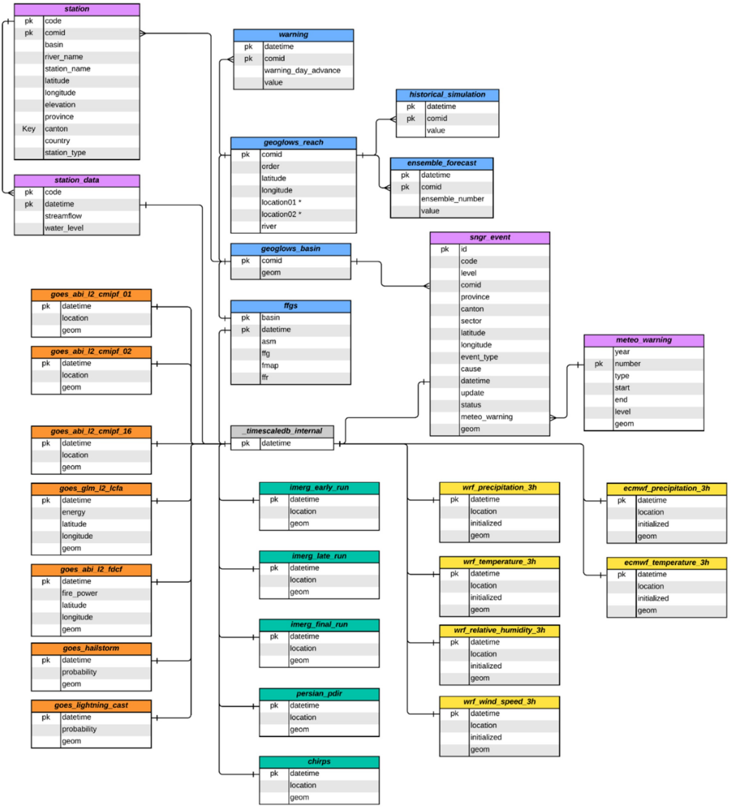
“Developed as a relational database in PostgreSQL, it is optimized for high-frequency time series and spatiotemporal data using TimescaleDB and PostGIS.”
§ From Data Streams to Decisions: Multi-Source Hydrometeorological Integration Platforms for Interagency Risk-Management Capacity Building in Data-Limited Regions > 3.2 Database
plain- Asserted: passes — The authors put it forward as true.
- Checkable: passes — It can be checked against evidence.
- Load-bearing: unclear — It is unclear whether the paper’s conclusions depend on it.
- Based: passes — The paper gives a reason why it holds.
In the paper
“Although the platform was initially designed to support hydrological forecasting and flood monitoring, its operational adoption expanded rapidly into other sectors and hazard domains during the extreme hydroclimatic conditions of 2024 [58].”
§ From Data Streams to Decisions: Multi-Source Hydrometeorological Integration Platforms for Interagency Risk-Management Capacity Building in Data-Limited Regions > 4.4 Sectoral adoption and multi-hazard expansion
What the sources say
- Not matchedcites [58] Fundación Ecuatoriana de Estudios Ecológicos EcoCiencia. Una plataforma clave para el pronóstico meteorológico y de incendios en el Ecuador [A key platform for meteorological and wildfire forecasting in Ecuador, author’s translation] [Internet]. Available from: https://ecociencia.org/una-plataforma-clave-para-el-pronostico-meteorologico-y-de-incendios-en-el-ecuador/ [Accessed: 2026-April-06]
Couldn’t be matched to a paper in Crossref, so it can’t be checked.
plainstates a cause- Asserted: passes — The authors put it forward as true.
- Checkable: passes — It can be checked against evidence.
- Load-bearing: passes — The paper’s conclusions depend on it.
- Based: passes — The paper gives a reason why it holds.
- Not matched
A result the paper states — it cites no source for it, so there is none to check. The quote shows it is in the paper.
In the paper
“These services were developed to publish dynamic geospatial products containing large numbers of features, particularly basin-and river-based datasets for which conventional Web Map Service (WMS) or Web Feature Service (WFS) approaches may become inefficient on the client side.”
§ From Data Streams to Decisions: Multi-Source Hydrometeorological Integration Platforms for Interagency Risk-Management Capacity Building in Data-Limited Regions > 3.3.3 Martin server-based services
hedgedstates a cause- Asserted: passes — The authors put it forward as true.
- Checkable: passes — It can be checked against evidence.
- Load-bearing: passes — The paper’s conclusions depend on it.
- Based: passes — The paper gives a reason why it holds.
A result the paper states — it cites no source for it, so there is none to check. The quote shows it is in the paper.
In the paper
“In Ecuador, this approach was operationalized by the National Institute of Meteorology and Hydrology (INAMHI) through the INAMHI GEOGLOWS platform, which customizes interoperable forecast-satellite workflows for national decision-making processes.”
§ From Data Streams to Decisions: Multi-Source Hydrometeorological Integration Platforms for Interagency Risk-Management Capacity Building in Data-Limited Regions > Flood Risk -Assessment, Management Strategies, and Emerging Technologies
plainstates a causeSingle case- Asserted: passes — The authors put it forward as true.
- Checkable: passes — It can be checked against evidence.
- Load-bearing: passes — The paper’s conclusions depend on it.
- Based: passes — The paper gives a reason why it holds.
A result the paper states — it cites no source for it, so there is none to check. The quote shows it is in the paper.
In the paper
“This approach enables interactive exploration of drought conditions across the national basin network.”
§ From Data Streams to Decisions: Multi-Source Hydrometeorological Integration Platforms for Interagency Risk-Management Capacity Building in Data-Limited Regions > 3.3.3 Martin server-based services
plainstates a cause- Asserted: passes — The authors put it forward as true.
- Checkable: passes — It can be checked against evidence.
- Load-bearing: unclear — It is unclear whether the paper’s conclusions depend on it.
- Based: passes — The paper gives a reason why it holds.
60 more claims
Create a free account to see all 120 claims and to verify the 33 references still open.
- It may state two separate claims as one. 38
- Probably not a substantial claim. 23
- The quote only partly states this claim. 1
Self-check
Percentages, sums and reported differences re-computed from the paper’s own numbers.
Each contradiction between two passages listed here was confirmed by an independent check.
Rated minor: it would not touch a result — a value no result rests on, a p-value that stays on the same side of the significance level, or a conflict that is clerical, resolved elsewhere in the paper, or outside its own findings.
In the paper
“These cases spanned 38 river basins”
§ From Data Streams to Decisions: Multi-Source Hydrometeorological Integration Platforms for Interagency Risk-Management Capacity Building in Data-Limited Regions > 4.3 Operational use cases and early warning performance
Reported 38 · recomputed 37
Rated minor: it would not touch a result — a value no result rests on, a p-value that stays on the same side of the significance level, or a conflict that is clerical, resolved elsewhere in the paper, or outside its own findings.
In the paper
§ From Data Streams to Decisions: Multi-Source Hydrometeorological Integration Platforms for Interagency Risk-Management Capacity Building in Data-Limited Regions > 2.7 Observed streamflow and water level data
“This dataset comprises in situ river streamflow and water-level observations from approximately 230 gauging stations across Ecuador”
§ From Data Streams to Decisions: Multi-Source Hydrometeorological Integration Platforms for Interagency Risk-Management Capacity Building in Data-Limited Regions > Flood Risk -Assessment, Management Strategies, and Emerging Technologies
“the application incorporates water-level data from over 250 gauging stations, representing a subset of the national monitoring network selected based on data availability.”
Rated minor: it would not touch a result — a value no result rests on, a p-value that stays on the same side of the significance level, or a conflict that is clerical, resolved elsewhere in the paper, or outside its own findings.
In the paper
§ From Data Streams to Decisions: Multi-Source Hydrometeorological Integration Platforms for Interagency Risk-Management Capacity Building in Data-Limited Regions > 3.1.1 GEOGLOWS river forecast system (RFS)
“Streamflow correction employs the Monthly Flow Duration Curve Quantile Mapping (MFDC-QM) method proposed by Sanchez-Lozano et al. [46]”
§ From Data Streams to Decisions: Multi-Source Hydrometeorological Integration Platforms for Interagency Risk-Management Capacity Building in Data-Limited Regions > References
“46. Norbiato D, Borga M, Dinale R. Flash flood warning in ungauged basins by use of the flash flood guidance and model-based runoff thresholds.”
Rated minor: it would not touch a result — a value no result rests on, a p-value that stays on the same side of the significance level, or a conflict that is clerical, resolved elsewhere in the paper, or outside its own findings.
In the paper
§ From Data Streams to Decisions: Multi-Source Hydrometeorological Integration Platforms for Interagency Risk-Management Capacity Building in Data-Limited Regions > 3.1.2 Numerical weather prediction (NWP) models
“processed files are stored following a standardized naming convention that preserves two key temporal attributes: the model initialization time and the forecast valid time.File names follow the pattern YYYYMMDD_YYYYMMDDHHMM.tif”
§ From Data Streams to Decisions: Multi-Source Hydrometeorological Integration Platforms for Interagency Risk-Management Capacity Building in Data-Limited Regions > 2.2 Numerical weather prediction (NWP) models
“It is initialized four times daily (00, 06, 12, and 18 UTC)”
Rated minor: it would not touch a result — a value no result rests on, a p-value that stays on the same side of the significance level, or a conflict that is clerical, resolved elsewhere in the paper, or outside its own findings.
In the paper
§ From Data Streams to Decisions: Multi-Source Hydrometeorological Integration Platforms for Interagency Risk-Management Capacity Building in Data-Limited Regions > 3.1.1 GEOGLOWS river forecast system (RFS)
“Water level correction employs the Discharge-to-water level transformation (DWLT) methodology developed by Rojas et al. [47]”
§ From Data Streams to Decisions: Multi-Source Hydrometeorological Integration Platforms for Interagency Risk-Management Capacity Building in Data-Limited Regions > References
“47. Sanchez Lozano JL, Rojas Lesmes DJ, Romero Bustamante EG, Hales RC, Nelson EJ, Williams GP, et al. Historical simulation performance evaluation and monthly flow duration curve quantile-mapping (MFDC-QM) of the GEOGLOWS ECMWF streamflow hydrologic model.”
1 more finding
Create a free account to see every finding of this check.
Citations
Cites
Hersbach, H., Bell, B., Berrisford, P., Hirahara, S., Horányi, A., Muñoz‐Sabater, J., Nicolas, J., Peubey, C., Radu, R., Schepers, D., et al. (2020) · Quarterly Journal of the Royal Meteorological Society · doi:10.1002/qj.3803 · Cited by 31,882
(IPCC), I. P. O. C. C. (2023) · doi:10.1017/9781009157896 · Cited by 6,972
The quiet revolution of numerical weather prediction
Bauer, P., Thorpe, A., & Brunet, G. (2015) · Nature · doi:10.1038/nature14956 · Cited by 2,729
Assessment of Hydrological Drought Revisited
Nalbantis, I., & Tsakiris, G. (2009) · Water Resources Management · doi:10.1007/s11269-008-9305-1 · Cited by 914
GloFAS – global ensemble streamflow forecasting and flood early warning
Alfieri, L., Burek, P., Dutra, E., Krzeminski, B., Muraro, D., Thielen, J., & Pappenberger, F. (2013) · Hydrology and Earth System Sciences · doi:10.5194/hess-17-1161-2013 · Cited by 582
INTRODUCING THE NEXT-GENERATION ADVANCED BASELINE IMAGER ON GOES-R
Schmit, T. J., Gunshor, M. M., Menzel, W. P., Gurka, J. J., Li, J., & Bachmeier, A. S. (2005) · Bulletin of the American Meteorological Society · doi:10.1175/bams-86-8-1079 · Cited by 534
The GOES-R Geostationary Lightning Mapper (GLM)
Goodman, S. J., Blakeslee, R. J., Koshak, W. J., Mach, D., Bailey, J., Buechler, D., Carey, L., Schultz, C., Bateman, M., McCaul, E., et al. (2013) · Atmospheric Research · doi:10.1016/j.atmosres.2013.01.006 · Cited by 526
Hydrogeomorphic response to extreme rainfall in headwater systems: Flash floods and debris flows
Borga, M., Stoffel, M., Marchi, L., Marra, F., & Jakob, M. (2014) · Journal of Hydrology · doi:10.1016/j.jhydrol.2014.05.022 · Cited by 516
GloFAS-ERA5 operational global river discharge reanalysis 1979–present
Harrigan, S., Zsoter, E., Alfieri, L., Prudhomme, C., Salamon, P., Wetterhall, F., Barnard, C., Cloke, H., & Pappenberger, F. (2020) · Earth System Science Data · doi:10.5194/essd-12-2043-2020 · Cited by 481
Recent intensification of Amazon flooding extremes driven by strengthened Walker circulation.
Barichivich, J., Gloor, E., Peylin, P., Brienen, R. J. W., Schöngart, J., Espinoza, J. C., & Pattnayak, K. C. (2018) · Science Advances · doi:10.1126/sciadv.aat8785 · Cited by 352
Altenau, E. H., Pavelsky, T. M., Durand, M. T., Yang, X., Frasson, R. P. D. M., & Bendezu, L. (2021) · Water Resources Research · doi:10.1029/2021wr030054 · Cited by 317
River Network Routing on the NHDPlus Dataset
David, C. H., Maidment, D. R., Niu, G.-Y., Yang, Z.-L., Habets, F., & Eijkhout, V. (2011) · Journal of Hydrometeorology · doi:10.1175/2011jhm1345.1 · Cited by 249
IMERG V06: Changes to the Morphing Algorithm
Tan, J., Huffman, G. J., Bolvin, D. T., & Nelkin, E. J. (2019) · Journal of Atmospheric and Oceanic Technology · doi:10.1175/jtech-d-19-0114.1 · Cited by 231
Contrasting regional discharge evolutions in the Amazon basin (1974–2004)
Espinoza Villar, J. C., Guyot, J. L., Ronchail, J., Cochonneau, G., Filizola, N., Fraizy, P., Labat, D., de Oliveira, E., Ordoñez, J. J., & Vauchel, P. (2009) · Journal of Hydrology · doi:10.1016/j.jhydrol.2009.03.004 · Cited by 215
Nguyen, P., Ombadi, M., Gorooh, V. A., Shearer, E. J., Sadeghi, M., Sorooshian, S., Hsu, K., Bolvin, D. T., & Ralph, M. F. (2020) · Journal of Hydrometeorology · doi:10.1175/jhm-d-20-0177.1 · Cited by 163
López-Bermeo, C., Montoya, R. D., Caro-Lopera, F. J., & Díaz-García, J. A. (2022) · Physics and Chemistry of the Earth Parts A/B/C · doi:10.1016/j.pce.2022.103184 · Cited by 151
ECLand: The ECMWF Land Surface Modelling System
Boussetta, S., Balsamo, G., Arduini, G., Dutra, E., McNorton, J., Choulga, M., Agustí‐Panareda, A., Beljaars, A. C. M., Wedi, N., Muñoz‐Sabater, J., et al. (2021) · Atmosphere · doi:10.3390/atmos12060723 · Cited by 148
Cavalcanti, I. F. A. (2012) · Atmospheric Research · doi:10.1016/j.atmosres.2012.06.012 · Cited by 127
Tanaka, T., Kiyohara, K., & Tachikawa, Y. (2020) · Journal of Hydrology · doi:10.1016/j.jhydrol.2020.124706 · Cited by 98
Norbiato, D., Borga, M., & Dinale, R. (2009) · Meteorological Applications · doi:10.1002/met.126 · Cited by 96
Wunderling, N., Staal, A., Sakschewski, B., Hirota, M., Tuinenburg, O. A., Donges, J. F., Barbosa, H. M. J., & Winkelmann, R. (2022) · Proceedings of the National Academy of Sciences · doi:10.1073/pnas.2120777119 · Cited by 95
ECMWF Activities for Improved Hurricane Forecasts
Magnusson, L., Bidlot, J., Bonavita, M., Brown, A. R., Browne, P. A., Chiara, G. D., Dahoui, M., Lang, S. T. K., McNally, T., Mogensen, K. S., et al. (2018) · Bulletin of the American Meteorological Society · doi:10.1175/bams-d-18-0044.1 · Cited by 94
CHIRPS: Rainfall Estimates from Rain Gauge and Satellite Observations
Climate Hazards Center (2025) · UC Santa Barbara · doi:10.15780/g2jq0p · Cited by 85
A new open source platform for lowering the barrier for environmental web app development
Swain, N. R., Christensen, S. D., Snow, A. D., Dolder, H., Espinoza-Dávalos, G., Goharian, E., Jones, N. L., Nelson, E. J., Ames, D. P., & Burian, S. J. (2016) · Environmental Modelling & Software · doi:10.1016/j.envsoft.2016.08.003 · Cited by 81
Self-citationMayer, M. J., Yang, D., & Szintai, B. (2023) · Applied Energy · doi:10.1016/j.apenergy.2023.121958 · Cited by 81
(2023) · Climate Change 2022 – Impacts, Adaptation and Vulnerability · doi:10.1017/9781009325844.014 · Cited by 76
Li, Z., Tang, G., Hong, Z., Chen, M., Gao, S., Kirstetter, P., Gourley, J. J., Wen, Y., Yami, T. L., Nabih, S., et al. (2021) · Journal of Hydrology · doi:10.1016/j.jhydrol.2021.125975 · Cited by 55
Ghozat, A., Sharafati, A., & Hosseini, S. A. (2022) · Environmental Science and Pollution Research · doi:10.1007/s11356-022-18773-3 · Cited by 53
de Coning, E. (2013) · Remote Sensing · doi:10.3390/rs5115702 · Cited by 51
Brêda, J. P. L. F., Cauduro Dias de Paiva, R., Siqueira, V. A., & Collischonn, W. (2023) · Journal of Hydrology · doi:10.1016/j.jhydrol.2023.129284 · Cited by 51
Georgakakos, K. P., Modrick, T. M., Shamir, E., Campbell, R., Cheng, Z., Jubach, R., Sperfslage, J. A., Spencer, C. R., & Banks, R. (2021) · Bulletin of the American Meteorological Society · doi:10.1175/bams-d-20-0241.1 · Cited by 48
Sanchez Lozano, J., Romero Bustamante, G., Hales, R. C., Nelson, E. J., Williams, G. P., Ames, D. P., & Jones, N. L. (2021) · Hydrology · doi:10.3390/hydrology8020071 · Cited by 46
Self-citationSouffront Alcantara, M. A., Nelson, E. J., Shakya, K., Edwards, C., Roberts, W., Krewson, C., Ames, D. P., Jones, N. L., & Gutierrez, A. (2019) · Frontiers in Environmental Science · doi:10.3389/fenvs.2019.00158 · Cited by 45
Self-citationEvaluation of Flood Prediction Capability of the WRF-Hydro Model Based on Multiple Forcing Scenarios
Sun, M., Li, Z., Yao, C., Liu, Z., Wang, J., Hou, A., Zhang, K., Huo, W., & Liu, M. (2020) · Water · doi:10.3390/w12030874 · Cited by 31
Llauca, H., Leon, K., & Lavado-Casimiro, W. (2023) · Journal of Hydrology: Regional Studies · doi:10.1016/j.ejrh.2023.101381 · Cited by 29
Lozano, J. L. S., Lesmes, D. J. R., Bustamante, E. G. R., Hales, R. C., Nelson, E. J., Williams, G. P., Ames, D. P., Jones, N. L., Gutierrez, A. L., & Almeida, C. C. (2024) · Environmental Modelling & Software · doi:10.1016/j.envsoft.2024.106235 · Cited by 25
Self-citationPetry, I., Miranda, P. T., Paiva, R. C. D., Collischonn, W., Fan, F. M., Fagundes, H. O., Araujo, A. A., & Souza, S. (2025) · Geophysical Research Letters · doi:10.1029/2024gl112436 · Cited by 22
Tian, K., Wang, Z., Li, F., Gao, Y., Xiao, Y., & Liu, C. (2021) · Remote Sensing · doi:10.3390/rs13061124 · Cited by 20
The great 1983 floods in South American large rivers: a continental hydrological modelling approach
Fleischmann, A. S., Siqueira, V. A., Wongchuig-Correa, S., Collischonn, W., & Paiva, R. C. D. D. (2020) · Hydrological Sciences Journal · doi:10.1080/02626667.2020.1747622 · Cited by 19
SABER: A Model-Agnostic Postprocessor for Bias Correcting Discharge from Large Hydrologic Models
Hales, R. C., Sowby, R. B., Williams, G. P., Nelson, E. J., Ames, D. P., Dundas, J. B., & Ogden, J. (2022) · Hydrology · doi:10.3390/hydrology9070113 · Cited by 19
Self-citationPetry, I., Fan, F. M., & Wood, A. W. (2025) · Communications Earth & Environment · doi:10.1038/s43247-025-02714-2 · Cited by 18
Random forest-based rainfall retrieval for Ecuador using GOES-16 and IMERG-V06 data
Turini, N., Thies, B., Horna, N., & Bendix, J. (2021) · European Journal of Remote Sensing · doi:10.1080/22797254.2021.1884002 · Cited by 15
Forecasting annual maximum water level for the Negro River at Manaus
Chevuturi, A., Klingaman, N. P., Rudorff, C. M., Coelho, C. A. S., & Schöngart, J. (2022) · Climate Resilience and Sustainability · doi:10.1002/cli2.18 · Cited by 10
Jones, J. E., Hales, R. C., Larco, K., Nelson, E. J., Ames, D. P., Jones, N. L., & Iza, M. (2023) · Water · doi:10.3390/w15030411 · Cited by 6
Self-citationRojas-Lesmes, D., Sanchez-Lozano, J., Nelson, E. J., Chancay-Sanchez, J., Rodriguez-Chaves, J., Larco-Erazo, K., Romero, E. G., Trujillo-Vela, M., Hales, R. C., Ames, D. P., et al. (2025) · Information Geography · doi:10.1016/j.infgeo.2025.100008 · Cited by 6
Self-citationThe Second Generation Geoglows River Forecast SystemPreprint
Hales, R. C., Nelson, E. J., Kopp, S., Levin, H. K., Morris, A. L., Souffront, M., Gutierrez, A. L., Magoffin, R. H., Rosas, L. R., & Baaniya, Y. (2025) · SSRN Electronic Journal · doi:10.2139/ssrn.5257837 · Cited by 6
Self-citationLesmes, D. J. R., Lozano, J. L. S., Nelson, J., Trujillo-Vela, M. G., Williams, G. P., Ames, D. P., Jones, N. L., Gutierrez, A. L., Bustamante, E. G. R., & Hales, R. C. (2024) · doi:10.22541/essoar.173532353.33602073/v1 · Cited by 5
Self-citationNaranjo-Silva, S., Punina-Guerrero, D. J., Jácome, E., Segovia, K. F. E., & Laverde-Albarracín, C. (2026) · Sustainability · doi:10.3390/su18042112 · Cited by 5
Bui‐Manh, H., Huang, W., Chiang, T., Koralegedara, S. B., & Dinh, D. (2025) · Journal of Applied Meteorology and Climatology · doi:10.1175/jamc-d-25-0073.1 · Cited by 4
Identifying the Drought Impact Factors and Developing Drought Scenarios Using the DSD Model
Lim, S., Lee, S., & Jung, D. (2021) · Water Resources Management · doi:10.1007/s11269-021-02943-y · Cited by 3
Deval, C., Anderson, E., Kruskopf, M., Limaye, A., Bhandari, B., Markert, A., Flores-Anderson, A., Muthike, D., Basu, R., Shrestha, M., et al. (2024) · doi:10.22541/essoar.172070626.66463831/v1 · Cited by 2
Sanchez Lozano, J. L., Chancay, J. E., Rojas Lesmes, D. J., Romero Bustamante, E. G., Nelson, E. J., Trujillo-Vela, M. G., Larco, K., Hales, R. C., Souffront, M. A., & Gutierrez, A. L. (2027) · GeoHorizons · doi:10.1144/gh2025-14 · Cited by 2
Self-citationEnhancing Local Hydrological Services with the GEOGloWS ECMWF Global Hydrologic Model
Lozano, J. L. S. (2023) · ScholarsArchive (Brigham Young University) · Cited by 2
Modeling of an Extreme Flooding Event in the Amazon Basin Using the WRF-Hydro Model
Vieira, C. S., da Silva, J. R. D., Silva, D. G., de Souza, F. M., Ramos, D. N. D. S., Kitagawa, Y. K. L., & Moreira, D. M. (2022) · Journal of Bioengineering, Technologies and Health · doi:10.34178/jbth.v5i2.210 · Cited by 1
Basu, R., Deval, C., Carey, L., Anderson, E., Kremer, A., & Gutierrez, A. (2026) · Environmental Research Communications · doi:10.1088/2515-7620/ae53ad · Cited by 1
(2021) · Open Water Journal
Self-citation
Research works printed but not linked: 1
- Hydroweb. Water levels of rivers and lakes [Dataset]. 2023. DOI: 10.24400/329360/HYDROWEB_WATER_LEVEL · doi:10.24400/329360/hydroweb_water_level
Cited by
Still being checked.
Metadata
- Authors
- Chancay, J. E., Sánchez-Lozano, J., Dawson, K. L., Rojas-Lesmes, D., Cárdenas, C., Iza, A. M., Rodríguez, A., Navarrete, A., Quispillo, M., Torres, R., Josse, C., Erazo, B., Romero, G., Hales, R. C., Nelson, E. J., & Gutiérrez, A. L.
- Affiliations
- EcoCiencia (EC)
- Brigham Young University (US)
- Venue
- Earth Sciences
- Publisher
- IntechOpen
- Published
- 2026-05-25
- ISSN
- 3049-8848
- OpenAlex
- W7162394851
- Cited by
- 0
- References
- 56
- FWCI
- 0.00
- Type
- book chapter
- Language
- en
- Open access
- diamond
- doi.org
- Locations
- IntechOpen eBooks (publishedVersion, cc-by)
- Funders
- National Aeronautics and Space Administration
- United States Agency for International Development
- Brigham Young University
- Topics
- Physical Sciences › Environmental Science › Global and Planetary Change › Flood Risk Assessment and Management
- Physical Sciences › Environmental Science › Management, Monitoring, Policy and Law › Environmental Monitoring and Data Management
- Physical Sciences › Environmental Science › Water Science and Technology › Hydrology and Watershed Management Studies
- Keywords
- hydrometeorological forecasting, decision support system, flood early warning, GEOGloWS, open-source platform, inter-agency coordination, capacity building, data-limited regions, satellite precipitation products, numerical weather prediction, river level forecasting, hydropower, Ecuador, Amazon basin, interannual climate variability
About these checks
Registry, retraction, Cites and statistics results are computed, not judged, with one exception: a printed reference that no index lists is read once by a model before it counts as a citation error. Claims are extracted by a model and kept only when their quote appears verbatim in the text; each cited source is then checked, with a model’s help, for whether it says what the claim relies on. Those verdicts can be wrong — read the claim’s quote and the cited source before relying on one.
A language model drew the claims from the paper on 2026-11-19, under version 3 of the claim definition (model deepseek-v4.1-flash, prompt extract-v3).
A second model labelled each claim on 2026-11-19 (model jev-1.13-20260917, definition revision gold-guideline-v0.2).
Statistics and arithmetic are recomputed, not judged.
Confidence bands are shown only for fields calibrated on our annotated test set. None is calibrated yet, so no band is shown.
What counts as a claim ›How we measure confidence ›How we check this ›
Are you an author, or do you see a problem with this page? Request a review
Data sources
Bibliographic data: Semantic Scholar, OpenAlex, Crossref.
Contains information from the Semantic Scholar Academic Graph Datasets, made available under the ODC Attribution License (ODC-BY 1.0).
Semantic Scholar’s data is described in: Kinney, R., et al. (2023). The Semantic Scholar Open Data Platform. arXiv:2301.10140.
