

The DOI matches its Crossref record; 34 of the 34 references it cites were found in a registry or an index.
Financial costs and personal consequences of research misconduct resulting in retracted publications
Open accessAbstract
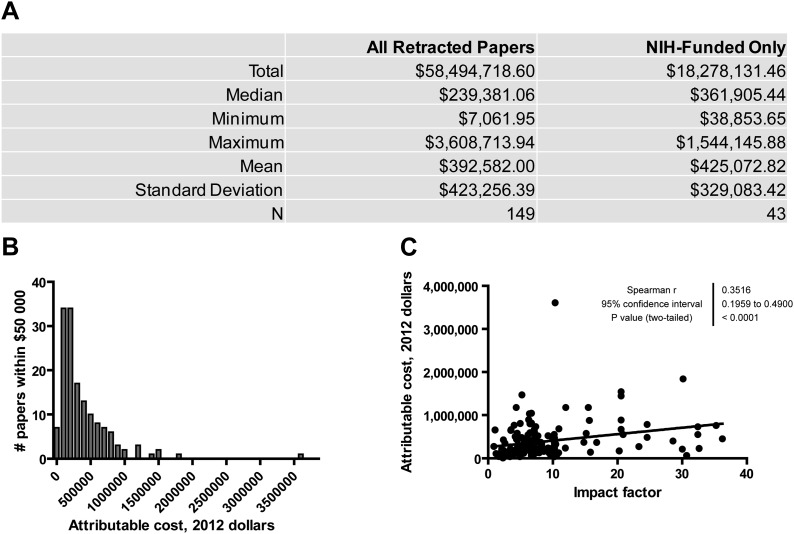
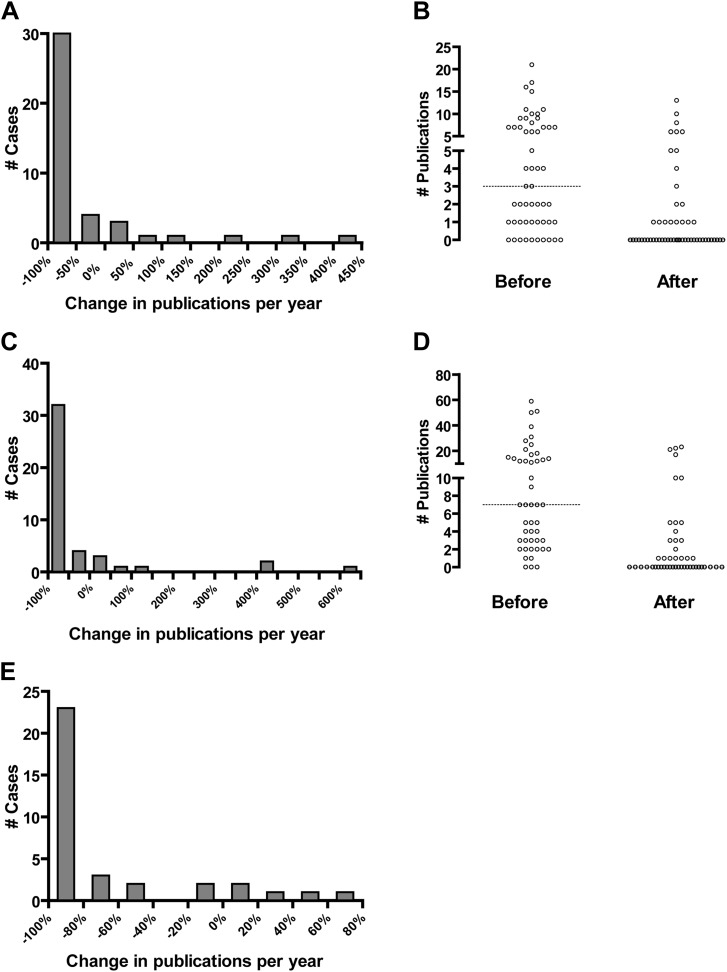
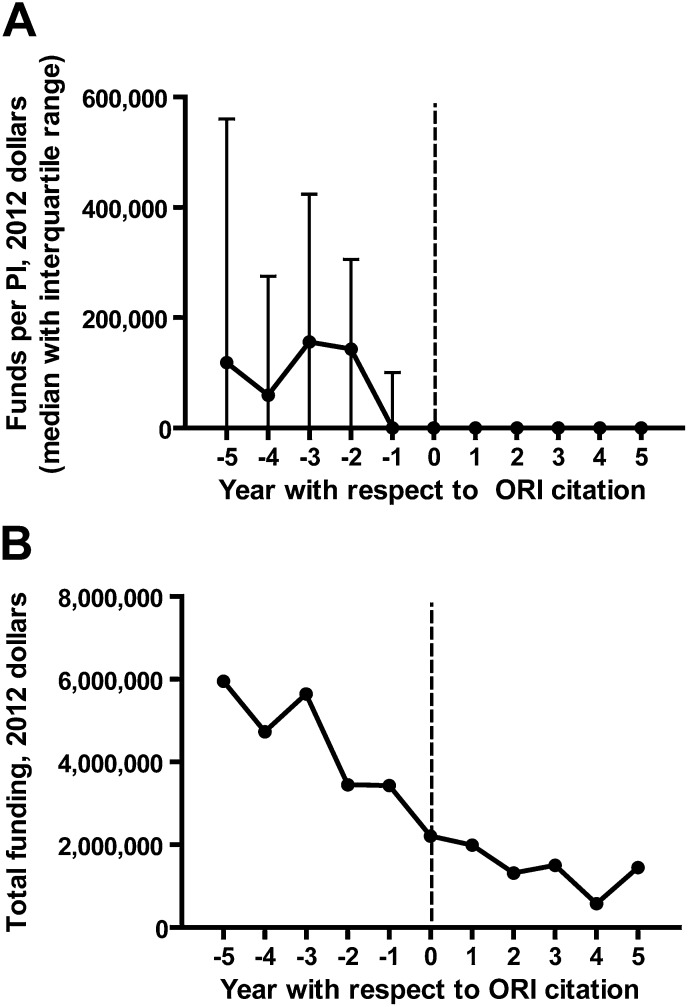
The number of retracted scientific articles has been increasing. Most retractions are associated with research misconduct, entailing financial costs to funding sources and damage to the careers of those committing misconduct. We sought to calculate the magnitude of these effects. Data relating to retracted manuscripts and authors found by the Office of Research Integrity (ORI) to have committed misconduct were reviewed from public databases. Attributable costs of retracted manuscripts, and publication output and funding of researchers found to have committed misconduct were determined. We found that papers retracted due to misconduct accounted for approximately $58 million in direct funding by the NIH between 1992 and 2012, less than 1% of the NIH budget over this period. Each of these articles accounted for a mean of $392,582 in direct costs (SD $423,256). Researchers experienced a median 91.8% decrease in publication output and large declines in funding after censure by the ORI.
Overview
The claims and statistics of this paper haven’t been checked yet.
Run the check — free, no account needed. It reads the open-access text and checks the sources it cites.
Integrity signals
Registry
Cites
Statistics
Figures
Verification
Claims the paper makes
The claims and statistics of this paper haven’t been checked yet.
Run the check — free, no account needed. It reads the open-access text and checks the sources it cites.
Claims other papers make about this one
Each is checked against this paper’s own text: does it say what the citing paper says it does?
The source backs part of the claim, not all of it — or backs it for a different population, condition or comparison.
In the citing paper
“retractions themselves impose substantial financial and scientific costs (Stern et al., 2014).”
From FLAWS: A Benchmark for Error Identification and Localization in Scientific Papers (2025) · cites this paper as Stern et al., 2014
Experimental — accuracy not yet measuredThe source backs part of the claim, not all of it — or backs it for a different population, condition or comparison.
In the citing paper
“Damage to reputation after retracting papers for any reason also plays a crucial role in faculty recruitment and philanthropy efforts [16].”
From Genetic Insights into the Economic Toll of Cell Line Misidentification: A Comprehensive Review (2026) · cites this paper as [16]
Experimental — accuracy not yet measuredThe cited source says what the claim attributes to it.
In the citing paper
“Stern and colleagues discussed the general financial costs of retracted articles that were funded by the NIH and calculated that each retracted articles accounted for a mean of $392,582 ± $423,256 [16].”
From Genetic Insights into the Economic Toll of Cell Line Misidentification: A Comprehensive Review (2026) · cites this paper as [16]
In the citing paper
“by one estimate $392 , 582 of financial loss for each retracted article [46].”
From BioFors: A Large Biomedical Image Forensics Dataset (2021) · cites this paper as [46]
Self-check
Percentages, sums and reported differences re-computed from the paper’s own numbers.
The self-check needs the paper’s full text.
Citations
Cites
5 retracted
Wakefield, A., Murch, S., Anthony, A., Linnell, J., Casson, D., Malik, M., Berelowitz, M., Dhillon, A., Thomson, M., Harvey, P., et al. (1998) · The Lancet · doi:10.1016/s0140-6736(97)11096-0 · Cited by 3,006
RetractedRetracted Science and the Retraction Index
Fang, F. C., & Casadevall, A. (2011) · Infection and Immunity · doi:10.1128/iai.05661-11 · Cited by 405 · cited 1×
“Impact factor exhibits a positive correlation with articles retracted for research misconduct or error (Fang and Casadevall, 2011; Fang et al., 2012).”
BackgroundSelf-citationRetractedRETRACTED: Transcription-Coupled Repair of 8-oxoGuanine
Page, F. L., Kwoh, E. E., Avrutskaya, A. V., Gentil, A., Leadon, S. A., Sarasin, A. R., & Cooper, P. K. (2000) · Cell · doi:10.1016/s0092-8674(00)80827-2 · Cited by 280 · cited 1×
“…this database that were retracted due to misconduct originating from the United States between 1992 and 2012, as well as one additional article originating from France (Le Page et al., 2000) that was retracted due to data falsification by a co-author (Steven Leadon) working in the United States.”
RetractedPage, F. L., Kwoh, E. E., Avrutskaya, A. V., Gentil, A., Leadon, S. A., Sarasin, A. R., & Cooper, P. K. (2005) · Cell · doi:10.1016/j.cell.2005.11.005 · Cited by 271
RetractedGene-expression patterns predict phenotypes of immune-mediated thrombosis
Potti, A., Bild, A., Dressman, H. K., LEWIS, D. A., Nevins, J. R., & Ortel, T. L. (2005) · Blood · doi:10.1182/blood-2005-07-2669 · Cited by 51 · cited 1×
“One outlier was found to have an attributable cost of $3.6 million (Potti et al., 2006).”
BackgroundInfluentialRetractedFanelli, D. (2009) · PLoS ONE · doi:10.1371/journal.pone.0005738 · Cited by 1,911 · cited 1×
“A meta-analysis of survey data indicates that approximately 2% of scientists admit to data falsification or manipulation on at least one occasion (Fanelli, 2009), whereas less than 0.02% of published data are retracted due to fabrication, falsification, or plagiarism (Claxton, 2005; Fang et al.,…”
InfluentialMisconduct accounts for the majority of retracted scientific publications
Fang, F. C., Steen, R. G., & Casadevall, A. (2012) · Proceedings of the National Academy of Sciences · doi:10.1073/pnas.1212247109 · Cited by 1,232 · cited 6×
“We examined the text of 291 articles originating from the United States and published between 1992 and 2012 that were retracted for research misconduct (Fang et al., 2012), and recorded NIH grant numbers cited in footnotes or acknowledgments.”
BackgroundInfluentialSelf-citationZarychanski, R., Abou-Setta, A. M., Turgeon, A. F., Houston, B. L., McIntyre, L., Marshall, J. C., & Fergusson, D. A. (2013) · JAMA · doi:10.1001/jama.2013.430 · Cited by 646 · cited 1×
“In another high-profile fraud case involving studies of the use of colloid for fluid resuscitation, there is evidence that the discredited body of work led to the use of a therapy with higher mortality and morbidity than standard care (Wise, 2013; Zarychanski et al., 2013).”
BackgroundWhy has the number of scientific retractions increased?
Steen, R. G., Casadevall, A., & Fang, F. C. (2013) · PLoS ONE · doi:10.1371/journal.pone.0068397 · Cited by 415 · cited 1×
“Whether the actual frequency of misconduct is increasing is unknown (Fanelli, 2013; Steen et al., 2013), but there is increasing interest in this subject given the occurrence of several high profile cases, the creation of websites that track retracted research, such as Retraction Watch (Oransky and…”
BackgroundSelf-citationLet's make science metrics more scientific
Lane, J. I. (2010) · Nature · doi:10.1038/464488a · Cited by 308 · cited 1×
“This problem has been noted previously (Falagas, 2006; Bourne and Fink, 2008; Lane, 2010; Polychronakos, 2012), and systems have been proposed for the disambiguation of authors with similar names (Fenner, 2011).”
BackgroundWhy Growing Retractions Are (Mostly) a Good Sign
Fanelli, D. (2013) · PLoS Medicine · doi:10.1371/journal.pmed.1001563 · Cited by 272 · cited 2×
“Whether the actual frequency of misconduct is increasing is unknown (Fanelli, 2013; Steen et al., 2013), but there is increasing interest in this subject given the occurrence of several high profile cases, the creation of websites that track retracted research, such as Retraction Watch (Oransky and…”
BackgroundInfluentialThe Retraction Penalty: Evidence from the Web of Science
Lu, S. F., Jin, G. Z., Uzzi, B., & Jones, B. (2013) · Scientific Reports · doi:10.1038/srep03146 · Cited by 191 · cited 1×
“A recent report demonstrated a significant decline in the citation of an author's work after one of his or her papers was retracted (Lu et al., 2013).”
BackgroundReforming Science: Methodological and Cultural Reforms
Casadevall, A., & Fang, F. C. (2012) · Infection and Immunity · doi:10.1128/iai.06183-11 · Cited by 156 · cited 3×
“It has been suggested that pressure to ‘publish or perish’ during times of scarce resources, increased competition and the winner-take-all economics of research may contribute to an atmosphere in which some individuals are tempted to commit misconduct (Casadevall and Fang, 2012).”
BackgroundInfluentialSelf-citationRetractions in the medical literature: how many patients are put at risk by flawed research?
Steen, R. G. (2011) · Journal of Medical Ethics · doi:10.1136/jme.2011.043133 · Cited by 156 · cited 1×
“Some studies indicate that hundreds of thousands of patients have been placed at risk of improper medical care due to enrollment in fraudulent studies or the administration of treatment based on fraudulent studies (Steen, 2011).”
BackgroundSelf-citationClaxton, L. D. (2004) · Mutation Research/Reviews in Mutation Research · doi:10.1016/j.mrrev.2004.07.003 · Cited by 123 · cited 1×
“…of survey data indicates that approximately 2% of scientists admit to data falsification or manipulation on at least one occasion (Fanelli, 2009), whereas less than 0.02% of published data are retracted due to fabrication, falsification, or plagiarism (Claxton, 2005; Fang et al., 2012).”
BackgroundInfluentialWise, J. (2013) · BMJ · doi:10.1136/bmj.f1738 · Cited by 110 · cited 1×
“In another high-profile fraud case involving studies of the use of colloid for fluid resuscitation, there is evidence that the discredited body of work led to the use of a therapy with higher mortality and morbidity than standard care (Wise, 2013; Zarychanski et al., 2013).”
BackgroundTrikalinos, N. A., Evangelou, E., & Ioannidis, J. P. A. (2008) · Journal of Clinical Epidemiology · doi:10.1016/j.jclinepi.2007.11.019 · Cited by 100
The Costs and Underappreciated Consequences of Research Misconduct: A Case Study
Michalek, A. M., Hutson, A. D., Wicher, C. P., & Trump, D. L. (2010) · PLoS Medicine · doi:10.1371/journal.pmed.1000318 · Cited by 93
Sources of error in the retracted scientific literature
Casadevall, A., Steen, R. G., & Fang, F. C. (2014) · The FASEB Journal · doi:10.1096/fj.14-256735 · Cited by 89 · cited 1×
“Honest retractions resulting from scientific error represent a mechanism for correction of the literature (Casadevall et al., 2014).”
BackgroundSelf-citationCouzin, J. (2006) · Science · doi:10.1126/science.313.5791.1222 · Cited by 48
Scientific Misconduct: Do the Punishments Fit the Crime?
Redman, B. K., & Merz, J. F. (2008) · Science · doi:10.1126/science.1158052 · Cited by 35 · cited 1×
“Recent studies of faculty and postdoctoral fellows indicate that research productivity declines after censure by the ORI, sometimes to zero, but that many of those who commit misconduct are able to find new jobs within academia (Redman and Merz, 2008, 2013).”
BackgroundResearch misconduct oversight: Defining case costs
Gammon, E., & Franzini, L. (2013) · PubMed · doi:10.13016/m22p1j · Cited by 26 · cited 1×
“Gammon and Franzini (2013) analyzed 17 cases using a mixed methods model to conclude that ORI cases incur financial costs ranging from Research | Financial costs and personal consequences of research misconduct resulting in retracted publications Stern et al. eLife 2014;3:e02956.”
MethodI Am Not a Scientist, I Am a Number
Bourne, P. E., & Fink, J. L. (2008) · PLoS Computational Biology · doi:10.1371/journal.pcbi.1000247 · Cited by 16
Fenner, M. H. (2011) · doi:10.53731/r294649-6f79289-8cw7e · Cited by 16
Effects of Findings of Scientific Misconduct on Postdoctoral Trainees
Redman, B. K., & Merz, J. F. (2013) · AJOB Primary Research · doi:10.1080/21507716.2013.804010 · Cited by 10
Unique Author Identification Number in Scientific Databases: A Suggestion
Falagas, M. E. (2006) · PLoS Medicine · doi:10.1371/journal.pmed.0030249 · Cited by 10 · cited 1×
“This problem has been noted previously (Falagas, 2006; Bourne and Fink, 2008; Lane, 2010; Polychronakos, 2012), and systems have been proposed for the disambiguation of authors with similar names (Fenner, 2011).”
BackgroundFinal findings of scientific misconduct.
(1993) · PubMed Central · Cited by 6
Integrity: misconduct by a few damages credibility for many
Nussenzveig, P., & Funchal, R. Z. (2008) · Nature · doi:10.1038/454574c · Cited by 6
Integrity: juniors see leaders gain from calculated dishonesty
Feder, N., & Stewart, W. W. (2008) · Nature · doi:10.1038/454574b · Cited by 6
Findings of scientific misconduct.
(1995) · PubMed Central · Cited by 3
Unique author identifier; what are we waiting for?
Polychronakos, C. (2012) · Journal of Medical Genetics · doi:10.1136/jmedgenet-2012-100736 · Cited by 2 · cited 1×
“This problem has been noted previously (Falagas, 2006; Bourne and Fink, 2008; Lane, 2010; Polychronakos, 2012), and systems have been proposed for the disambiguation of authors with similar names (Fenner, 2011).”
BackgroundFinding of scientific misconduct.
(1995) · PubMed Central · Cited by 1
(2010) · Nature · doi:10.1038/4661023a · Cited by 1
Fenner, M. (2011) · doi:10.53731/rq0dh-zz708
Research works printed but not linked: 1
- McWatt J. 2013. Measles epidemic costs health board £500,000. WalesOnline. http://www.walesonline.co.uk/news/wales-news/measles-epidemic-costs-health-board-4923520.
Cited by
Sorted by citations
The economics of reproducibility in preclinical research
Freedman, L. P., Cockburn, I. M., & Simcoe, T. S. (2015) · PLOS Biology · doi:10.1371/journal.pbio.1002165 · Cited by 1,055
“[21], even in cases of retracted publications due to scientific misconduct, which is not a major source of irreproducibility [13,22], “it is conceivable that some of the research resulting in a retracted article still provides useful information for other nonretracted”
BackgroundEdwards, M. A., & Roy, S. (2017) · Environmental Engineering Science · doi:10.1089/ees.2016.0223 · Cited by 688
Wu, Y., AbdAlmageed, W., & Natarajan, P. (2019) · IEEE Computer Society Conference on Computer Vision and Pattern Recognition/Proceedings - IEEE Computer Society Conference on Computer Vision and Pattern Recognition/Proceedings · doi:10.1109/cvpr.2019.00977 · Cited by 702
“In 2014, Stern et al. [41] estimate that each of the retracted articles could account for a mean of $ 392,582 in direct costs , implying much higher indirect costs caused by misled research—and this is only in the biomedical field and these numbers are five years out-dated.”
BackgroundThe carnage of substandard research during the COVID-19 pandemic: a call for quality
Bramstedt, K. A. (2020) · Journal of Medical Ethics · doi:10.1136/medethics-2020-106494 · Cited by 170
The visibility of scientific misconduct: A review of the literature on retracted journal articles
Hesselmann, F., Graf, V., Schmidt, M., & Reinhart, M. (2017) · Current Sociology · doi:10.1177/0011392116663807 · Cited by 153
“Stern et al. (2014) estimate the amount of NIH funding involved in publications that are retracted subsequently and find that between 1992 and 2012, no more than 0.02% of the NIH budget went to studies that were later retracted.”
BackgroundInfluential
Metadata
- Authors
- Stern, A. M., Casadevall, A., Steen, R. G., & Fang, F. C.
- Affiliations
- University of Pennsylvania (US)
- Albert Einstein College of Medicine (US)
- MediCC!, Medical Communications Consultants, LLC, Chapel Hill, United States
- University of Washington (US)
- Corresponding author
- Fang, Ferric C
- Venue
- eLife
- Publisher
- eLife Sciences Publications, Ltd
- Published
- 2014-08-14
- Volume
- 3
- Pages
- e02956-e02956
- ISSN
- 2050-084X (ISSN-L)
- PMC
- PMC4132287
- OpenAlex
- W1999131703
- Cited by
- 189
- References
- 33
- Citations by year
- 2026: 17 · 2025: 14 · 2024: 16 · 2023: 19 · 2022: 16 · 2021: 21 · 2020: 16 · 2019: 19 · 2018: 11 · 2017: 8 · 2016: 14 · 2015: 14 · 2014: 4
- FWCI
- 37.24
- Type
- journal article
- Language
- en
- Open access
- gold
- doi.org
- Licence
- Locations
- eLife (publishedVersion, cc-by)
- PubMed Central (publishedVersion, cc-by)
- PubMed (publishedVersion)
- DOAJ (DOAJ: Directory of Open Access Journals) (submittedVersion, cc-by-sa)
- Funders
- National Institutes of Health
- Topics
- Social Sciences › Education › Academic integrity and plagiarism
- Social Sciences › Library and Information Sciences › Academic Publishing and Open Access
- Social Sciences › Library and Information Sciences › scientometrics and bibliometrics research
- Keywords
- research misconduct, retracted article, financial costs, research funding, Office of Research Integrity, publication output, career outcomes, NIH funding, research integrity
- MeSH terms
- Humans, Retraction of Publication as Topic, United States, Scientific Misconduct, Databases, Factual, United States Office of Research Integrity, Biomedical Research
About these checks
Registry, retraction, Cites and statistics results are computed, not judged, with one exception: a printed reference that no index lists is read once by a model before it counts as a citation error. Claims are extracted by a model and kept only when their quote appears verbatim in the text; each cited source is then checked, with a model’s help, for whether it says what the claim relies on. Those verdicts can be wrong — read the claim’s quote and the cited source before relying on one.
Statistics and arithmetic are recomputed, not judged.
Confidence bands are shown only for fields calibrated on our annotated test set. None is calibrated yet, so no band is shown.
What counts as a claim ›How we measure confidence ›How we check this ›
Are you an author, or do you see a problem with this page? Request a review
