

The DOI matches its Crossref record; 40 of the 40 references it cites were found in a registry or an index.
Complexin inhibits spontaneous release and synchronizes Ca2+-triggered synaptic vesicle fusion by distinct mechanisms
Open accessAbstract
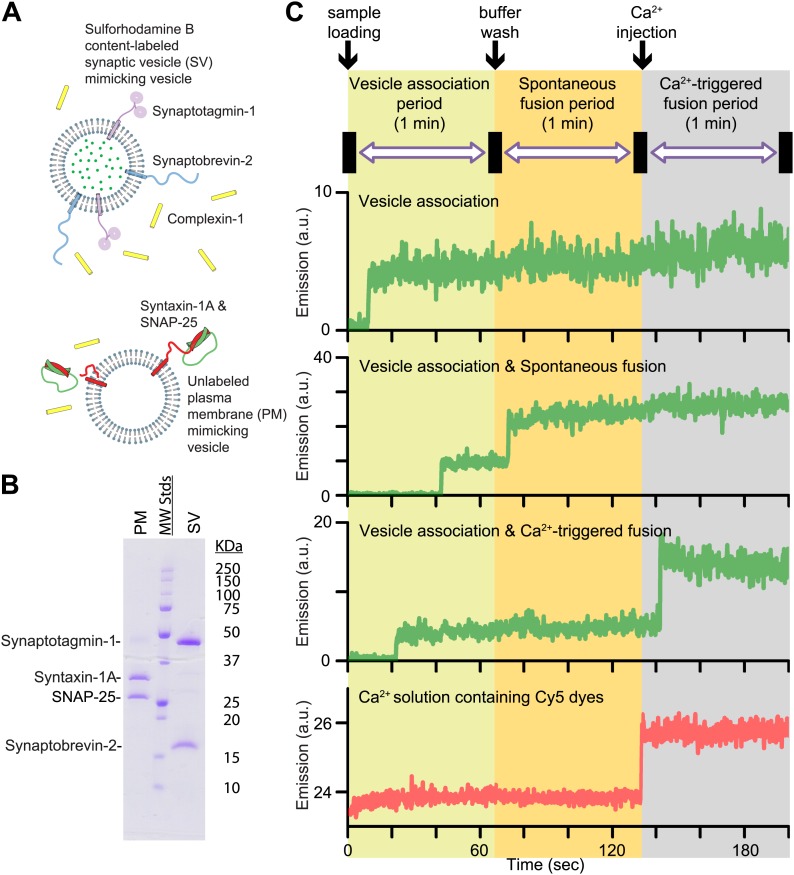
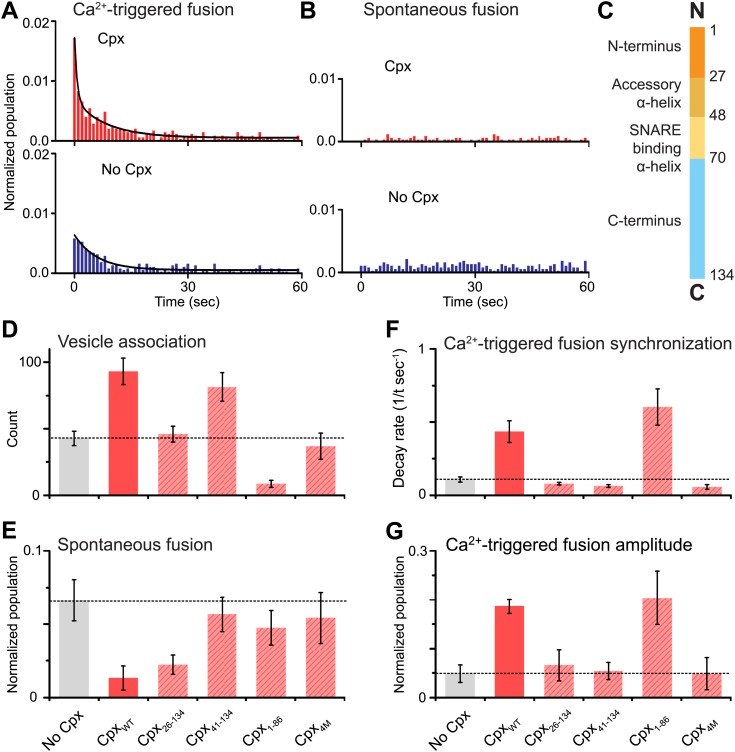
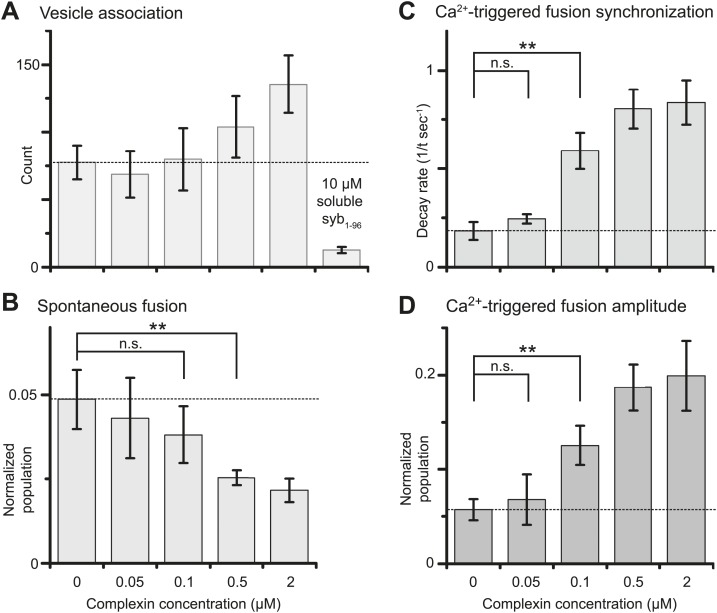
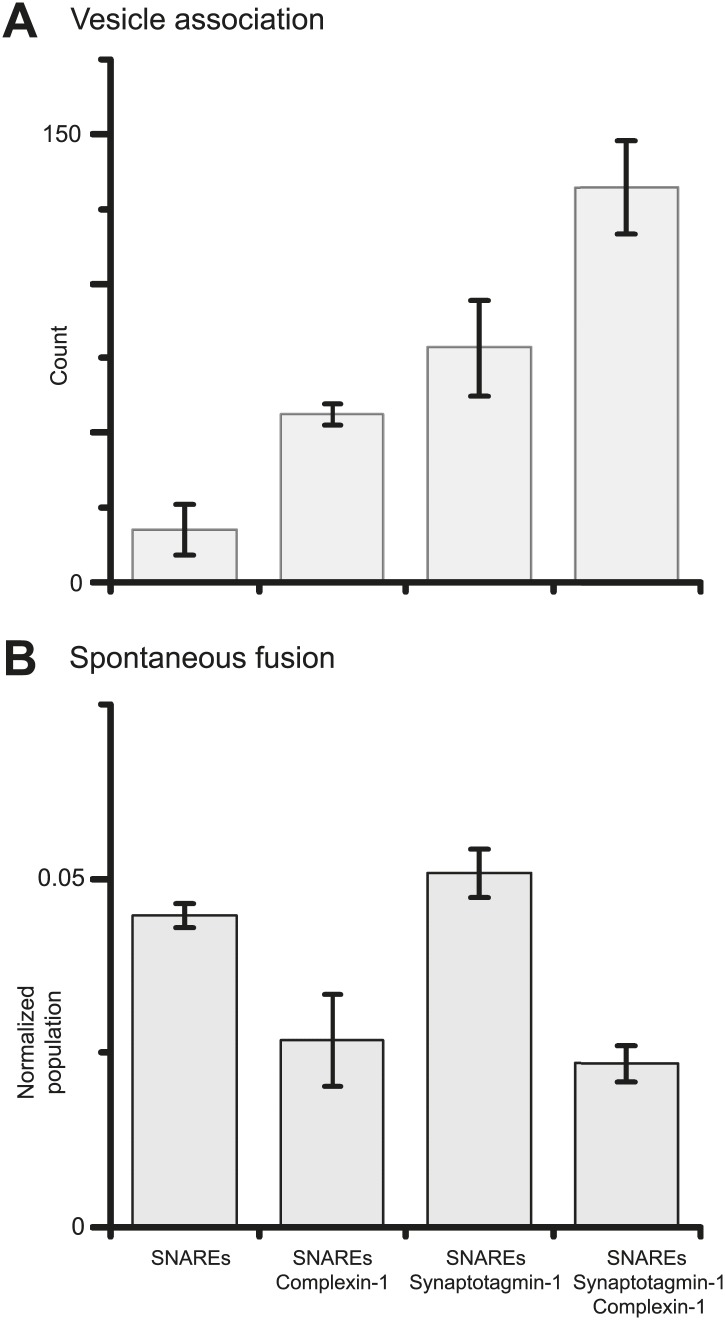
Previously we showed that fast Ca2+-triggered vesicle fusion with reconstituted neuronal SNAREs and synaptotagmin-1 begins from an initial hemifusion-free membrane point contact, rather than a hemifusion diaphragm, using a single vesicle–vesicle lipid/content mixing assay (Diao et al., 2012). When complexin-1 was included, a more pronounced Ca2+-triggered fusion burst was observed, effectively synchronizing the process. Here we show that complexin-1 also reduces spontaneous fusion in the same assay. Moreover, distinct effects of several complexin-1 truncation mutants on spontaneous and Ca2+-triggered fusion closely mimic those observed in neuronal cultures. The very N-terminal domain is essential for synchronization of Ca2+-triggered fusion, but not for suppression of spontaneous fusion, whereas the opposite is true for the C-terminal domain. By systematically varying the complexin-1 concentration, we observed differences in titration behavior for spontaneous and Ca2+-triggered fusion. Taken together, complexin-1 utilizes distinct mechanisms for synchronization of Ca2+-triggered fusion and inhibition of spontaneous fusion.
Overview
The claims and statistics of this paper haven’t been checked yet.
Run the check — free, no account needed. It reads the open-access text and checks the sources it cites.
Integrity signals
Registry
Cites
Statistics
Figures
Verification
Claims the paper makes
The claims and statistics of this paper haven’t been checked yet.
Run the check — free, no account needed. It reads the open-access text and checks the sources it cites.
Claims other papers make about this one
Each is checked against this paper’s own text: does it say what the citing paper says it does?
The source backs part of the claim, not all of it — or backs it for a different population, condition or comparison.
In the citing paper
“Recent evidence for this notion came from a reconstituted single vesicle-vesicle assay that discriminates among vesicle association, lipid mixing, and content mixing37,38,81.”
From Architecture of the synaptotagmin–SNARE machinery for neuronal exocytosis (2015) · cites this paper as [38]
Experimental — accuracy not yet measuredThe cited source says what the claim attributes to it.
In the citing paper
“We note that spontaneous release observed in our reconstituted system38 reflects the fusion probability at exactly zero Ca2+ concentration (that is, in absence of a Ca2+-sensor for mini-release) whereas spontaneous release in neurons is driven by resting Ca2+-concentrations and is largely blocked by removing all calcium41.”
From Architecture of the synaptotagmin–SNARE machinery for neuronal exocytosis (2015) · cites this paper as [38]
The cited source says what the claim attributes to it.
In the citing paper
“Our single vesicle-vesicle assay thus uses full-length Syt1 and it monitors content mixing, a correlate for neurotransmitter release37,38,81.”
From Architecture of the synaptotagmin–SNARE machinery for neuronal exocytosis (2015) · cites this paper as [38]
The cited source says what the claim attributes to it.
In the citing paper
“A variety of complexin-1 truncations and mutations qualitatively reproduced effects observed in neuronal cultures for both spontaneous and Ca2+-triggered release38, lending credence to this reconstituted system to investigate mechanistic questions.”
From Architecture of the synaptotagmin–SNARE machinery for neuronal exocytosis (2015) · cites this paper as [38]
The cited source says what the claim attributes to it.
In the citing paper
“Moreover, addition of complexin-1 greatly enhanced Ca2+-triggered amplitude and synchronization, and suppressed spontaneous release in this system38.”
From Architecture of the synaptotagmin–SNARE machinery for neuronal exocytosis (2015) · cites this paper as [38]
The cited source says what the claim attributes to it.
In the citing paper
“Neuronal SNAREs and Syt1 represent a minimal system for Ca2+-triggered membrane fusion.”
From Architecture of the synaptotagmin–SNARE machinery for neuronal exocytosis (2015) · cites this paper as [38]
Self-check
Percentages, sums and reported differences re-computed from the paper’s own numbers.
The self-check needs the paper’s full text.
Citations
Cites
Protein production by auto-induction in high-density shaking cultures
Studier, F. W. (2005) · Protein Expression and Purification · doi:10.1016/j.pep.2005.01.016 · Cited by 5,949
SNAREpins: Minimal Machinery for Membrane Fusion
Weber, T., Zemelman, B. V., McNew, J. A., Westermann, B., Gmachl, M., Parlati, F., Söllner, T. H., & Rothman, J. E. (1998) · Cell · doi:10.1016/s0092-8674(00)81404-x · Cited by 2,481
Membrane Fusion: Grappling with SNARE and SM Proteins
Südhof, T. C., & Rothman, J. E. (2009) · Science · doi:10.1126/science.1161748 · Cited by 2,027
Guan, K., & Dixon, J. (1991) · Analytical Biochemistry · doi:10.1016/0003-2697(91)90534-z · Cited by 1,735
Neurotransmitter Release: The Last Millisecond in the Life of a Synaptic Vesicle
Südhof, T. C. (2013) · Neuron · doi:10.1016/j.neuron.2013.10.022 · Cited by 1,197
Molecular machines governing exocytosis of synaptic vesicles
Jahn, R., & Fasshauer, D. (2012) · Nature · doi:10.1038/nature11320 · Cited by 1,004
Synaptotagmin I functions as a calcium regulator of release probability
Fernández-Chacón, R., Königstorfer, A., Gerber, S. H., García, J., Matos, M. F., Stevens, C. F., Brose, N., Rizo, J., Rosenmund, C., & Südhof, T. C. (2001) · Nature · doi:10.1038/35065004 · Cited by 961
Complexins: Cytosolic proteins that regulate SNAP receptor function
McMahon, H. T., Missler, M., Li, C., & Südhof, T. C. (1995) · Cell · doi:10.1016/0092-8674(95)90239-2 · Cited by 500
Complexins Regulate a Late Step in Ca2+-Dependent Neurotransmitter Release
Reim, K., Mansour, M., Varoqueaux, F., McMahon, H. T., Südhof, T. C., Brose, N., & Rosenmund, C. (2001) · Cell · doi:10.1016/s0092-8674(01)00192-1 · Cited by 500
A Complexin/Synaptotagmin 1 Switch Controls Fast Synaptic Vesicle Exocytosis
Tang, J., Maximov, A., Shin, O., Dai, H., Rizo, J., & Südhof, T. C. (2006) · Cell · doi:10.1016/j.cell.2006.08.030 · Cited by 474
Research works printed but not linked: 1
- Reim, 2001, Complexins regulate a late step in Ca2+-dependent neurotransmitter release, Cell, 104, 71, 10.1016/S0092-8674(01)00192-1 · DOI
Cited by
Sorted by citations
Architecture of the synaptotagmin–SNARE machinery for neuronal exocytosis
Zhou, Q., Lai, Y., Bacaj, T., Zhao, M., Lyubimov, A. Y., Uervirojnangkoorn, M., Zeldin, O. B., Brewster, A. S., Sauter, N. K., Cohen, A. E., et al. (2015) · Nature · doi:10.1038/nature14975 · Cited by 348
Self-citationThe Synaptic Vesicle Release Machinery
Rizo, J., & Xu, J. (2015) · Annual Review of Biophysics · doi:10.1146/annurev-biophys-060414-034057 · Cited by 348
Molecular Mechanisms Underlying Neurotransmitter Release
Rizo, J. (2022) · Annual Review of Biophysics · doi:10.1146/annurev-biophys-111821-104732 · Cited by 244
Molecular Mechanisms of Synaptic Vesicle Priming by Munc13 and Munc18
Lai, Y., Choi, U. B., Leitz, J., Rhee, H. J., Lee, C., Altas, B., Zhao, M., Pfuetzner, R. A., Wang, A. L., Brose, N., et al. (2017) · Neuron · doi:10.1016/j.neuron.2017.07.004 · Cited by 235
Self-citationSNARE proteins in membrane trafficking
Wang, T., Li, L., & Hong, W. (2017) · Traffic · doi:10.1111/tra.12524 · Cited by 196
Molecular Mechanisms of Fast Neurotransmitter Release
Brünger, A. T., Choi, U. B., Lai, Y., Leitz, J., & Zhou, Q. (2018) · Annual Review of Biophysics · doi:10.1146/annurev-biophys-070816-034117 · Cited by 180
Self-citationShould I stop or should I go? The role of complexin in neurotransmitter release
Trimbuch, T., & Rosenmund, C. (2016) · Nature reviews. Neuroscience · doi:10.1038/nrn.2015.16 · Cited by 163
Pick, H. M., Alves, A. C., & Vogel, H. (2018) · Chemical Reviews · doi:10.1021/acs.chemrev.7b00777 · Cited by 160
Michalski, N., Goutman, J. D., Auclair, S. M., de Monvel, J. B., Tertrais, M., Emptoz, A., Parrin, A., Nouaille, S., Guillon, M., Sachse, M., et al. (2017) · eLife · doi:10.7554/elife.31013 · Cited by 144
SNAREopathies: Diversity in Mechanisms and Symptoms
Verhage, M., & Sørensen, J. B. (2020) · Neuron · doi:10.1016/j.neuron.2020.05.036 · Cited by 121
Functional synergy between the Munc13 C-terminal C1 and C2 domains
Liu, X., Seven, A. B., Camacho, M., Esser, V., Xu, J., Trimbuch, T., Quade, B., Su, L., Ma, C., Rosenmund, C., et al. (2016) · eLife · doi:10.7554/elife.13696 · Cited by 115
The pre-synaptic fusion machinery
Brünger, A. T., Choi, U. B., Lai, Y., Leitz, J., White, K. I., & Zhou, Q. (2019) · Current Opinion in Structural Biology · doi:10.1016/j.sbi.2019.03.007 · Cited by 107
Self-citationSequential conformational rearrangements in flavivirus membrane fusion
Chao, L. H., Klein, D. E., Schmidt, A. G., Peña, J. M., & Harrison, S. C. (2014) · eLife · doi:10.7554/elife.04389 · Cited by 86
Wang, S., Choi, U. B., Gong, J., Yang, X., Li, Y., Yang, X., Yang, X., Brünger, A. T., & Ma, C. (2017) · The EMBO Journal · doi:10.15252/embj.201695775 · Cited by 84
Wang, S., Li, Y., & Ma, C. (2016) · eLife · doi:10.7554/elife.14211 · Cited by 82
Intrinsically disordered proteins in synaptic vesicle trafficking and release
Snead, D., & Eliezer, D. (2019) · Journal of Biological Chemistry · doi:10.1074/jbc.rev118.006493 · Cited by 79
Inhibition of calcium-triggered secretion by hydrocarbon-stapled peptides
Lai, Y., Fois, G., Flores, J. R., Tuvim, M. J., Zhou, Q., Yang, K., Leitz, J., Peters, J. J., Zhang, Y., Pfuetzner, R. A., et al. (2022) · Nature · doi:10.1038/s41586-022-04543-1 · Cited by 77
Self-citationC-terminal domain of mammalian complexin-1 localizes to highly curved membranes
Gong, J., Lai, Y., Li, X., Wang, M., Leitz, J., Hu, Y., Zhang, Y., Choi, U. B., Cipriano, D. J., Pfuetzner, R. A., et al. (2016) · Proceedings of the National Academy of Sciences · doi:10.1073/pnas.1609917113 · Cited by 77
Self-citationSchupp, M., Malsam, J., Ruiter, M., Scheutzow, A., Wierda, K. D. B., Söllner, T. H., & Sørensen, J. B. (2016) · Journal of Neuroscience · doi:10.1523/jneurosci.1011-16.2016 · Cited by 74
Synaptic Vesicle-Recycling Machinery Components as Potential Therapeutic Targets
Li, Y. C., & Kavalali, E. T. (2017) · Pharmacological Reviews · doi:10.1124/pr.116.013342 · Cited by 74
Calcium dependence of spontaneous neurotransmitter release
Williams, C. L., & Smith, S. M. (2017) · Journal of Neuroscience Research · doi:10.1002/jnr.24116 · Cited by 71
Mohrmann, R., Dhara, M., & Bruns, D. (2015) · Cellular and Molecular Life Sciences · doi:10.1007/s00018-015-1998-8 · Cited by 69
Reconstitution of calcium-mediated exocytosis of dense-core vesicles
Kreutzberger, A. J. B., Kiessling, V., Liang, B., Seelheim, P., Jakhanwal, S., Jahn, R., Castle, J. D., & Tamm, L. K. (2017) · Science Advances · doi:10.1126/sciadv.1603208 · Cited by 62
A distinct tethering step is vital for vacuole membrane fusion
Zick, M., & Wickner, W. T. (2014) · eLife · doi:10.7554/elife.03251 · Cited by 61
Ca2+-Triggered Synaptic Vesicle Fusion Initiated by Release of Inhibition
Brünger, A. T., Leitz, J., Zhou, Q., Choi, U. B., & Lai, Y. (2018) · Trends in Cell Biology · doi:10.1016/j.tcb.2018.03.004 · Cited by 61
Self-citationN-terminal domain of complexin independently activates calcium-triggered fusion
Lai, Y., Choi, U. B., Zhang, Y., Zhao, M., Pfuetzner, R. A., Wang, A. L., Diao, J., & Brünger, A. T. (2016) · Proceedings of the National Academy of Sciences · doi:10.1073/pnas.1604348113 · Cited by 57
Self-citationTowards reconstitution of membrane fusion mediated by SNAREs and other synaptic proteins
Brünger, A. T., Cipriano, D. J., & Diao, J. (2015) · Critical Reviews in Biochemistry and Molecular Biology · doi:10.3109/10409238.2015.1023252 · Cited by 52
Self-citationMalsam, J., Bärfuss, S., Trimbuch, T., Zarebidaki, F., Sonnen, A. F. P., Wild, K., Scheutzow, A., Rohland, L., Mayer, M. P., Sinning, I., et al. (2019) · bioRxiv · doi:10.1016/j.celrep.2020.107926 · Cited by 37
Held, R. G., Liang, J., & Brünger, A. T. (2024) · Proceedings of the National Academy of Sciences · doi:10.1073/pnas.2403136121 · Cited by 56
Synaptotagmin oligomers are necessary and can be sufficient to form a Ca2+‐sensitive fusion clamp
Ramakrishnan, S. K., Bera, M., Coleman, J., Krishnakumar, S. S., Pincet, F., & Rothman, J. E. (2018) · FEBS Letters · doi:10.1002/1873-3468.13317 · Cited by 48
Complexin Binding to Membranes and Acceptor t-SNAREs Explains Its Clamping Effect on Fusion
Zdanowicz, R., Kreutzberger, A. J. B., Liang, B., Kiessling, V., Tamm, L. K., & Cafiso, D. S. (2017) · Biophysical Journal · doi:10.1016/j.bpj.2017.04.002 · Cited by 46
The accessory helix of complexin functions by stabilizing central helix secondary structure
Radoff, D. T., Dong, Y., Snead, D., Bai, J., Eliezer, D., & Dittman, J. S. (2014) · eLife · doi:10.7554/elife.04553 · Cited by 42
Choi, U. B., Zhao, M., Zhang, Y., Lai, Y., & Brünger, A. T. (2016) · eLife · doi:10.7554/elife.16886 · Cited by 42
Self-citationLauretti, E., Nenov, M. N., Dincer, O., Iuliano, L., & Praticò, D. (2019) · Aging Cell · doi:10.1111/acel.13076 · Cited by 43
Molecular determinants of complexin clamping and activation function
Bera, M., Ramakrishnan, S. K., Coleman, J., Krishnakumar, S. S., & Rothman, J. E. (2022) · eLife · doi:10.7554/elife.71938 · Cited by 40
The proteins of exocytosis: lessons from the sperm model
Tomes, C. N. (2015) · Biochemical Journal · doi:10.1042/bj20141169 · Cited by 39
Functional Roles of Complexin 3 and Complexin 4 at Mouse Photoreceptor Ribbon Synapses
Babai, N. Z., Sendelbeck, A., Regus‐Leidig, H., Fuchs, M., Mertins, J., Reim, K., Brose, N., Feigenspan, A., & Brandstätter, J. H. (2016) · Journal of Neuroscience · doi:10.1523/jneurosci.4335-15.2016 · Cited by 38
Wragg, R. T., Parisotto, D. A., Li, Z., Terakawa, M. S., Snead, D., Basu, I., Weinstein, H., Eliezer, D., & Dittman, J. S. (2017) · Frontiers in Molecular Neuroscience · doi:10.3389/fnmol.2017.00146 · Cited by 37
The Core Complex of the Ca2+-Triggered Presynaptic Fusion Machinery
Brünger, A. T., & Leitz, J. (2022) · Journal of Molecular Biology · doi:10.1016/j.jmb.2022.167853 · Cited by 36
Yim, Y. Y., Zurawski, Z., & Hamm, H. E. (2018) · Pharmacology & Therapeutics · doi:10.1016/j.pharmthera.2018.07.005 · Cited by 36
He, R., Zhang, J., Yu, Y., Jizi, L., Wang, W., & Li, M. (2018) · Frontiers in Molecular Neuroscience · doi:10.3389/fnmol.2018.00213 · Cited by 37
Snead, D., Lai, A. L., Wragg, R. T., Parisotto, D. A., Ramlall, T. F., Dittman, J. S., Freed, J. H., & Eliezer, D. (2017) · Frontiers in Molecular Neuroscience · doi:10.3389/fnmol.2017.00154 · Cited by 32
Re-visiting the trans insertion model for complexin clamping
Krishnakumar, S. S., Li, F., Coleman, J., Schauder, C. M., Kümmel, D., Pincet, F., Rothman, J. E., & Reinisch, K. M. (2015) · eLife · doi:10.7554/elife.04463 · Cited by 29
Vesicle Fusion Mediated by Solanesol-Anchored DNA
Flavier, K. M., & Boxer, S. G. (2017) · Biophysical Journal · doi:10.1016/j.bpj.2017.05.034 · Cited by 28
Neutral lysophosphatidylcholine mediates α-synuclein-induced synaptic vesicle clustering
Lai, Y., Zhao, C., Tian, Z., Wang, C., Fan, J., Hu, X. Y., Tu, J., Li, T., Leitz, J., Pfuetzner, R. A., et al. (2023) · Proceedings of the National Academy of Sciences · doi:10.1073/pnas.2310174120 · Cited by 28
Self-citationCork, K. M., Hook, M. J. V., & Thoreson, W. B. (2016) · European Journal of Neuroscience · doi:10.1111/ejn.13288 · Cited by 25
Focused clamping of a single neuronal SNARE complex by complexin under high mechanical tension
Shon, M. J., Kim, H., & Yoon, T. (2018) · Nature Communications · doi:10.1038/s41467-018-06122-3 · Cited by 23
Liu, Y., Sugiura, Y., Südhof, T. C., & Lin, W. (2019) · Journal of Neuroscience · doi:10.1523/jneurosci.0403-19.2019 · Cited by 24
STING guides the STX17-SNAP29-VAMP8 complex assembly to control autophagy
Song, X., Xi, Y., Dai, M., Li, T., Du, S., Zhu, Y., Li, M., Li, Y., Liu, S., Ding, X., et al. (2024) · Cell Insight · doi:10.1016/j.cellin.2024.100147 · Cited by 25
Self-citationReconstituting SNARE-mediated membrane fusion at the single liposome level
Kiessling, V., Liang, B., & Tamm, L. K. (2015) · Methods in cell biology · doi:10.1016/bs.mcb.2015.02.005 · Cited by 22
Yang, Z., Gou, L., Chen, S., Li, N., Zhang, S., & Zhang, L. (2017) · Frontiers in Molecular Neuroscience · doi:10.3389/fnmol.2017.00168 · Cited by 23
Beyond the MUN domain, Munc13 controls priming and depriming of synaptic vesicles
Leitz, J., Wang, C., Esquivies, L. R., Pfuetzner, R. A., Peters, J. J., Couoh‐Cardel, S., Wang, A. L., & Brünger, A. T. (2024) · Cell Reports · doi:10.1016/j.celrep.2024.114026 · Cited by 20
Self-citationIn Vitro Reconstitution of Autophagosome–Lysosome Fusion
Diao, J., Li, L., Lai, Y., & Zhong, Q. (2016) · Methods in enzymology on CD-ROM/Methods in enzymology · doi:10.1016/bs.mie.2016.09.065 · Cited by 21
Self-citationHow does the stimulus define exocytosis in adrenal chromaffin cells?
Marengo, F. D., & Cárdenas, A. M. (2017) · Pflügers Archiv - European Journal of Physiology · doi:10.1007/s00424-017-2052-5 · Cited by 21
A mechanism for exocytotic arrest by the Complexin C-terminus
Makke, M., Martinez, M. M., Gaya, S., Schwarz, Y. N., Frisch, W., Silva-Bermúdez, L. S., Jung, M., Mohrmann, R., Dhara, M., & Bruns, D. (2018) · eLife · doi:10.7554/elife.38981 · Cited by 19
Wang, M., Liang, X., Zhang, Q., Luo, S., Liu, H., Wang, X., Sai, N., & Zhang, X. (2022) · Nutritional Neuroscience · doi:10.1080/1028415x.2022.2060642 · Cited by 18
Synaptotagmin-1 undergoes phase separation to regulate its calcium-sensitive oligomerization
Zhu, M., Xu, H., Jin, Y., Kong, X., Xu, B., Liu, Y., & Yu, H. (2024) · The Journal of Cell Biology · doi:10.1083/jcb.202311191 · Cited by 16
Munc18a Does Not Alter Fusion Rates Mediated by Neuronal SNAREs, Synaptotagmin, and Complexin
Zhang, Y., Diao, J., Colbert, K. N., Lai, Y., Pfuetzner, R. A., Padolina, M. S., Vivona, S., Ressl, S., Cipriano, D. J., Choi, U. B., et al. (2015) · Journal of Biological Chemistry · doi:10.1074/jbc.m114.630772 · Cited by 18
Self-citationGallimore, A. R., Hepburn, I., Georgiev, S. V., Rizzoli, S. O., & Schutter, E. D. (2025) · Science Advances · doi:10.1126/sciadv.adq6477 · Cited by 17
Sundaram, R. V. K., Chatterjee, A., Bera, M., Grushin, K. S., Panda, A., Li, F., Coleman, J., Lee, S., Ramakrishnan, S. K., Ernst, A. M., et al. (2023) · Proceedings of the National Academy of Sciences · doi:10.1073/pnas.2309516120 · Cited by 12
SNARE-Mediated Fusion of Single Chromaffin Granules with Pore-Spanning Membranes
Hubrich, R., Park, Y., Mey, I. P., Jahn, R., & Steinem, C. (2018) · Biophysical Journal · doi:10.1016/j.bpj.2018.11.3138 · Cited by 13
A Proteoliposome Method for Assessing Nanotoxicity on Synaptic Fusion and Membrane Integrity
Crowe, M., Lai, Y., Wang, Y., Lu, J., Zhao, M., Tian, Z., Long, J., Zhang, P., & Diao, J. (2017) · Small Methods · doi:10.1002/smtd.201700207 · Cited by 12
Self-citationSNARE‐Reconstituted Liposomes as Controllable Zeptoliter Nanoreactors for Macromolecules
Hu, Y., Lai, Y., Wang, Y., Zhao, M., Zhang, Y., Crowe, M., Tian, Z., Long, J., & Diao, J. (2017) · Advanced Biosystems · doi:10.1002/adbi.201600018 · Cited by 12
Self-citationHigh Transmembrane Voltage Raised by Close Contact Initiates Fusion Pore
Bu, B., Tian, Z., Li, D., & Ji, B. (2016) · Frontiers in Molecular Neuroscience · doi:10.3389/fnmol.2016.00136 · Cited by 11
Preincubation of t-SNAREs with Complexin I Increases Content-Mixing Efficiency
Kim, J., Zhu, Y., & Shin, Y. (2016) · Biochemistry · doi:10.1021/acs.biochem.6b00114 · Cited by 10
Mass spectrometry uncovers intermediates and off-pathway complexes for SNARE complex assembly
Hesselbarth, J., & Schmidt, C. (2023) · Communications Biology · doi:10.1038/s42003-023-04548-0 · Cited by 10
Screening of Hydrocarbon-Stapled Peptides for Inhibition of Calcium-Triggered Exocytosis
Lai, Y., Tuvim, M. J., Leitz, J., Peters, J. J., Pfuetzner, R. A., Esquivies, L. R., Zhou, Q., Czakó, B., Cross, J. B., JONES, P. G., et al. (2022) · Frontiers in Pharmacology · doi:10.3389/fphar.2022.891041 · Cited by 10
Self-citationProductive and Non-productive Pathways for Synaptotagmin 1 to Support Ca2+-Triggered Fast Exocytosis
Kim, J., & Shin, Y. (2017) · Frontiers in Molecular Neuroscience · doi:10.3389/fnmol.2017.00380 · Cited by 8
Nikolaus, J., Hancock, K., Tsemperouli, M., Baddeley, D., & Karatekin, E. (2021) · Frontiers in Molecular Biosciences · doi:10.3389/fmolb.2021.740408 · Cited by 8
Membrane lipids couple synaptotagmin to SNARE-mediated granule fusion in insulin-secreting cells
Amos, C., Kiessling, V., Kreutzberger, A. J. B., Schenk, N. A., Mohan, R., Nyenhuis, S. B., Doyle, C. A., Wang, H., Levental, K. R., Levental, I., et al. (2023) · Molecular Biology of the Cell · doi:10.1091/mbc.e23-06-0225 · Cited by 7
Colloidally deposited nanoparticle wires for biophysical detection
Shen, S. C., Liu, W., & Diao, J. (2015) · Chinese Physics B · doi:10.1088/1674-1056/24/12/127308 · Cited by 7
Self-citationComplexin-1 and synaptotagmin-1 compete for binding sites on membranes containing PtdInsP2
Liang, Q., Ofosuhene, A. P., Kiessling, V., Liang, B., Kreutzberger, A. J. B., Tamm, L. K., & Cafiso, D. S. (2022) · Biophysical Journal · doi:10.1016/j.bpj.2022.08.023 · Cited by 7
Observing isolated synaptic vesicle association and fusion ex vivo
Leitz, J., Wang, C., Esquivies, L. R., Peters, J. J., Gopal, N., Pfuetzner, R. A., Wang, A. L., & Brünger, A. T. (2024) · Nature Protocols · doi:10.1038/s41596-024-01014-x · Cited by 8
Self-citationMunc18 modulates syntaxin phase separation to promote exocytosis
Pei, Q., Chen, Q., Tian, Z., Zhu, L., Chen, Y., Gong, J., Wang, S., Xiang, Y., Khamo, J. S., Fan, J., et al. (2025) · Nature Neuroscience · doi:10.1038/s41593-025-02140-9 · Cited by 6
Self-citationRegulation of Syntaxin3B-Mediated Membrane Fusion by T14, Munc18, and Complexin
Nishad, R., Betancourt-Solis, M. A., Dey, H., Heidelberger, R., & McNew, J. A. (2023) · Biomolecules · doi:10.3390/biom13101463 · Cited by 5
Search for a minimal machinery for Ca2+-triggered millisecond neuroexocytosis
Kweon, D., Kong, B., & Shin, Y. (2018) · Neuroscience · doi:10.1016/j.neuroscience.2018.07.031 · Cited by 5
Sundaram, R. V. K., Chatterjee, A., Bera, M., Grushin, K. S., Panda, A., Li, F., Coleman, J., Lee, S., Ramakrishnan, S. K., Ernst, A. M., et al. (2023) · bioRxiv (Cold Spring Harbor Laboratory) · doi:10.1101/2023.06.05.543781 · Cited by 4
Xiang, Y., Cui, L., Yao, J., Lou, X., Wu, M., Huo, J., Fan, J., Li, H., Li, K., Wang, X., et al. (2025) · Nature Communications · doi:10.1038/s41467-025-62496-1 · Cited by 3
Self-citationCao, Z., Fan, R., Meng, B., Xing, Z., Liu, M., Gao, M., & Luan, X. (2018) · Animal Science Journal · doi:10.1111/asj.13012 · Cited by 3
Snead, D., & Eliezer, D. (2018) · Methods in enzymology on CD-ROM/Methods in enzymology · doi:10.1016/bs.mie.2018.08.005 · Cited by 3
How binding to surfaces affects disorder?
Bartolo, A. L. D., & Masone, D. (2022) · Elsevier eBooks · doi:10.1016/b978-0-323-99533-7.00017-0 · Cited by 3
Bu, B., Tian, Z., Li, D., Zhang, K., Chen, W., Ji, B., & Diao, J. (2020) · Journal of Molecular Biology · doi:10.1016/j.jmb.2023.168089 · Cited by 2
Self-citationA new method for isolation and purification of fusion-competent inhibitory synaptic vesicles
Gopal, N., Leitz, J., Wang, C., Esquivies, L. R., Pfuetzner, R. A., & Brünger, A. T. (2024) · Current Research in Physiology · doi:10.1016/j.crphys.2024.100121 · Cited by 2
Self-citationMolecular Dynamics Simulation for Membrane Fusion
Tyoe, O., Zhang, K., & Diao, J. (2025) · Methods in molecular biology · doi:10.1007/978-1-0716-4314-3_3 · Cited by 1
Self-citationUncovering the Mechanisms of Intracellular Membrane Trafficking by Reconstituted Membrane Systems
Chen, S., Liu, Y., & Yu, H. (2025) · Membranes · doi:10.3390/membranes15050154 · Cited by 1
Regulation of Exocytosis by Complexin
Shin, O. (2015) · Journal of Biochemistry and Molecular Biology Research · doi:10.17554/j.issn.2313-7177.2015.01.6 · Cited by 1
Yu, Y., Chen, S., Mo, X., Gong, J., Li, C., & Yang, X. (2018) · Frontiers in Molecular Neuroscience · doi:10.3389/fnmol.2018.00061 · Cited by 1
Extra-virgin olive oil, cognition and brain health
Lauretti, E., Iuliano, L., & Praticò, D. (2021) · Elsevier eBooks · doi:10.1016/b978-0-12-819528-4.00018-3 · Cited by 2
Patterson, M. N., Schekman, R. W., Watt, F. M., & Weigel, D. (2014) · eLife · doi:10.7554/elife.03980 · Cited by 1
Key determinants of the dual clamp/activator function of ComplexinPreprint
Makke, M., Ruiz, A. P., Yarzagaray, A., Gaya, S., Zimmer, M., Frisch, W., & Bruns, D. (2023) · eLife · doi:10.7554/elife.92438 · Cited by 1
Hydrodynamics govern the pre-fusion docking time of synaptic vesicles
Singh, P., & Hui, C. (2018) · Journal of The Royal Society Interface · doi:10.1098/rsif.2017.0818
Reconstitution of SNARE Mediated Membrane Fusion
Kreutzberger, A. J. B. (2017) · doi:10.18130/v3qh1c
Synaptosomes and Synaptic Vesicles
Stunault, M. I., & Ashrafi, G. (2022) · Elsevier eBooks · doi:10.1016/b978-0-12-821618-7.00215-7
Key determinants of the dual clamp/activator function of Complexin
Makke, M., Ruiz, A. P., Yarzagaray, A., Gaya, S., Zimmer, M., Frisch, W., & Bruns, D. (2024) · eLife · doi:10.7554/elife.92438.4
Key determinants of the dual clamp/activator function of ComplexinPreprint
Makke, M., Ruiz, A. P., Yarzagaray, A., Gaya, S., Zimmer, M., Frisch, W., & Bruns, D. (2023) · eLife · doi:10.7554/elife.92438.1
Key determinants of the dual clamp/activator function of ComplexinPreprint
Makke, M., Ruiz, A. P., Yarzagaray, A., Gaya, S., Zimmer, M., Frisch, W., & Bruns, D. (2024) · eLife · doi:10.7554/elife.92438.2
eLife Assessment: Key determinants of the dual clamp/activator function of Complexin
von Gersdorff, H. (2024) · eLife · doi:10.7554/elife.92438.2.sa3
Author response: Key determinants of the dual clamp/activator function of Complexin
Makke, M., Ruiz, A. P., Yarzagaray, A., Gaya, S., Zimmer, M., Frisch, W., & Bruns, D. (2024) · eLife · doi:10.7554/elife.92438.2.sa0
Metadata
- Authors
- Lai, Y., Diao, J., Cipriano, D. J., Zhang, Y., Pfuetzner, R. A., Padolina, M. S., & Brunger, A. T.
- Affiliations
- Stanford University (US)
- Howard Hughes Medical Institute (US)
- Department of Molecular and Cellular Physiology, Stanford University, Stanford, United States
- Venue
- eLife
- Publisher
- eLife Sciences Publications, Ltd
- Published
- 2014-08-13
- Volume
- 3
- Pages
- e03756-e03756
- ISSN
- 2050-084X (ISSN-L)
- PMC
- PMC4130161
- OpenAlex
- W2128246609
- Cited by
- 107
- References
- 40
- Citations by year
- 2026: 1 · 2025: 7 · 2024: 13 · 2023: 8 · 2022: 9 · 2021: 2 · 2020: 3 · 2019: 4 · 2018: 16 · 2017: 17 · 2016: 12 · 2015: 11 · 2014: 4
- FWCI
- 7.31
- Type
- journal article
- Language
- en
- Open access
- gold
- doi.org
- Licence
- Locations
- eLife (publishedVersion, cc-by)
- PubMed Central (publishedVersion, cc-by)
- PubMed (publishedVersion)
- DOAJ (DOAJ: Directory of Open Access Journals) (submittedVersion, cc-by-sa)
- Funders
- Howard Hughes Medical Institute
- National Institutes of Health (R37-MH63105)
- Topics
- Life Sciences › Biochemistry, Genetics and Molecular Biology › Cell Biology › Cellular transport and secretion
- Life Sciences › Neuroscience › Cellular and Molecular Neuroscience › Neuroscience and Neuropharmacology Research
- Life Sciences › Biochemistry, Genetics and Molecular Biology › Molecular Biology › Lipid Membrane Structure and Behavior
- Keywords
- complexin-1, synaptic vesicle fusion, spontaneous release, calcium-triggered release, SNARE proteins, synaptotagmin-1, hemifusion, truncation mutants, N-terminal domain, C-terminal domain, neurotransmitter release
- MeSH terms
- Animals, Biological Assay, Biological Transport, Calcium, Escherichia coli, Exocytosis, Membrane Fusion, Models, Biological, Mutation, Nerve Tissue Proteins, Neurons, Protein Binding, Recombinant Proteins, Synaptic Vesicles, Gene Expression, Protein Structure, Tertiary, Adaptor Proteins, Vesicular Transport, Synaptosomal-Associated Protein 25, Syntaxin 1, Synaptotagmin I, Vesicle-Associated Membrane Protein 2, Rats, Protein Refolding
About these checks
Registry, retraction, Cites and statistics results are computed, not judged, with one exception: a printed reference that no index lists is read once by a model before it counts as a citation error. Claims are extracted by a model and kept only when their quote appears verbatim in the text; each cited source is then checked, with a model’s help, for whether it says what the claim relies on. Those verdicts can be wrong — read the claim’s quote and the cited source before relying on one.
Statistics and arithmetic are recomputed, not judged.
Confidence bands are shown only for fields calibrated on our annotated test set. None is calibrated yet, so no band is shown.
What counts as a claim ›How we measure confidence ›How we check this ›
Are you an author, or do you see a problem with this page? Request a review
