Cited by 0Bacterial Genetics and BiotechnologyMicrotubule and mitosis dynamicsAdvanced Fluorescence Microscopy Techniques

The DOI matches its Crossref record, with a small difference in title or year; 1 of the 1 references it cites were found in a registry or an index.

Membrane binding controls the ATPase cycle and localization of MinD in Bacillus subtilis

Open access
Feddersen, Helge, Dyckmans, Charlotte, Bramkamp, Marc·2026·eLife

Published version of a preprint

Abstract

Bacteria precisely regulate the place and timing of their cell division. One of the best-understood systems for division site selection is the Min system in Escherichia coli . In E. coli , the Min system displays remarkable pole-to-pole oscillation, creating a time-averaged minimum at the cell’s geometric center, which marks the future division site. Interestingly, the Gram-positive model species Bacillus subtilis also encodes homologous proteins: the cell division inhibitor MinC and the Walker-ATPase MinD. However, B. subtilis lacks the activating protein MinE, which is essential for Min dynamics in E. coli . We have shown before that the B. subtilis Min system is highly dynamic and quickly relocalizes to active sites of division. This raised questions about how Min protein dynamics are regulated on a molecular level in B. subtilis . Here, we show with a combination of in vitro experiments and in vivo single-molecule imaging that the ATPase activity of B. subtilis MinD is activated by membrane binding. Additionally, both monomeric and dimeric MinD bind to the membrane, and binding of ATP to MinD is a prerequisite for fast membrane detachment. Single-molecule localization microscopy data confirm membrane binding of monomeric MinD variants. However, only wild-type MinD enriches at cell poles and sites of ongoing division, likely due to interaction with MinJ. Monomeric MinD variants and locked dimers remain distributed along the membrane and lack the characteristic pattern formation. Single-molecule tracking data further support that MinD has a freely diffusive population, which is increased in the monomeric variants and a membrane-binding defective mutant. Thus, MinD dynamics in B. subtilis under the tested conditions do not require any unknown protein component and can be fully explained by MinD’s binding and unbinding kinetics with the membrane. The spatial organization of MinD relies on the short-lived temporal residence of MinD dimers at the membrane.

Overview

The claims and statistics of this paper haven’t been checked yet.

Run the check — free, no account needed. It reads the open-access text and checks the sources it cites.

A few free checks a day · papers already verified open instantly · results are public

Integrity signals

Registry

Crossref · 10.7554/elife.101517

Cites

1 of 1 references verified0 citation errors · 0 not checkable

Statistics

Figures

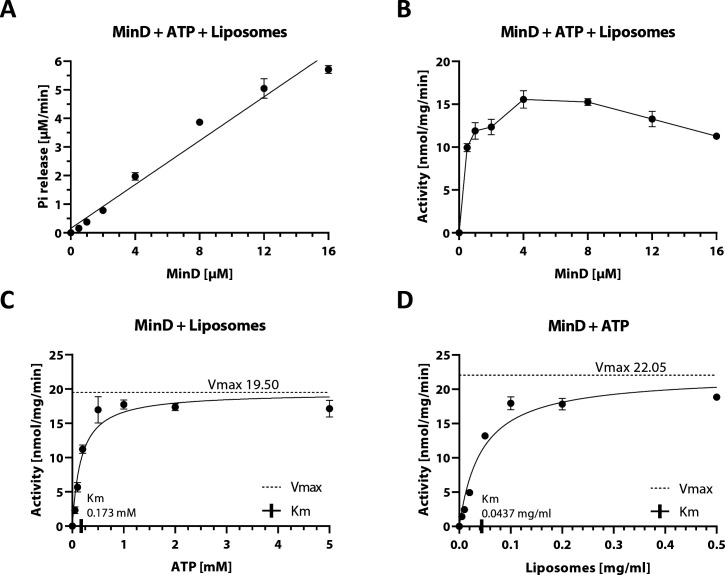
Figure 1. Biochemical analysis of B. subtilis MinD ATPase cycle. (A) Phosphate release plotted against different MinD concentrations, fitted with a simple linear regression (R2=0.97). Phosphate release was measured using the EnzChek phosphate assay kit. Samples contained 0.2 mg ml–1 liposomes and were pre-incubated for 10 min before addition of 2 mM Mg2+-ATP; n≥3. (B) Specific activity of the MinD ATPase from (A) measured as a function of MinD concentration. (C) Specific activity of MinD measured as a function of ATP concentration, determined as in (B) with fixed MinD concentration of 10 µM. Fitting the Michaelis-Menten equation (black lines) gives kcat = 36.27 hr−1, Vmax = 19.50 nmol mg–1 min–1 and KM = 0.173 mM. (D) Specific activity of MinD measured as a function of liposome concentration, determined as in (B) with fixed MinD concentration of 6 µM. Fitting the Michaelis-Menten equation (black lines) gives kcat = 41.01 hr−1, Vmax = 22.05 nmol mg–1 min–1 and KM = 0.0437 mg ml–1.
Figure 1. Biochemical analysis of B. subtilis MinD ATPase cycle. (A) Phosphate release plotted against different MinD concentrations, fitted with a simple linear regression (R2=0.97). Phosphate release was measured using the EnzChek phosphate assay kit. Samples contained 0.2 mg ml–1 liposomes and were pre-incubated for 10 min before addition of 2 mM Mg2+-ATP; n≥3. (B) Specific activity of the MinD ATPase from (A) measured as a function of MinD concentration. (C) Specific activity of MinD measured as a function of ATP concentration, determined as in (B) with fixed MinD concentration of 10 µM. Fitting the Michaelis-Menten equation (black lines) gives kcat = 36.27 hr−1, Vmax = 19.50 nmol mg–1 min–1 and KM = 0.173 mM. (D) Specific activity of MinD measured as a function of liposome concentration, determined as in (B) with fixed MinD concentration of 6 µM. Fitting the Michaelis-Menten equation (black lines) gives kcat = 41.01 hr−1, Vmax = 22.05 nmol mg–1 min–1 and KM = 0.0437 mg ml–1.CC BY · PubMed Central
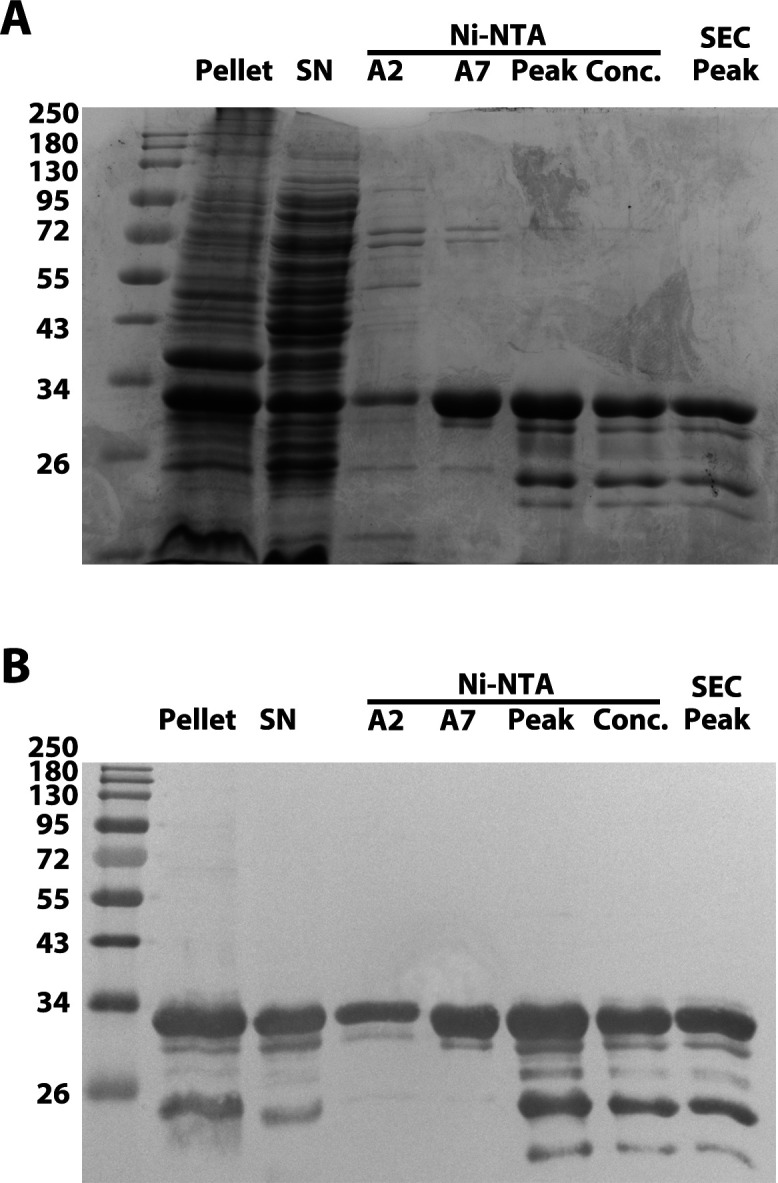
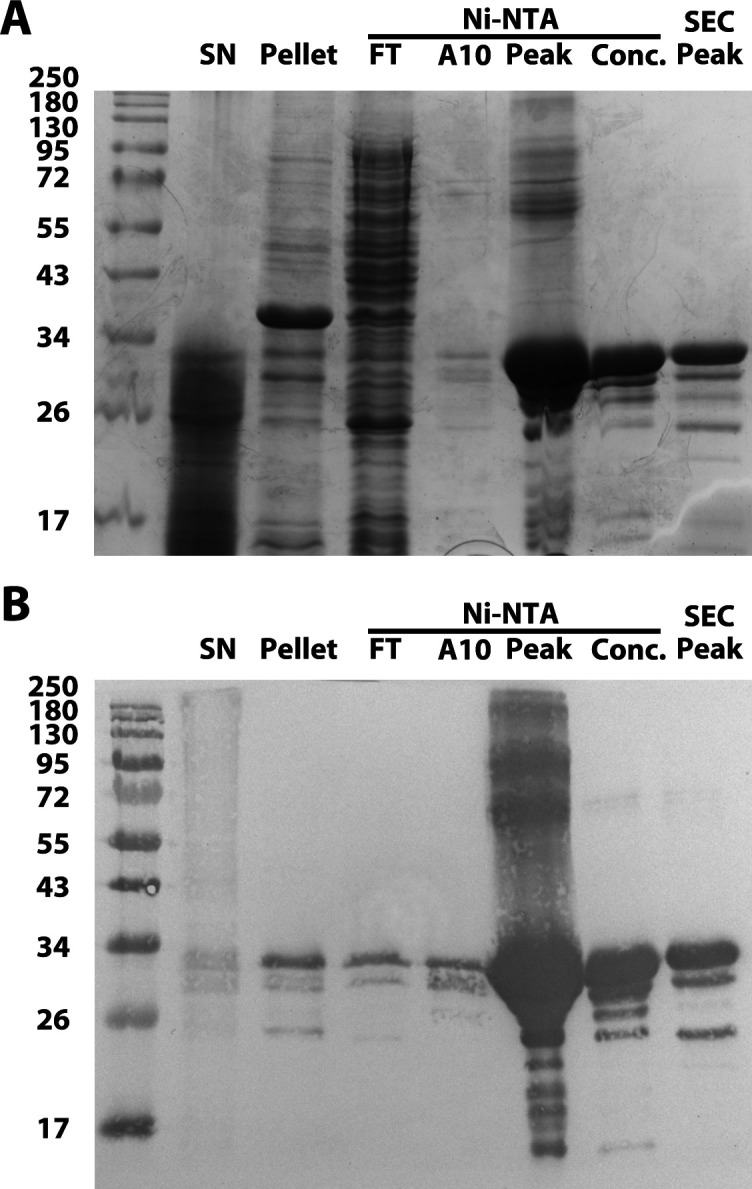
Figure 1—figure supplement 1. His-MinD purification analysis. (A) Sodium dodecyl sulfate-polyacrylamide gel electrophoresis (SDS-PAGE) gel analysis of purification products of His-MinD (31.7 kDa), stained with Coomassie blue stain. From left to right: Ladder, pellet after lysate, supernatant, Ni-NTA peaks A2, A7, C4 (main peak), concentrated sample, gel filtration peak. Ladder = Color Prestained Protein Standard, Broad Range (New England Biolabs). (B) Western blot of replicate gel from (A) using Penta-His antibody (QIAGEN).
Figure 1—figure supplement 1. His-MinD purification analysis. (A) Sodium dodecyl sulfate-polyacrylamide gel electrophoresis (SDS-PAGE) gel analysis of purification products of His-MinD (31.7 kDa), stained with Coomassie blue stain. From left to right: Ladder, pellet after lysate, supernatant, Ni-NTA peaks A2, A7, C4 (main peak), concentrated sample, gel filtration peak. Ladder = Color Prestained Protein Standard, Broad Range (New England Biolabs). (B) Western blot of replicate gel from (A) using Penta-His antibody (QIAGEN).CC BY · PubMed Central
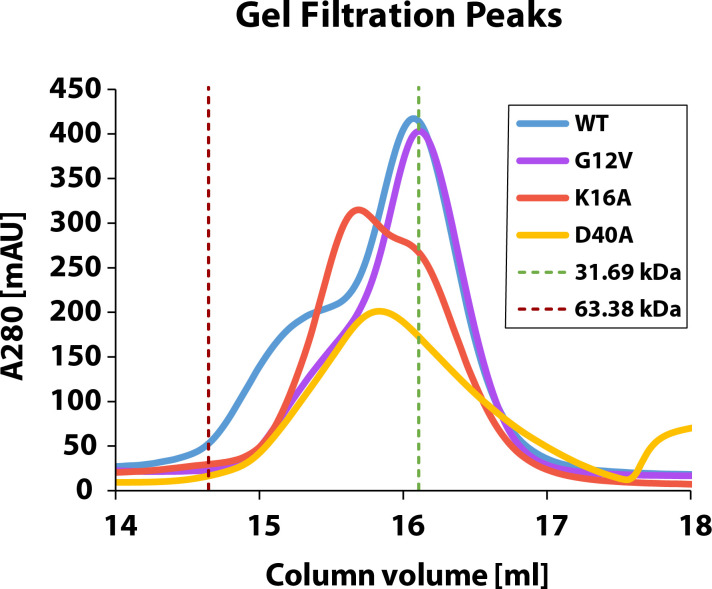
Figure 1—figure supplement 2. Gel filtration chromatograms of His-MinD and variants. Gel filtration analysis of purified His-MinD and indicated mutants. Curves were aligned according to the respective void volume after sample injection. Green and red dotted lines mark the calibrated elution volumes corresponding to proteins of 31.69 kDa (His-MinD monomer) and 63.38 kDa (His-MinD dimer), as determined from molecular weight standards.
Figure 1—figure supplement 2. Gel filtration chromatograms of His-MinD and variants. Gel filtration analysis of purified His-MinD and indicated mutants. Curves were aligned according to the respective void volume after sample injection. Green and red dotted lines mark the calibrated elution volumes corresponding to proteins of 31.69 kDa (His-MinD monomer) and 63.38 kDa (His-MinD dimer), as determined from molecular weight standards.CC BY · PubMed Central
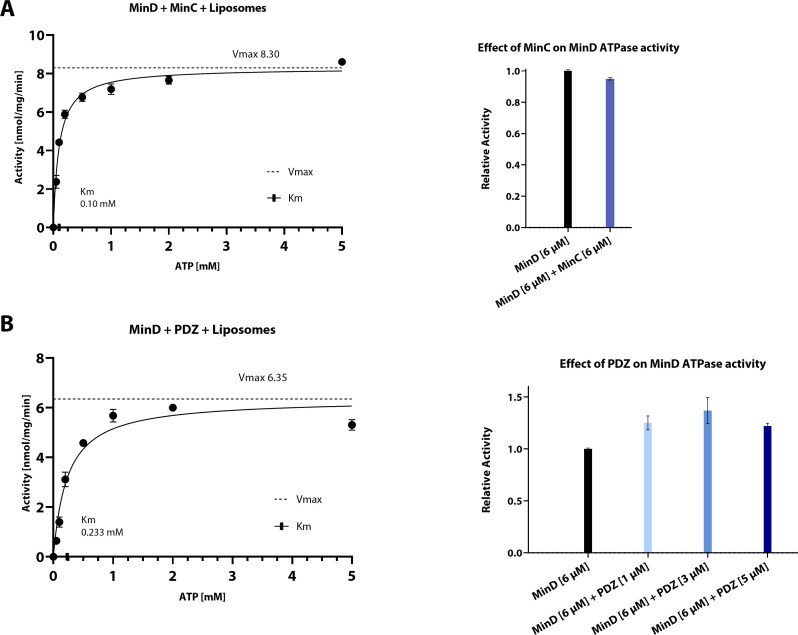
Figure 2. Biochemical analysis of the effect of His-MinC or His-PDZ on MinD ATPase activity. (A) Left: Specific activity of MinD measured as a function of ATP concentration. Phosphate release was measured using the EnzChek phosphate assay kit. Samples contained 6 µM His-MinD, 6 µM His-MinC, and 0.2 mg ml–1 liposomes and were pre-incubated for 10 min before addition of 2 mM Mg2+-ATP; n≥3. Fitting the Michaelis-Menten equation (black lines) gives kcat = 15.77 hr−1, Vmax = 8.30 nmol mg–1 min–1 and KM = 0.10 mM. Right: Relative activity of 6 µM His-MinD in the presence of 6 µM His-MinC (blue) compared to an internal control of 6 µM His-MinD (black, relative activity = 1). Whiskers represent SD. Specific activity of only His-MinD was 8.61 [nmol mg–1 min–1] (SD = 0.03, n=2). Relative activity of 6 µM His-MinD in the presence of 6 µM His-MinC was 0.95 with SD = 0.071 (n=3). Significance was assessed by performing Welch’s t-test on the raw data. p<0.05. (B) Left: Specific activity of MinD measured as a function of ATP concentration. Phosphate release was measured using the EnzChek phosphate assay kit. Samples contained 6 µM His-MinD, 5 µM His-PDZ, and 0.2 mg ml–1 liposomes and were pre-incubated for 10 min before addition of 2 mM Mg2+-ATP; n≥3. Fitting the Michaelis-Menten equation (black lines) gives kcat = 12.07 hr−1, Vmax = 6.35 nmol mg–1 min–1 and KM = 0.233 mM. Right: Relative activity of 6 μM His-MinD in the presence of different concentrations of His-PDZ (blue) compared to only 6 μM His-MinD (black, relative activity = 1). Whiskers represent SD. Specific activity of an internal control of His-MinD was 4.60 nmol mg–1 min–1 (SD = 0.03, n=2). Relative activities of His-MinD in the presence of 1 µM, 3 µM, and 5 µM His-PDZ were 1.22, 1.37, and 1.25 with SD = 0.07, 0.13, and 0.03, respectively (n=3 each). Significance was assessed by performing Welch’s t-test on the raw data of all samples vs. control. p<0.05 for all PDZ concentrations.
Figure 2. Biochemical analysis of the effect of His-MinC or His-PDZ on MinD ATPase activity. (A) Left: Specific activity of MinD measured as a function of ATP concentration. Phosphate release was measured using the EnzChek phosphate assay kit. Samples contained 6 µM His-MinD, 6 µM His-MinC, and 0.2 mg ml–1 liposomes and were pre-incubated for 10 min before addition of 2 mM Mg2+-ATP; n≥3. Fitting the Michaelis-Menten equation (black lines) gives kcat = 15.77 hr−1, Vmax = 8.30 nmol mg–1 min–1 and KM = 0.10 mM. Right: Relative activity of 6 µM His-MinD in the presence of 6 µM His-MinC (blue) compared to an internal control of 6 µM His-MinD (black, relative activity = 1). Whiskers represent SD. Specific activity of only His-MinD was 8.61 [nmol mg–1 min–1] (SD = 0.03, n=2). Relative activity of 6 µM His-MinD in the presence of 6 µM His-MinC was 0.95 with SD = 0.071 (n=3). Significance was assessed by performing Welch’s t-test on the raw data. p<0.05. (B) Left: Specific activity of MinD measured as a function of ATP concentration. Phosphate release was measured using the EnzChek phosphate assay kit. Samples contained 6 µM His-MinD, 5 µM His-PDZ, and 0.2 mg ml–1 liposomes and were pre-incubated for 10 min before addition of 2 mM Mg2+-ATP; n≥3. Fitting the Michaelis-Menten equation (black lines) gives kcat = 12.07 hr−1, Vmax = 6.35 nmol mg–1 min–1 and KM = 0.233 mM. Right: Relative activity of 6 μM His-MinD in the presence of different concentrations of His-PDZ (blue) compared to only 6 μM His-MinD (black, relative activity = 1). Whiskers represent SD. Specific activity of an internal control of His-MinD was 4.60 nmol mg–1 min–1 (SD = 0.03, n=2). Relative activities of His-MinD in the presence of 1 µM, 3 µM, and 5 µM His-PDZ were 1.22, 1.37, and 1.25 with SD = 0.07, 0.13, and 0.03, respectively (n=3 each). Significance was assessed by performing Welch’s t-test on the raw data of all samples vs. control. p<0.05 for all PDZ concentrations.CC BY · PubMed Central
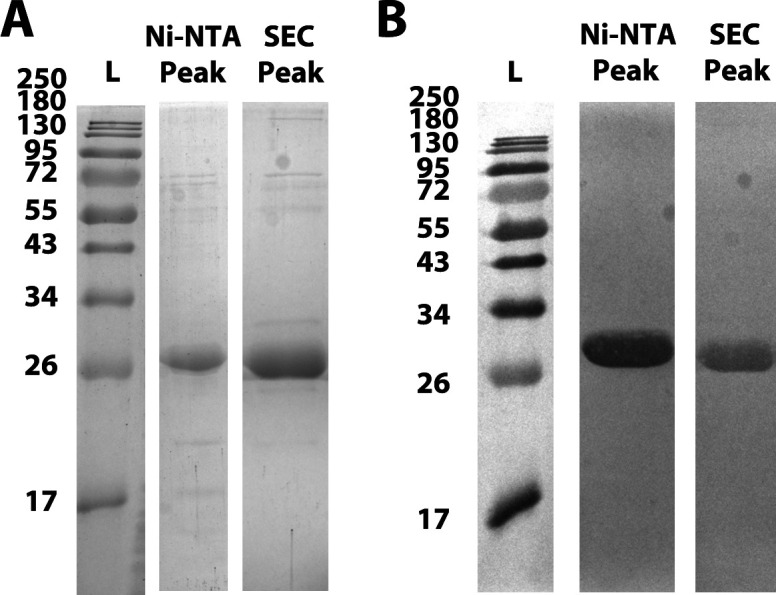
Figure 2—figure supplement 1. His-MinC purification analysis. (A) Sodium dodecyl sulfate-polyacrylamide gel electrophoresis (SDS-PAGE) gel analysis of purification products of His-MinC (27.3 kDa), stained with Coomassie blue stain. From left to right: Ladder, Ni-NTA peak, SEC peak. Ladder = Color Prestained Protein Standard, Broad Range (New England Biolabs). (B) Western blot of replicate gels from (A) using Penta-His antibody (QIAGEN).
Figure 2—figure supplement 1. His-MinC purification analysis. (A) Sodium dodecyl sulfate-polyacrylamide gel electrophoresis (SDS-PAGE) gel analysis of purification products of His-MinC (27.3 kDa), stained with Coomassie blue stain. From left to right: Ladder, Ni-NTA peak, SEC peak. Ladder = Color Prestained Protein Standard, Broad Range (New England Biolabs). (B) Western blot of replicate gels from (A) using Penta-His antibody (QIAGEN).CC BY · PubMed Central
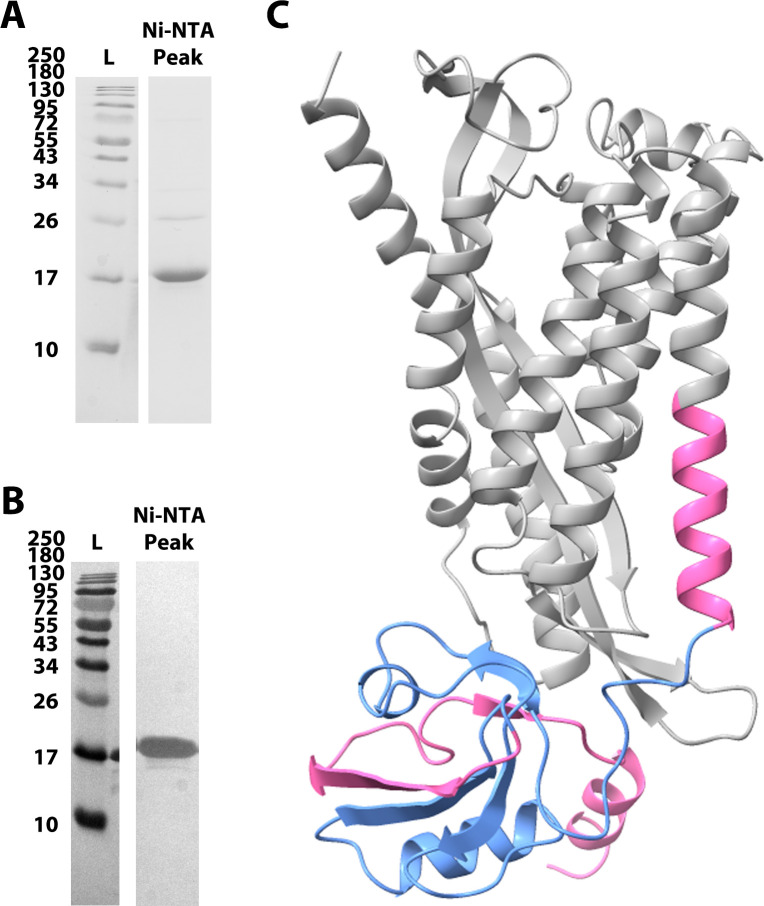
Figure 2—figure supplement 2. His-PDZ purification analysis and rendering of MinJ AlphaFold model. (A) Sodium dodecyl sulfate-polyacrylamide gel electrophoresis (SDS-PAGE) gel analysis of purification products of His-PDZ (17.6 kDa), stained with Coomassie blue stain. From left to right: Ladder (L), Ni-NTA main peak. Ladder = Color Prestained Protein Standard, Broad Range (New England Biolabs). (B) Western blot of replicate gel from (A) using Penta-His antibody (QIAGEN). (C) Rendering of AlphaFold3 model of B. subtilis MinJ (gray) (Abramson et al., 2024). The truncation expressed with pET-28a-PDZ, which includes the PDZ domain (blue), is highlighted in pink.
Figure 2—figure supplement 2. His-PDZ purification analysis and rendering of MinJ AlphaFold model. (A) Sodium dodecyl sulfate-polyacrylamide gel electrophoresis (SDS-PAGE) gel analysis of purification products of His-PDZ (17.6 kDa), stained with Coomassie blue stain. From left to right: Ladder (L), Ni-NTA main peak. Ladder = Color Prestained Protein Standard, Broad Range (New England Biolabs). (B) Western blot of replicate gel from (A) using Penta-His antibody (QIAGEN). (C) Rendering of AlphaFold3 model of B. subtilis MinJ (gray) (Abramson et al., 2024). The truncation expressed with pET-28a-PDZ, which includes the PDZ domain (blue), is highlighted in pink.CC BY · PubMed Central
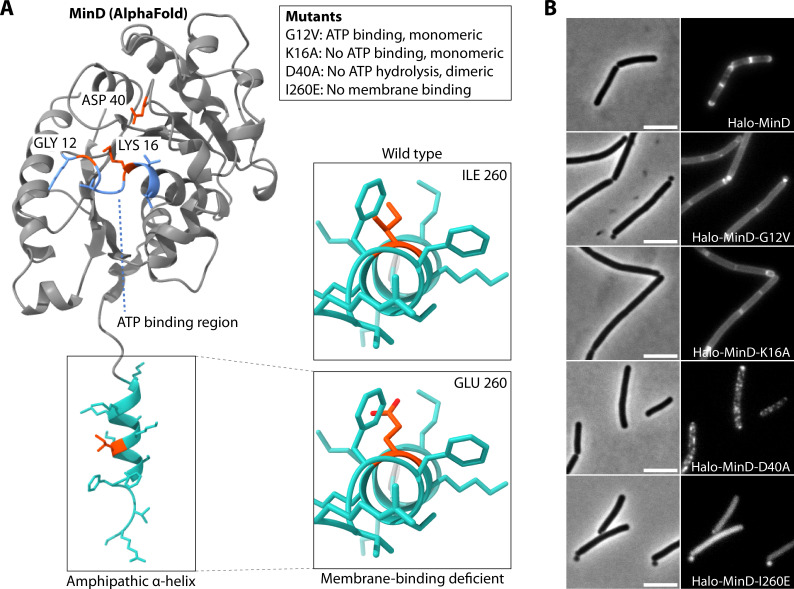
Figure 3. Cartoon of MinD AlphaFold model with highlighted key amino acids and the effects of their mutagenesis. (A) Left: Rendering of MinD AlphaFold model with ATP binding region highlighted in light blue, membrane targeting sequence (MTS) in turquoise, and key residues in orange. Box: explanation of mutagenesis effects. Right: Close-up on hydrophobic region of amphipathic helix. (B) Representative wide-field microscopy images of B. subtilis expressing indicated Halo-MinD variants as the only MinD copy from the native locus, stained with TMR ligand. Left: phase contrast; scale bar 5 µm. Right: fluorescence.
Figure 3. Cartoon of MinD AlphaFold model with highlighted key amino acids and the effects of their mutagenesis. (A) Left: Rendering of MinD AlphaFold model with ATP binding region highlighted in light blue, membrane targeting sequence (MTS) in turquoise, and key residues in orange. Box: explanation of mutagenesis effects. Right: Close-up on hydrophobic region of amphipathic helix. (B) Representative wide-field microscopy images of B. subtilis expressing indicated Halo-MinD variants as the only MinD copy from the native locus, stained with TMR ligand. Left: phase contrast; scale bar 5 µm. Right: fluorescence.CC BY · PubMed Central
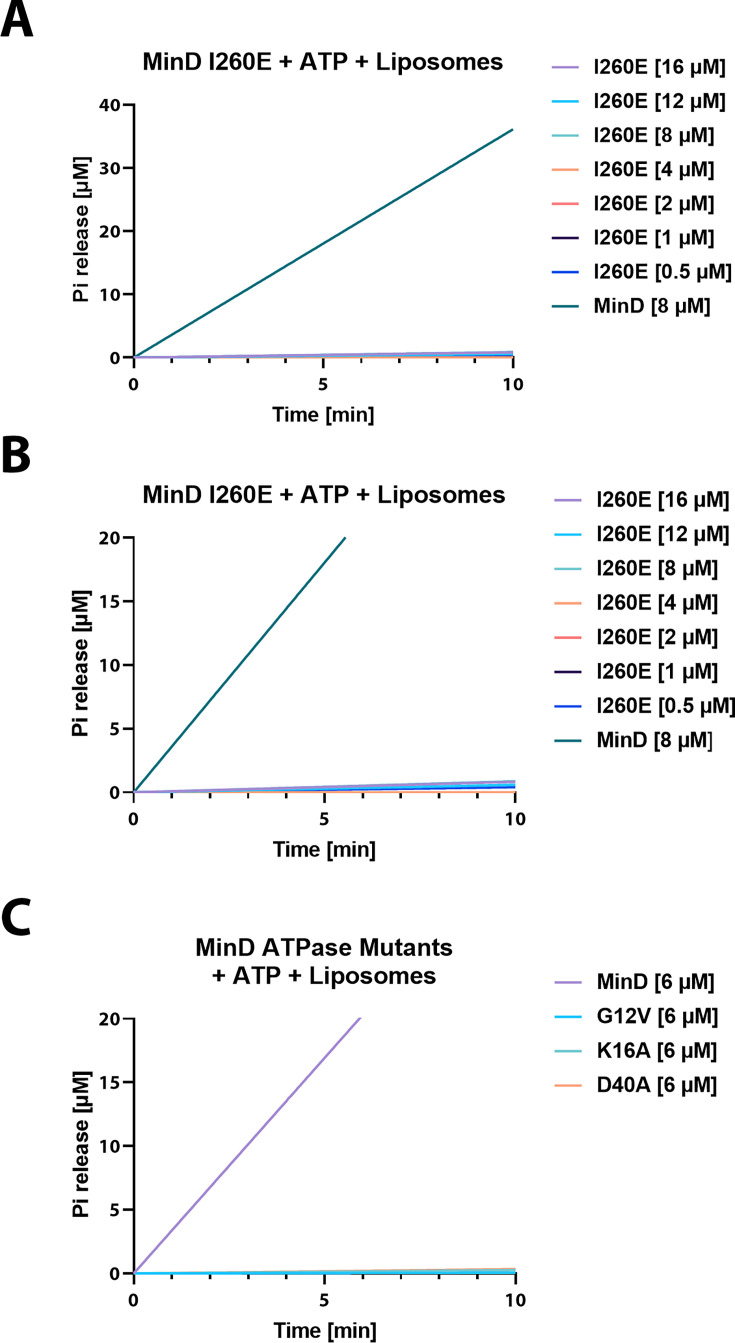
Figure 4. His-MinD mutants are catalytically inactive in ATP hydrolysis assay. (A) Phosphate release plotted against different His-MinD-I260E concentrations and His-MinD as control, fitted with a simple linear regression. Phosphate release was measured using the EnzChek phosphate assay kit. Samples contain 0.2 mg ml–1 liposomes and were pre-incubated for 10 min before the addition of 2 mM Mg2+-ATP. (B) Same as (A) but with different y-axis scaling for better visualization of His-MinD-I260E baseline activity. (C) Same as (B) but comparing His-MinD mutants G12V, K16A, and D40A to His-MinD at 6 µM concentrations, respectively.
Figure 4. His-MinD mutants are catalytically inactive in ATP hydrolysis assay. (A) Phosphate release plotted against different His-MinD-I260E concentrations and His-MinD as control, fitted with a simple linear regression. Phosphate release was measured using the EnzChek phosphate assay kit. Samples contain 0.2 mg ml–1 liposomes and were pre-incubated for 10 min before the addition of 2 mM Mg2+-ATP. (B) Same as (A) but with different y-axis scaling for better visualization of His-MinD-I260E baseline activity. (C) Same as (B) but comparing His-MinD mutants G12V, K16A, and D40A to His-MinD at 6 µM concentrations, respectively.CC BY · PubMed Central
Figure 4—figure supplement 1. His-MinD-I260E purification analysis. (A) Sodium dodecyl sulfate-polyacrylamide gel electrophoresis (SDS-PAGE) gel analysis of purification products of His-MinD-I260E (31.7 kDa), stained with Coomassie blue stain. From left to right: Ladder, supernatant after lysis, pellet, Ni-NTA flowthrough, Ni-NTA peaks A10 and C4 (main peak), concentrated sample, gel filtration peak. Ladder = Color Prestained Protein Standard, Broad Range (New England Biolabs). (B) Western blot of replicate gel from (A) using Penta-His antibody (QIAGEN).
Figure 4—figure supplement 1. His-MinD-I260E purification analysis. (A) Sodium dodecyl sulfate-polyacrylamide gel electrophoresis (SDS-PAGE) gel analysis of purification products of His-MinD-I260E (31.7 kDa), stained with Coomassie blue stain. From left to right: Ladder, supernatant after lysis, pellet, Ni-NTA flowthrough, Ni-NTA peaks A10 and C4 (main peak), concentrated sample, gel filtration peak. Ladder = Color Prestained Protein Standard, Broad Range (New England Biolabs). (B) Western blot of replicate gel from (A) using Penta-His antibody (QIAGEN).CC BY · PubMed Central
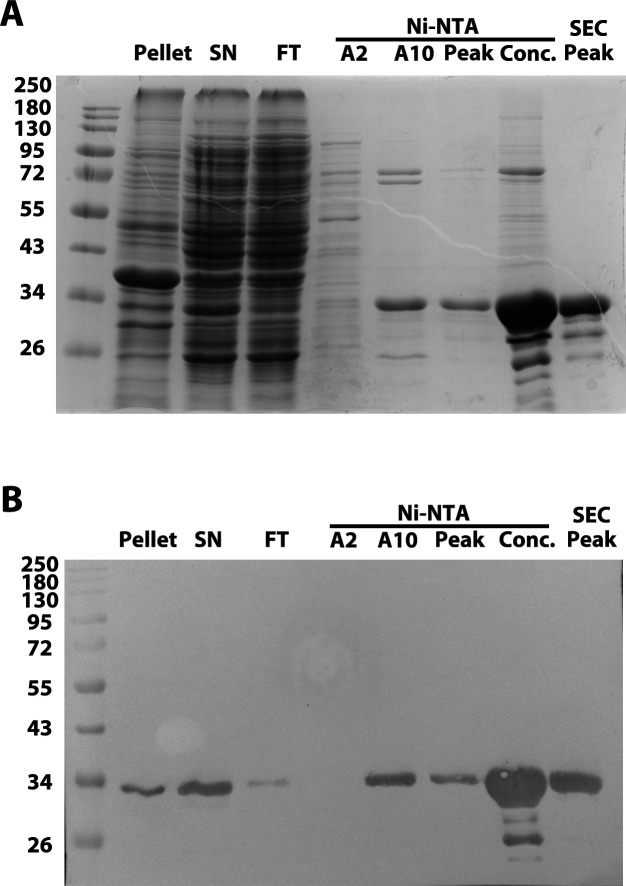
Figure 4—figure supplement 2. His-MinD-G12V purification analysis. (A) Sodium dodecyl sulfate-polyacrylamide gel electrophoresis (SDS-PAGE) gel analysis of purification products of His-MinD-G12V (31.7 kDa), stained with Coomassie blue stain. From left to right: Ladder, pellet after lysate, supernatant, Ni-NTA flowthrough, Ni-NTA peaks A2, A10, C4 (main peak), concentrated sample, gel filtration peak. Ladder = Color Prestained Protein Standard, Broad Range (New England Biolabs). (B) Western blot of replicate gel from (A) using Penta-His antibody (QIAGEN).
Figure 4—figure supplement 2. His-MinD-G12V purification analysis. (A) Sodium dodecyl sulfate-polyacrylamide gel electrophoresis (SDS-PAGE) gel analysis of purification products of His-MinD-G12V (31.7 kDa), stained with Coomassie blue stain. From left to right: Ladder, pellet after lysate, supernatant, Ni-NTA flowthrough, Ni-NTA peaks A2, A10, C4 (main peak), concentrated sample, gel filtration peak. Ladder = Color Prestained Protein Standard, Broad Range (New England Biolabs). (B) Western blot of replicate gel from (A) using Penta-His antibody (QIAGEN).CC BY · PubMed Central
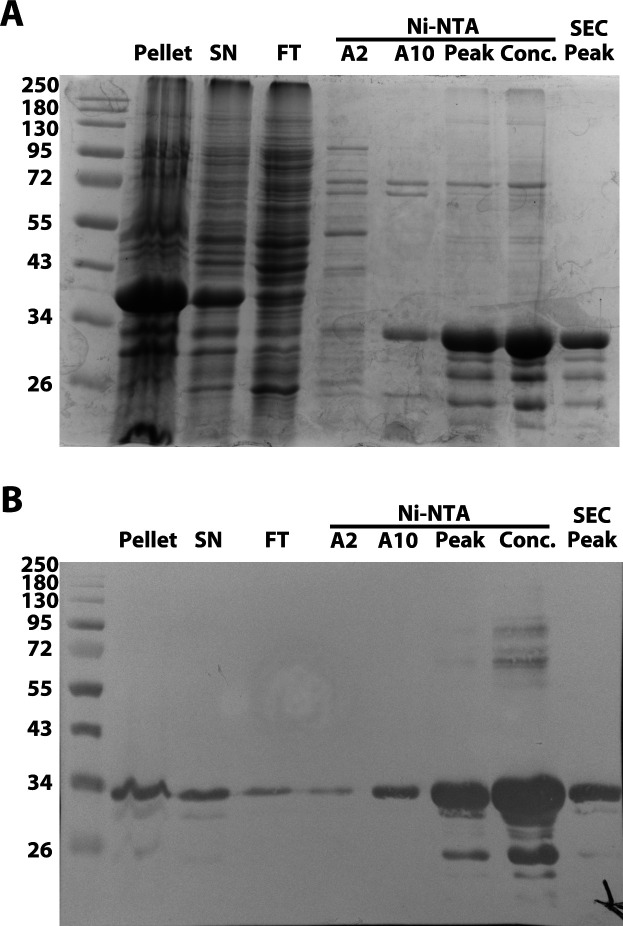
Figure 4—figure supplement 3. His-MinD-K16A purification analysis. (A) Sodium dodecyl sulfate-polyacrylamide gel electrophoresis (SDS-PAGE) gel analysis of purification products of His-MinD-K16A (31.7 kDa), stained with Coomassie blue stain. From left to right: Ladder, pellet after lysate, supernatant, Ni-NTA flowthrough, Ni-NTA peaks A2, A10, C4 (main peak), concentrated sample, gel filtration peak. Ladder = Color Prestained Protein Standard, Broad Range (New England Biolabs). (B) Western blot of replicate gel from (A) using Penta-His antibody (QIAGEN).
Figure 4—figure supplement 3. His-MinD-K16A purification analysis. (A) Sodium dodecyl sulfate-polyacrylamide gel electrophoresis (SDS-PAGE) gel analysis of purification products of His-MinD-K16A (31.7 kDa), stained with Coomassie blue stain. From left to right: Ladder, pellet after lysate, supernatant, Ni-NTA flowthrough, Ni-NTA peaks A2, A10, C4 (main peak), concentrated sample, gel filtration peak. Ladder = Color Prestained Protein Standard, Broad Range (New England Biolabs). (B) Western blot of replicate gel from (A) using Penta-His antibody (QIAGEN).CC BY · PubMed Central
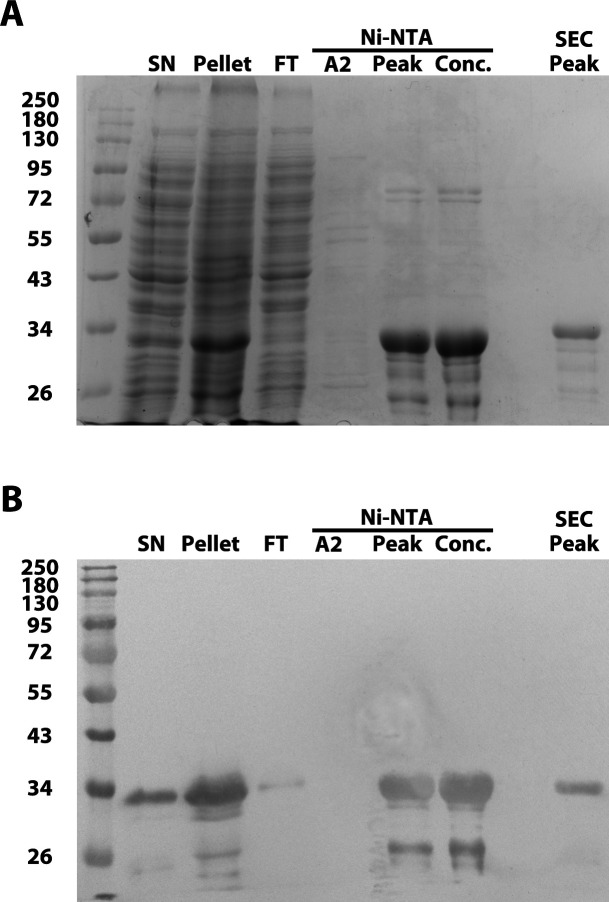
Figure 4—figure supplement 4. His-MinD-D40A purification analysis. (A) Sodium dodecyl sulfate-polyacrylamide gel electrophoresis (SDS-PAGE) gel analysis of purification products of His-MinD-D40A (31.7 kDa), stained with Coomassie blue stain. From left to right: Ladder, supernatant after lysis, pellet, Ni-NTA flowthrough, Ni-NTA peaks A2 and C4 (main peak), concentrated sample, gel filtration peak. Ladder = Color Prestained Protein Standard, Broad Range (New England Biolabs). (B) Western blot of replicate gel from (A) using Penta-His antibody (QIAGEN).
Figure 4—figure supplement 4. His-MinD-D40A purification analysis. (A) Sodium dodecyl sulfate-polyacrylamide gel electrophoresis (SDS-PAGE) gel analysis of purification products of His-MinD-D40A (31.7 kDa), stained with Coomassie blue stain. From left to right: Ladder, supernatant after lysis, pellet, Ni-NTA flowthrough, Ni-NTA peaks A2 and C4 (main peak), concentrated sample, gel filtration peak. Ladder = Color Prestained Protein Standard, Broad Range (New England Biolabs). (B) Western blot of replicate gel from (A) using Penta-His antibody (QIAGEN).CC BY · PubMed Central
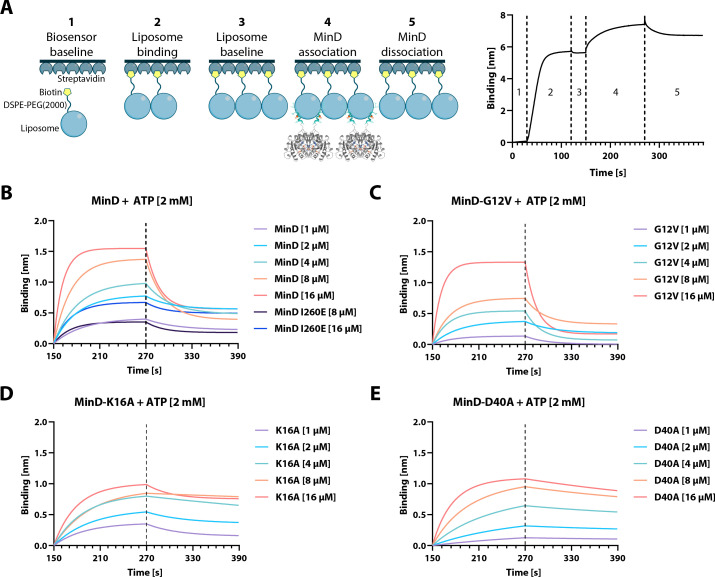
Figure 5. Bio-layer interferometry (BLI) analysis of His-MinD and different mutants. (A) Left: Cartoon representation of the different BLI steps, starting with (1) establishing a baseline in protein buffer, (2) binding of liposomes through the biotinylated DSPE-PEG(2000) phospholipid, (3) establishing a new baseline, (4) binding of MinD, and finally (5) dissociation of MinD. Right: Exemplary graph resulting from sensor readouts of steps (1)–(5). (B) MinD binding plotted against time through association and dissociation phases (steps 4–5) at different protein concentrations, including the His-MinD-I260E mutant. (C–E) Same as (B) using the indicated respective mutants of His-MinD (G12V, K16A, and D40A).
Figure 5. Bio-layer interferometry (BLI) analysis of His-MinD and different mutants. (A) Left: Cartoon representation of the different BLI steps, starting with (1) establishing a baseline in protein buffer, (2) binding of liposomes through the biotinylated DSPE-PEG(2000) phospholipid, (3) establishing a new baseline, (4) binding of MinD, and finally (5) dissociation of MinD. Right: Exemplary graph resulting from sensor readouts of steps (1)–(5). (B) MinD binding plotted against time through association and dissociation phases (steps 4–5) at different protein concentrations, including the His-MinD-I260E mutant. (C–E) Same as (B) using the indicated respective mutants of His-MinD (G12V, K16A, and D40A).CC BY · PubMed Central
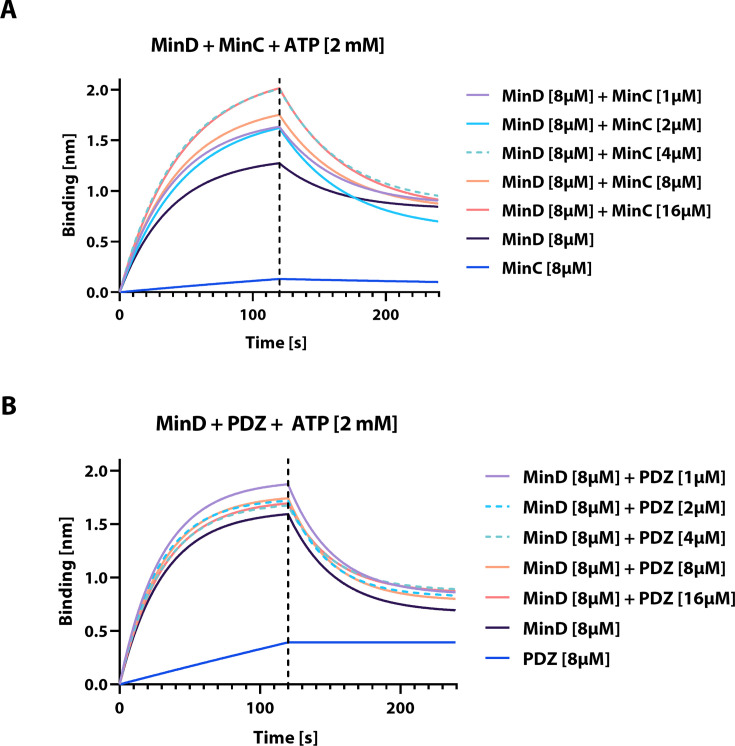
Figure 5—figure supplement 1. Bio-layer interferometry (BLI) analysis of interactions between His-MinD and His-MinC or His-PDZ. (A) MinD binding (see Figure 5A) plotted against time through association and dissociation phases (steps 4–5) at different indicated His-MinC concentrations, including His-MinD and His-MinC only controls, all in the presence of freshly added ATP [2 mM]. (B) Same as (A) using the indicated respective concentrations of His-PDZ.
Figure 5—figure supplement 1. Bio-layer interferometry (BLI) analysis of interactions between His-MinD and His-MinC or His-PDZ. (A) MinD binding (see Figure 5A) plotted against time through association and dissociation phases (steps 4–5) at different indicated His-MinC concentrations, including His-MinD and His-MinC only controls, all in the presence of freshly added ATP [2 mM]. (B) Same as (A) using the indicated respective concentrations of His-PDZ.CC BY · PubMed Central
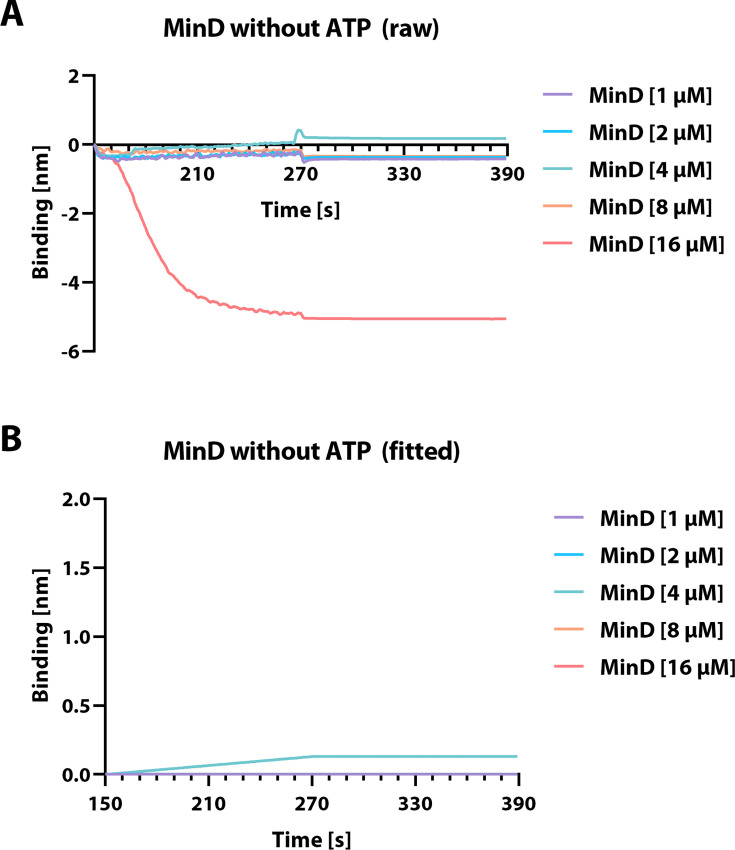
Figure 5—figure supplement 2. Bio-layer interferometry (BLI) analysis of His-MinD without the addition of ATP. His-MinD binding to liposome-associated BLI sensor (see Figure 5), plotted against time through association and dissociation phases at different protein concentrations without the addition of Mg2+-ATP.
Figure 5—figure supplement 2. Bio-layer interferometry (BLI) analysis of His-MinD without the addition of ATP. His-MinD binding to liposome-associated BLI sensor (see Figure 5), plotted against time through association and dissociation phases at different protein concentrations without the addition of Mg2+-ATP.CC BY · PubMed Central
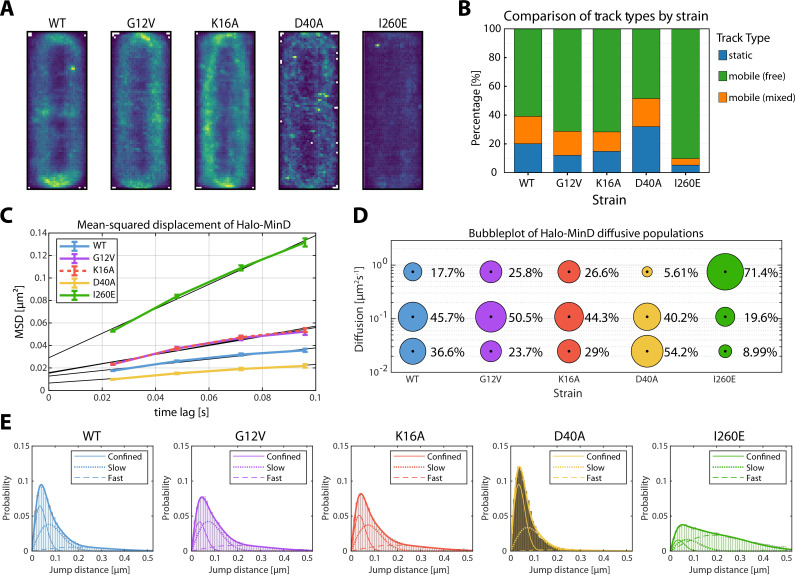
Figure 6. Single-molecule localization microscopy (SMLM) analysis of Halo-MinD and mutants expressed in B. subtilis. Exponentially growing B. subtilis cells expressing Halo-MinD and variants (n≥48 cells, respectively) were stained with TMR ligand and subsequently imaged. Individual protein trajectories were recorded using SMLM and analyzed with Zen Blue (Zeiss), TrackMate, the SMTracker 2.0 software package, and manual scripts in R. Minimum track-length 4 frames of 24 ms, with at least 2596 trajectories per strain. (A) Heatmap representation of intracellular localization of individual molecules of Halo-MinD and variants, respectively, plotted on normalized cells. Brighter colors indicate higher abundance. (B) Barplot of stationary localization analysis (SLA), comparing different track types within the protein population. Tracks were considered static when not leaving a circular area of 97 nm diameter within 5+ frames. Mobile populations were further divided into free and mixed tracks, where mixed tracks displayed a switch between free and confined movement. (C) Plot of the mean-squared displacement of Halo-MinD and variants over time, fitted with a linear fit excluding the last time lag. (D) Bubble plot displaying single-molecule diffusion rates of the indicated MinD fusions. Populations were determined by fitting the probability distributions of the frame-to-frame displacement (jump distance) data of all respective tracks to a three-component model (fast mobile, slow mobile, and confined protein populations). (E) Probability distributions of jump distances of Halo-MinD and variants. Data was fit with a three-component model, indicating confined, slow, and fast tracks.
Figure 6. Single-molecule localization microscopy (SMLM) analysis of Halo-MinD and mutants expressed in B. subtilis. Exponentially growing B. subtilis cells expressing Halo-MinD and variants (n≥48 cells, respectively) were stained with TMR ligand and subsequently imaged. Individual protein trajectories were recorded using SMLM and analyzed with Zen Blue (Zeiss), TrackMate, the SMTracker 2.0 software package, and manual scripts in R. Minimum track-length 4 frames of 24 ms, with at least 2596 trajectories per strain. (A) Heatmap representation of intracellular localization of individual molecules of Halo-MinD and variants, respectively, plotted on normalized cells. Brighter colors indicate higher abundance. (B) Barplot of stationary localization analysis (SLA), comparing different track types within the protein population. Tracks were considered static when not leaving a circular area of 97 nm diameter within 5+ frames. Mobile populations were further divided into free and mixed tracks, where mixed tracks displayed a switch between free and confined movement. (C) Plot of the mean-squared displacement of Halo-MinD and variants over time, fitted with a linear fit excluding the last time lag. (D) Bubble plot displaying single-molecule diffusion rates of the indicated MinD fusions. Populations were determined by fitting the probability distributions of the frame-to-frame displacement (jump distance) data of all respective tracks to a three-component model (fast mobile, slow mobile, and confined protein populations). (E) Probability distributions of jump distances of Halo-MinD and variants. Data was fit with a three-component model, indicating confined, slow, and fast tracks.CC BY · PubMed Central
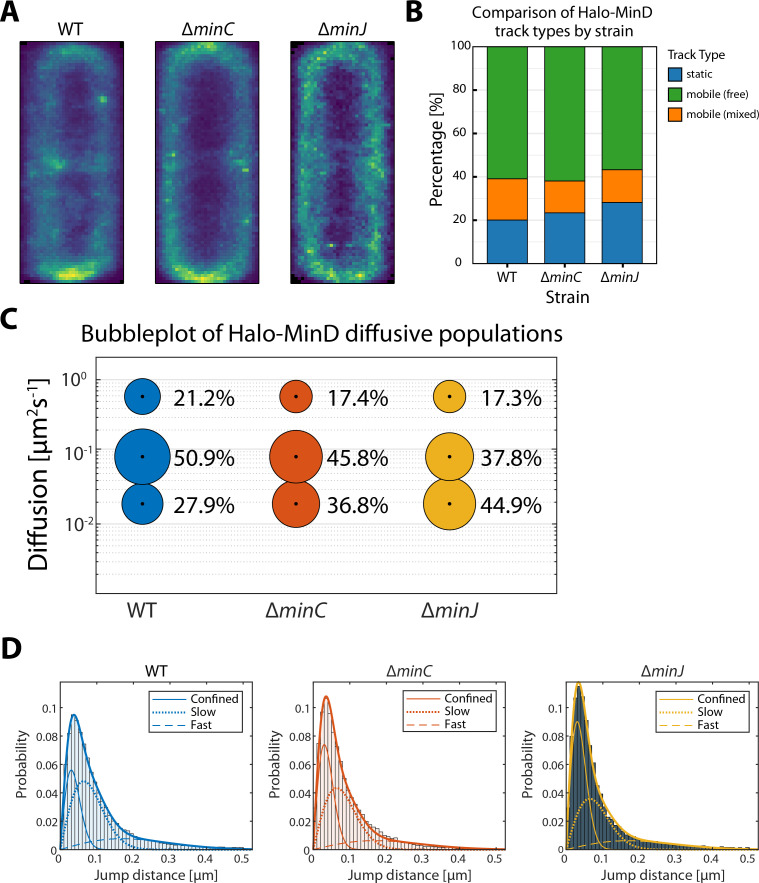
Figure 7. Single-molecule localization microscopy (SMLM) analysis of Halo-MinD expressed in B. subtilis wild-type and mutant backgrounds. Exponentially growing B. subtilis cells expressing Halo-MinD in the indicated genetic backgrounds (n≥115 cells, respectively) were stained with TMR ligand and subsequently imaged. Individual protein trajectories were recorded using SMLM and analyzed with Zen Blue (Zeiss), TrackMate, the SMTracker 2.0 software package, and manual scripts in R. Minimum track-length 4 frames of 24 ms, with at least 2688 trajectories per strain. (A) Heatmap representation of intracellular localization of individual molecules of Halo-MinD in the indicated genetic background, respectively, plotted on normalized cells. Brighter colors indicate higher abundance. (B) Barplot of stationary localization analysis (SLA), comparing different track types within the protein population. Tracks were considered static when not leaving a circular area of 97 nm diameter within 5+ frames. Mobile populations were further divided into free and mixed tracks, where mixed tracks displayed a switch between free and confined movement. (C) Bubble plot displaying single-molecule diffusion rates of Halo-MinD in different genetic backgrounds. Populations were determined by fitting the probability distributions of the frame-to-frame displacement (jump distance) data of all respective tracks to a three-component model (fast mobile, slow mobile, and confined protein populations). (D) Probability distributions of jump distances of Halo-MinD in different genetic backgrounds. Data was fit with a three-component model, indicating confined, slow, and fast tracks.
Figure 7. Single-molecule localization microscopy (SMLM) analysis of Halo-MinD expressed in B. subtilis wild-type and mutant backgrounds. Exponentially growing B. subtilis cells expressing Halo-MinD in the indicated genetic backgrounds (n≥115 cells, respectively) were stained with TMR ligand and subsequently imaged. Individual protein trajectories were recorded using SMLM and analyzed with Zen Blue (Zeiss), TrackMate, the SMTracker 2.0 software package, and manual scripts in R. Minimum track-length 4 frames of 24 ms, with at least 2688 trajectories per strain. (A) Heatmap representation of intracellular localization of individual molecules of Halo-MinD in the indicated genetic background, respectively, plotted on normalized cells. Brighter colors indicate higher abundance. (B) Barplot of stationary localization analysis (SLA), comparing different track types within the protein population. Tracks were considered static when not leaving a circular area of 97 nm diameter within 5+ frames. Mobile populations were further divided into free and mixed tracks, where mixed tracks displayed a switch between free and confined movement. (C) Bubble plot displaying single-molecule diffusion rates of Halo-MinD in different genetic backgrounds. Populations were determined by fitting the probability distributions of the frame-to-frame displacement (jump distance) data of all respective tracks to a three-component model (fast mobile, slow mobile, and confined protein populations). (D) Probability distributions of jump distances of Halo-MinD in different genetic backgrounds. Data was fit with a three-component model, indicating confined, slow, and fast tracks.CC BY · PubMed Central

Verification

Claims the paper makes

The claims and statistics of this paper haven’t been checked yet.

Run the check — free, no account needed. It reads the open-access text and checks the sources it cites.

A few free checks a day · papers already verified open instantly · results are public

Self-check

Percentages, sums and reported differences re-computed from the paper’s own numbers.

The self-check needs the paper’s full text.

Citations

Cites

Research works printed but not linked: 94

  1. Abramson, 2024, Accurate structure prediction of biomolecular interactions with AlphaFold 3, Nature, 630, 493, 10.1038/s41586-024-07487-w · DOI · Paper page
  2. Adams, 2009, Bacterial cell division: assembly, maintenance and disassembly of the Z ring, Nature Reviews. Microbiology, 7, 642, 10.1038/nrmicro2198 · DOI
  3. Adler, 1967, Miniature Escherichia coli cells deficient in DNA, PNAS, 57, 321, 10.1073/pnas.57.2.321 · DOI
  4. Anagnostopoulos, 1961, Requirements for transformation in Bacillus subtilis, Journal of Bacteriology, 81, 741, 10.1128/jb.81.5.741-746.1961 · DOI
  5. Bach, 2014, Imaging DivIVA dynamics using photo-convertible and activatable fluorophores in Bacillus subtilis, Frontiers in Microbiology, 5, 10.3389/fmicb.2014.00059 · DOI
  6. Barak, 1982, Diffusion of low density lipoprotein-receptor complex on human fibroblasts, The Journal of Cell Biology, 95, 846, 10.1083/jcb.95.3.846 · DOI
  7. Bi, 1991, FtsZ ring structure associated with division in Escherichia coli, Nature, 354, 161, 10.1038/354161a0 · DOI
  8. Bohorquez, 2024, Membrane affinity difference between mind monomer and dimer is not crucial for MinD Gradient formation in Bacillus subtilis, 10.1101/2024.06.11.598461 · DOI
  9. Bramkamp, 2008, A novel component of the division-site selection system of Bacillus subtilis and a new mode of action for the division inhibitor MinCD, Molecular Microbiology, 70, 1556, 10.1111/j.1365-2958.2008.06501.x · DOI
  10. Bramkamp, 2009, Division site selection in rod-shaped bacteria, Current Opinion in Microbiology, 12, 683, 10.1016/j.mib.2009.10.002 · DOI
  11. Cameron, 2024, Insights into the assembly and regulation of the bacterial divisome, Nature Reviews. Microbiology, 22, 33, 10.1038/s41579-023-00942-x · DOI
  12. Cordell, 2001, Crystal structure of the bacterial cell division inhibitor MinC, The EMBO Journal, 20, 2454, 10.1093/emboj/20.10.2454 · DOI
  13. Davie, 1984, Genetic basis of minicell formation in Escherichia coli K-12, Journal of Bacteriology, 158, 1202, 10.1128/jb.158.3.1202-1203.1984 · DOI
  14. de Boer, 1989, A division inhibitor and a topological specificity factor coded for by the minicell locus determine proper placement of the division septum in E. coli, Cell, 56, 641, 10.1016/0092-8674(89)90586-2 · DOI
  15. de Boer, 1991, The MinD protein is a membrane ATPase required for the correct placement of the Escherichia coli division site, The EMBO Journal, 10, 4371, 10.1002/j.1460-2075.1991.tb05015.x · DOI
  16. de Boer, 1992, Roles of MinC and MinD in the site-specific septation block mediated by the MinCDE system of Escherichia coli, Journal of Bacteriology, 174, 63, 10.1128/jb.174.1.63-70.1992 · DOI
  17. den Blaauwen, 2017, The divisome at 25: the road ahead, Current Opinion in Microbiology, 36, 85, 10.1016/j.mib.2017.01.007 · DOI
  18. Ducret, 2016, MicrobeJ, a tool for high throughput bacterial cell detection and quantitative analysis, Nature Microbiology, 1, 10.1038/nmicrobiol.2016.77 · DOI
  19. Easter, 2002, ParB-stimulated nucleotide exchange regulates a switch in functionally distinct ParA activities, Molecular Cell, 10, 427, 10.1016/s1097-2765(02)00594-4 · DOI
  20. Egan, 2020, Regulation of peptidoglycan synthesis and remodelling, Nature Reviews. Microbiology, 18, 446, 10.1038/s41579-020-0366-3 · DOI · Paper page
  21. Feddersen, 2021, Dynamics of the Bacillus subtilis min system, mBio, 12, 10.1128/mBio.00296-21 · DOI
  22. Ghosal, 2014, MinCD cell division proteins form alternating copolymeric cytomotive filaments, Nature Communications, 5, 10.1038/ncomms6341 · DOI
  23. Giacomelli, 2022, Subcellular dynamics of a conserved bacterial polar scaffold protein, Genes, 13, 10.3390/genes13020278 · DOI
  24. Goulian, 2000, Tracking single proteins within cells, Biophysical Journal, 79, 2188, 10.1016/S0006-3495(00)76467-8 · DOI
  25. Gregory, 2008, Bacillus subtilis MinC destabilizes FtsZ-rings at new cell poles and contributes to the timing of cell division, Genes & Development, 22, 3475, 10.1101/gad.1732408 · DOI
  26. Halatek, 2012, Highly canalized MinD transfer and MinE sequestration explain the origin of robust MinCDE-protein dynamics, Cell Reports, 1, 741, 10.1016/j.celrep.2012.04.005 · DOI
  27. Halatek, 2018, Self-organization principles of intracellular pattern formation, Philosophical Transactions of the Royal Society of London. Series B, Biological Sciences, 373, 10.1098/rstb.2017.0107 · DOI
  28. Hale, 2001, Dynamic localization cycle of the cell division regulator MinE in Escherichia coli, The EMBO Journal, 20, 1563, 10.1093/emboj/20.7.1563 · DOI
  29. Heermann, 2020, Local self-enhancement of MinD membrane binding in min protein pattern formation, Journal of Molecular Biology, 432, 3191, 10.1016/j.jmb.2020.03.012 · DOI
  30. Heermann, 2021, Mass-sensitive particle tracking to elucidate the membrane-associated MinDE reaction cycle, Nature Methods, 18, 1239, 10.1038/s41592-021-01260-x · DOI
  31. Hu, 1999, Topological regulation of cell division in Escherichia coli involves rapid pole to pole oscillation of the division inhibitor MinC under the control of MinD and MinE, Molecular Microbiology, 34, 82, 10.1046/j.1365-2958.1999.01575.x · DOI
  32. Hu, 1999, The MinC component of the division site selection system in Escherichia coli interacts with FtsZ to prevent polymerization, PNAS, 96, 14819, 10.1073/pnas.96.26.14819 · DOI
  33. Hu, 2000, Analysis of MinC reveals two independent domains involved in interaction with MinD and FtsZ, Journal of Bacteriology, 182, 3965, 10.1128/JB.182.14.3965-3971.2000 · DOI
  34. Hu, 2001, Topological regulation of cell division in E. coli. spatiotemporal oscillation of MinD requires stimulation of its ATPase by MinE and phospholipid, Molecular Cell, 7, 1337, 10.1016/s1097-2765(01)00273-8 · DOI
  35. Hu, 2003, A conserved sequence at the C-terminus of MinD is required for binding to the membrane and targeting MinC to the septum, Molecular Microbiology, 47, 345, 10.1046/j.1365-2958.2003.03321.x · DOI
  36. Ishikawa, 2017, Septal membrane localization by C-terminal amphipathic α-helices of MinD in Bacillus subtilis mutant cells lacking MinJ or DivIVA, Genes & Genetic Systems, 92, 81, 10.1266/ggs.16-00054 · DOI
  37. Jamroškovič, 2012, An oscillating Min system in Bacillus subtilis influences asymmetrical septation during sporulation, Microbiology, 158, 1972, 10.1099/mic.0.059295-0 · DOI
  38. Karoui, 2001, Isolation and characterization of topological specificity mutants of minD in Bacillus subtilis, Molecular Microbiology, 42, 1211, 10.1046/j.1365-2958.2001.02710.x · DOI
  39. Kretschmer, 2016, Pattern formation on membranes and its role in bacterial cell division, Current Opinion in Cell Biology, 38, 52, 10.1016/j.ceb.2016.02.005 · DOI
  40. Lackner, 2003, ATP-dependent interactions between Escherichia coli Min proteins and the phospholipid membrane in vitro, Journal of Bacteriology, 185, 735, 10.1128/JB.185.3.735-749.2003 · DOI
  41. Lee, 1993, The minCD locus of Bacillus subtilis lacks the minE determinant that provides topological specificity to cell division, Molecular Microbiology, 7, 601, 10.1111/j.1365-2958.1993.tb01151.x · DOI
  42. Leonard, 2005, Bacterial chromosome segregation: structure and DNA binding of the Soj dimer--a conserved biological switch, The EMBO Journal, 24, 270, 10.1038/sj.emboj.7600530 · DOI
  43. Levin, 1992, Identification of Bacillus subtilis genes for septum placement and shape determination, Journal of Bacteriology, 174, 6717, 10.1128/jb.174.21.6717-6728.1992 · DOI
  44. Lim, 2014, Evidence for a DNA-relay mechanism in ParABS-mediated chromosome segregation, eLife, 3, 10.7554/eLife.02758 · DOI
  45. Loose, 2008, Spatial regulators for bacterial cell division self-organize into surface waves in vitro, Science, 320, 789, 10.1126/science.1154413 · DOI
  46. Loose, 2011, Min protein patterns emerge from rapid rebinding and membrane interaction of MinE, Nature Structural & Molecular Biology, 18, 577, 10.1038/nsmb.2037 · DOI
  47. Löwe, 1998, Crystal structure of the bacterial cell-division protein FtsZ, Nature, 391, 203, 10.1038/34472 · DOI
  48. Lutkenhaus, 2012, The ParA/MinD family puts things in their place, Trends in Microbiology, 20, 411, 10.1016/j.tim.2012.05.002 · DOI
  49. Mahone, 2020, Bacterial cell division at a glance, Journal of Cell Science, 133, 10.1242/jcs.237057 · DOI
  50. Makroczyová, 2016, Oscillating behavior of Clostridium difficile Min proteins in Bacillus subtilis, MicrobiologyOpen, 5, 387, 10.1002/mbo3.337 · DOI
  51. Marston, 1998, Polar localization of the MinD protein of Bacillus subtilis and its role in selection of the mid-cell division site, Genes & Development, 12, 3419, 10.1101/gad.12.21.3419 · DOI
  52. Marston, 1999, Selection of the midcell division site in Bacillus subtilis through MinD-dependent polar localization and activation of MinC, Molecular Microbiology, 33, 84, 10.1046/j.1365-2958.1999.01450.x · DOI
  53. Maximova, 2019, Peptidomimetic inhibitors targeting the membrane-binding site of the neutrophil proteinase 3, Biochimica et Biophysica Acta. Biomembranes, 1861, 1502, 10.1016/j.bbamem.2019.06.009 · DOI
  54. Mehra, 2025, Phase variation of Clostridioides Difficile colony morphology occurs via modulation of cell division, 10.1101/2025.08.20.671228 · DOI
  55. Miyagi, 2018, High-speed atomic force microscopy reveals the inner workings of the MinDE protein oscillator, Nano Letters, 18, 288, 10.1021/acs.nanolett.7b04128 · DOI
  56. Norrander, 1983, Construction of improved M13 vectors using oligodeoxynucleotide-directed mutagenesis, Gene, 26, 101, 10.1016/0378-1119(83)90040-9 · DOI
  57. Oviedo-Bocanegra, 2021, Single molecule/particle tracking analysis program SMTracker 2.0 reveals different dynamics of proteins within the RNA degradosome complex in Bacillus subtilis, Nucleic Acids Research, 49, 10.1093/nar/gkab696 · DOI
  58. Paintdakhi, 2016, Oufti: an integrated software package for high-accuracy, high-throughput quantitative microscopy analysis, Molecular Microbiology, 99, 767, 10.1111/mmi.13264 · DOI
  59. Patrick, 2008, MinJ (YvjD) is a topological determinant of cell division in Bacillus subtilis, Molecular Microbiology, 70, 1166, 10.1111/j.1365-2958.2008.06469.x · DOI
  60. Peng, 2025, Early onset of septal FtsK localization allows for efficient DNA segregation in SMC-deleted Corynebacterium glutamicum strains, mBio, 16, 10.1128/mbio.02859-24 · DOI
  61. Ponting, 1997, PDZ domains: targeting signalling molecules to sub-membranous sites, BioEssays, 19, 469, 10.1002/bies.950190606 · DOI
  62. Pulianmackal, 2024, Positioning of cellular components by the ParA/MinD family of ATPases, Current Opinion in Microbiology, 79, 10.1016/j.mib.2024.102485 · DOI
  63. Ramm, 2018, In vitro reconstitution of self-organizing protein patterns on supported lipid bilayers, Journal of Visualized Experiments, 28, 10.3791/58139 · DOI
  64. Ramm, 2019, The E. coli MinCDE system in the regulation of protein patterns and gradients, Cellular and Molecular Life Sciences, 76, 4245, 10.1007/s00018-019-03218-x · DOI
  65. Raskin, 1999, Rapid pole-to-pole oscillation of a protein required for directing division to the middle of Escherichia coli, PNAS, 96, 4971, 10.1073/pnas.96.9.4971 · DOI
  66. Rowlett, 2013, The bacterial Min system, Current Biology, 23, R553, 10.1016/j.cub.2013.05.024 · DOI
  67. Rueden, 2017, ImageJ2: ImageJ for the next generation of scientific image data, BMC Bioinformatics, 18, 10.1186/s12859-017-1934-z · DOI
  68. Schäper, 2024, Cell constriction requires processive septal peptidoglycan synthase movement independent of FtsZ treadmilling in Staphylococcus aureus, Nature Microbiology, 9, 1049, 10.1038/s41564-024-01629-6 · DOI
  69. Schaumberg, 1983, Genetic mapping of the minB locus in Escherichia coli K-12, Journal of Bacteriology, 153, 1063, 10.1128/jb.153.2.1063-1065.1983 · DOI
  70. Scheffers, 2008, The effect of MinC on FtsZ polymerization is pH dependent and can be counteracted by ZapA, FEBS Letters, 582, 2601, 10.1016/j.febslet.2008.06.038 · DOI
  71. Schindelin, 2012, Fiji: an open-source platform for biological-image analysis, Nature Methods, 9, 676, 10.1038/nmeth.2019 · DOI · Paper page
  72. Scholefield, 2011, Spo0J regulates the oligomeric state of Soj to trigger its switch from an activator to an inhibitor of DNA replication initiation, Molecular Microbiology, 79, 1089, 10.1111/j.1365-2958.2010.07507.x · DOI
  73. Shen, 2009, The conserved C-terminal tail of FtsZ is required for the septal localization and division inhibitory activity of MinC(C)/MinD, Molecular Microbiology, 72, 410, 10.1111/j.1365-2958.2009.06651.x · DOI
  74. Shen, 2010, Examination of the interaction between FtsZ and MinCN in E. coli suggests how MinC disrupts Z rings, Molecular Microbiology, 75, 1285, 10.1111/j.1365-2958.2010.07055.x · DOI
  75. Squyres, 2021, Single-molecule imaging reveals that Z-ring condensation is essential for cell division in Bacillus subtilis, Nature Microbiology, 6, 553, 10.1038/s41564-021-00878-z · DOI
  76. Strahl, 2010, Membrane potential is important for bacterial cell division, PNAS, 107, 12281, 10.1073/pnas.1005485107 · DOI
  77. Szardenings, 2011, ParA ATPases can move and position DNA and subcellular structures, Current Opinion in Microbiology, 14, 712, 10.1016/j.mib.2011.09.008 · DOI
  78. Szeto, 2002, Membrane localization of MinD is mediated by a C-terminal motif that is conserved across eubacteria, archaea, and chloroplasts, PNAS, 99, 15693, 10.1073/pnas.232590599 · DOI
  79. Szeto, 2003, The MinD membrane targeting sequence is a transplantable lipid-binding helix, The Journal of Biological Chemistry, 278, 40050, 10.1074/jbc.M306876200 · DOI
  80. team P. 2024. RStudio: integrated development environment for r. Posit Software. http://www.positco.
  81. Tinevez, 2017, TrackMate: An open and extensible platform for single-particle tracking, Methods, 115, 80, 10.1016/j.ymeth.2016.09.016 · DOI
  82. Turkowyd, 2016, From single molecules to life: microscopy at the nanoscale, Analytical and Bioanalytical Chemistry, 408, 6885, 10.1007/s00216-016-9781-8 · DOI
  83. Valenčíková, 2018, Clostridial DivIVA and MinD interact in the absence of MinJ, Anaerobe, 50, 22, 10.1016/j.anaerobe.2018.01.013 · DOI
  84. van Baarle, 2010, The MinCDJ system in Bacillus subtilis prevents minicell formation by promoting divisome disassembly, PLOS ONE, 5, 10.1371/journal.pone.0009850 · DOI
  85. Varley, 1992, The divIVB region of the Bacillus subtilis chromosome encodes homologs of Escherichia coli septum placement (minCD) and cell shape (mreBCD) determinants, Journal of Bacteriology, 174, 6729, 10.1128/jb.174.21.6729-6742.1992 · DOI
  86. Vecchiarelli, 2016, Membrane-bound MinDE complex acts as a toggle switch that drives Min oscillation coupled to cytoplasmic depletion of MinD, PNAS, 113, E1479, 10.1073/pnas.1600644113 · DOI
  87. Wallner, 2017, An approach for liposome immobilization using sterically stabilized micelles (SSMs) as a precursor for bio-layer interferometry-based interaction studies, Colloids and Surfaces. B, Biointerfaces, 154, 186, 10.1016/j.colsurfb.2017.03.015 · DOI
  88. Weimann, 2013, A quantitative comparison of single-dye tracking analysis tools using Monte Carlo simulations, PLOS ONE, 8, 10.1371/journal.pone.0064287 · DOI
  89. Weiß, 2023, The MksG nuclease is the executing part of the bacterial plasmid defense system MksBEFG, Nucleic Acids Research, 51, 3288, 10.1093/nar/gkad130 · DOI
  90. Whitley, 2021, FtsZ treadmilling is essential for Z-ring condensation and septal constriction initiation in Bacillus subtilis cell division, Nature Communications, 12, 10.1038/s41467-021-22526-0 · DOI
  91. Wickham, 2016, Elegant Graphics for Data Analysis, 10.1007/978-0-387-98141-3 · DOI · Paper page
  92. Wu, 2011, Determination of the structure of the MinD-ATP complex reveals the orientation of MinD on the membrane and the relative location of the binding sites for MinE and MinC, Molecular Microbiology, 79, 1515, 10.1111/j.1365-2958.2010.07536.x · DOI
  93. Yao, 2014, Fluorescence imaging for bacterial cell biology: from localization to dynamics, from ensembles to single molecules, Annual Review of Microbiology, 68, 459, 10.1146/annurev-micro-091213-113034 · DOI
  94. Yu, 2020, The min system disassembles FtsZ foci and inhibits polar peptidoglycan remodeling in Bacillus subtilis, mBio, 11, 10.1128/mBio.03197-19 · DOI

Metadata

Authors
Feddersen, H., Dyckmans, C., & Bramkamp, M.
Affiliations
Christian-Albrechts-Universität zu Kiel (DE)
Corresponding author
Bramkamp, Marc
Venue
eLife
Published
2026-06-08
Volume
13
ISSN
2050-084X (ISSN-L)
OpenAlex
W4402438708
Cited by
0
References
1
Type
posted content
Language
en
Open access
Locations
  • eLife (publishedVersion, cc-by)
  • PubMed (publishedVersion)
  • PubMed Central (publishedVersion, cc-by)
  • DOAJ (DOAJ: Directory of Open Access Journals) (submittedVersion, cc-by-sa)
Funders
Deutsche Forschungsgemeinschaft (TRR174,P5)
Topics
  • Life Sciences › Biochemistry, Genetics and Molecular Biology › Genetics › Bacterial Genetics and Biotechnology
  • Life Sciences › Biochemistry, Genetics and Molecular Biology › Cell Biology › Microtubule and mitosis dynamics
  • Life Sciences › Biochemistry, Genetics and Molecular Biology › Biophysics › Advanced Fluorescence Microscopy Techniques
Keywords
Min system, mind, MinC, cell division site selection, membrane binding, ATPase activity, ATP binding, protein dimerization, protein diffusion, single-molecule localization microscopy, single-molecule tracking, Bacillus subtilis, cell division
MeSH terms
Single Molecule Imaging, Adenosine Triphosphatases, Adenosine Triphosphate, Bacillus subtilis, Bacterial Proteins, Cell Division, Cell Membrane, Protein Binding, Protein Transport

About these checks

Registry, retraction, Cites and statistics results are computed, not judged, with one exception: a printed reference that no index lists is read once by a model before it counts as a citation error. Claims are extracted by a model and kept only when their quote appears verbatim in the text; each cited source is then checked, with a model’s help, for whether it says what the claim relies on. Those verdicts can be wrong — read the claim’s quote and the cited source before relying on one.

Statistics and arithmetic are recomputed, not judged.

Confidence bands are shown only for fields calibrated on our annotated test set. None is calibrated yet, so no band is shown.

What counts as a claim ›How we measure confidence ›How we check this ›

Are you an author, or do you see a problem with this page? Request a review