Student or educator? Sign up with your school email and get 6 months of Pro free.
Cited by 10Endoplasmic Reticulum Stress and DiseaseHeat shock proteins researchIon Channels and Receptors

The DOI matches its Crossref record; 50 of the 50 references it cites were found in a registry or an index.

Cytosolic and endoplasmic reticulum chaperones inhibit wt-p53 to increase cancer cells' survival by refluxing ER-proteins to the cytosol

Open access
Dabsan, Salam, Zur, Gali, Abu-Freha, Naim, Sofer, Shahar, Grossman-Haham, Iris, Gilad, Ayelet, Igbaria, Aeid·2025·eLife

Published version of a preprint

Abstract

The endoplasmic reticulum (ER) is an essential sensing organelle responsible for the folding and secretion of almost one-third of eukaryotic cells' total proteins. However, environmental, chemical, and genetic insults often lead to protein misfolding in the ER, accumulating misfolded proteins, and causing ER stress. To solve this, several mechanisms were reported to relieve ER stress by decreasing the ER protein load. Recently, we reported a novel ER surveillance mechanism by which proteins from the secretory pathway are refluxed to the cytosol to relieve the ER of its content. The refluxed proteins gain new prosurvival functions in cancer cells, thereby increasing cancer cell fitness. We termed this phenomenon ER to CY tosol S ignaling (or ‘ ERCYS’ ). Here, we found that in mammalian cells, ERCYS is regulated by DNAJB12, DNAJB14, and the HSC70 cochaperone SGTA. Mechanistically, DNAJB12 and DNAJB14 bind HSC70 and SGTA - through their cytosolically localized J-domains to facilitate ER-protein reflux. DNAJB12 is necessary and sufficient to drive this phenomenon to increase AGR2 reflux and inhibit wt-p53 during ER stress. Mutations in DNAJB12/14 J-domain prevent the inhibitory interaction between AGR2-wt-p53. Thus, targeting the DNAJB12/14-HSC70/SGTA axis is a promising strategy to inhibit ERCYS and impair cancer cell fitness.

Overview

The claims and statistics of this paper haven’t been checked yet.

Run the check — free, no account needed. It reads the open-access text and checks the sources it cites.

A few free checks a day · papers already verified open instantly · results are public

Integrity signals

Registry

Crossref · 10.7554/elife.102658

Cites

50 of 50 references verified0 citation errors · 0 not checkable

Statistics

Figures

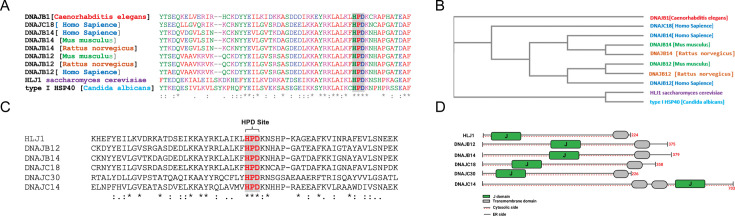
Figure 1. High copy lethal J-protein (HLJ1) is conserved from yeast to humans. (A) Alignment shows the conservation of yeast-HLJ1 and their HPD domain from yeast to humans. (B) Phylogenic analysis showing the conservation of HLJ1 in different species. (C) The HPD motif within the J-domain is conserved in HLJ1 and its putative human orthologs DNAJB12, DNAJB14, DNAJC14, DNAJC18, and DNAJC30. (D) Schematic showing the different domains of HLJ1 and its orthologs, including a cytosolic J-domain, transmembrane domain, and endoplasmic reticulum (ER) domain.
Figure 1. High copy lethal J-protein (HLJ1) is conserved from yeast to humans. (A) Alignment shows the conservation of yeast-HLJ1 and their HPD domain from yeast to humans. (B) Phylogenic analysis showing the conservation of HLJ1 in different species. (C) The HPD motif within the J-domain is conserved in HLJ1 and its putative human orthologs DNAJB12, DNAJB14, DNAJC14, DNAJC18, and DNAJC30. (D) Schematic showing the different domains of HLJ1 and its orthologs, including a cytosolic J-domain, transmembrane domain, and endoplasmic reticulum (ER) domain.CC BY · PubMed Central
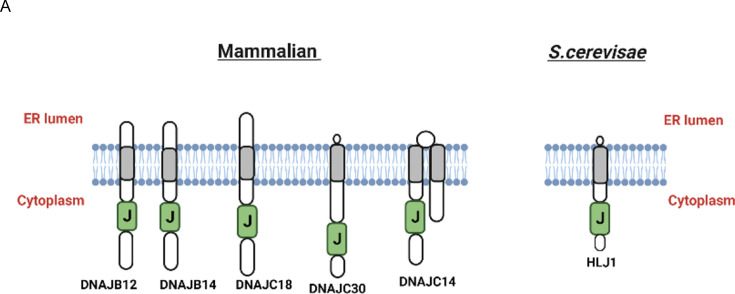
Figure 1—figure supplement 1. High copy lethal J-protein (HLJ1) putative orthologues share the same topology as HLJ1. (A) Schematic showing the comparison between HLJ1 topology and the five putative orthologs as described (Piette et al., 2021) with a J-domain facing the cytosol and small endoplasmic reticulum (ER) domain.
Figure 1—figure supplement 1. High copy lethal J-protein (HLJ1) putative orthologues share the same topology as HLJ1. (A) Schematic showing the comparison between HLJ1 topology and the five putative orthologs as described (Piette et al., 2021) with a J-domain facing the cytosol and small endoplasmic reticulum (ER) domain.CC BY · PubMed Central
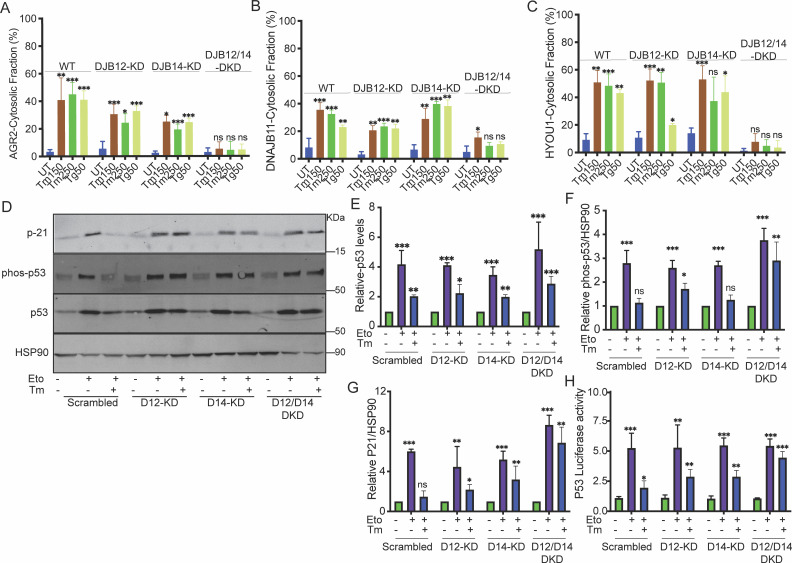
Figure 2. DNAJB12 and DNAJB14 are necessary for AGR2 reflux and wt-p53 inhibition in cancer cells. (A–C) Quantification of the subcellular protein fractionation (Digitonin fraction) of AGR2, DNAJB11, and HYOU1 in A549 cells as shown in (Figure 2—figure supplement 1) N=3. (D) Representative immunoblot of p-21, phospho-p53, total-p53 (DO-1), and HSP90 in control cells and cells lacking DNAJB12, DNAJB14, or both N=3. (E–G) Quantification of p53, phosph-p53, and P-21 levels as shown in D, respectively. (H) A549 were transfected with scrambled siRNA (scrambled), DNAJB12-targeted siRNA (D12–KD), DNAJB14-targeted siRNA (D14–KD), or both. After 24 hr, cells were transfected with p53-luciferase construct. Cells were treated with etoposide for 2 hr to induce wt-p53, followed by tunicamycin treatment for 16 hr, and luciferase experiments were performed. Biological triplicates, mean ± SD calculated using Prism 9 (GraphPad). (***p<0.001, **p<0.01, *p<0.05).
Figure 2. DNAJB12 and DNAJB14 are necessary for AGR2 reflux and wt-p53 inhibition in cancer cells. (A–C) Quantification of the subcellular protein fractionation (Digitonin fraction) of AGR2, DNAJB11, and HYOU1 in A549 cells as shown in (Figure 2—figure supplement 1) N=3. (D) Representative immunoblot of p-21, phospho-p53, total-p53 (DO-1), and HSP90 in control cells and cells lacking DNAJB12, DNAJB14, or both N=3. (E–G) Quantification of p53, phosph-p53, and P-21 levels as shown in D, respectively. (H) A549 were transfected with scrambled siRNA (scrambled), DNAJB12-targeted siRNA (D12–KD), DNAJB14-targeted siRNA (D14–KD), or both. After 24 hr, cells were transfected with p53-luciferase construct. Cells were treated with etoposide for 2 hr to induce wt-p53, followed by tunicamycin treatment for 16 hr, and luciferase experiments were performed. Biological triplicates, mean ± SD calculated using Prism 9 (GraphPad). (***p<0.001, **p<0.01, *p<0.05).CC BY · PubMed Central
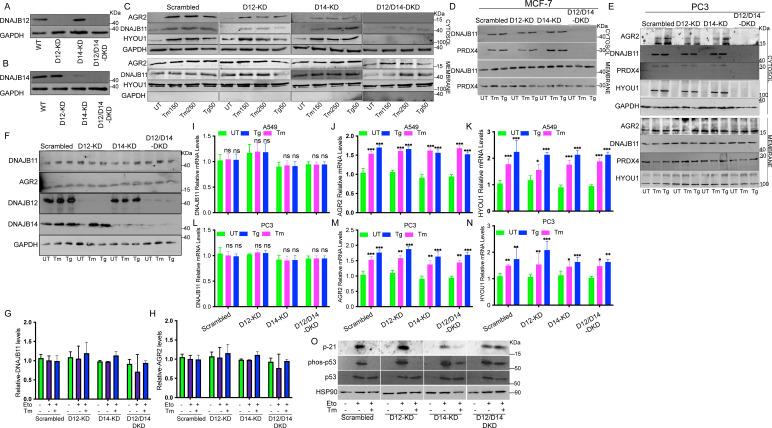
Figure 2—figure supplement 1. DNAJB12 and DNAJB14 are necessary for ER-protein reflux and wt-p53 inhibition in different cancer cell lines. (A, B) Immunoblot showing the expression of DNAJB12 and DNAJB14 in A549 cells transfected with siRNA-targeted DNAJB12, DNAJB14, or both. (C–E) Subcellular protein fractionation (Digitonin fraction) of AGR2, DNAJB11, and HYOU1 during endoplasmic reticulum (ER) stress with tunicamycin (Tm) and Thapsigargin in DNAJB12, DNAJB14, or DNAJB12/14 -silenced A549, MCF-7, and PC3 cells, respectively. (F) Total protein levels from whole cell lysates in A549 cells for AGR2, DNAJB11, DNAJB12, DNAJB14. (G, H) quantification of DNAJB11 and AGR2 protein levels as shown in F. (I–K) Relative mRNA levels of AGR2, DNAJB11, and HYOU1 in A549 cells. (L–N) Relative mRNA levels of AGR2, DNAJB11, and HYOU1 in PC3 cells. (O) p21, phosph-p53 and total-p53 levels in DNAJB12, DNAJB14, and double-knock down cells treated with etoposide and tunicamycin.
Figure 2—figure supplement 1. DNAJB12 and DNAJB14 are necessary for ER-protein reflux and wt-p53 inhibition in different cancer cell lines. (A, B) Immunoblot showing the expression of DNAJB12 and DNAJB14 in A549 cells transfected with siRNA-targeted DNAJB12, DNAJB14, or both. (C–E) Subcellular protein fractionation (Digitonin fraction) of AGR2, DNAJB11, and HYOU1 during endoplasmic reticulum (ER) stress with tunicamycin (Tm) and Thapsigargin in DNAJB12, DNAJB14, or DNAJB12/14 -silenced A549, MCF-7, and PC3 cells, respectively. (F) Total protein levels from whole cell lysates in A549 cells for AGR2, DNAJB11, DNAJB12, DNAJB14. (G, H) quantification of DNAJB11 and AGR2 protein levels as shown in F. (I–K) Relative mRNA levels of AGR2, DNAJB11, and HYOU1 in A549 cells. (L–N) Relative mRNA levels of AGR2, DNAJB11, and HYOU1 in PC3 cells. (O) p21, phosph-p53 and total-p53 levels in DNAJB12, DNAJB14, and double-knock down cells treated with etoposide and tunicamycin.CC BY · PubMed Central
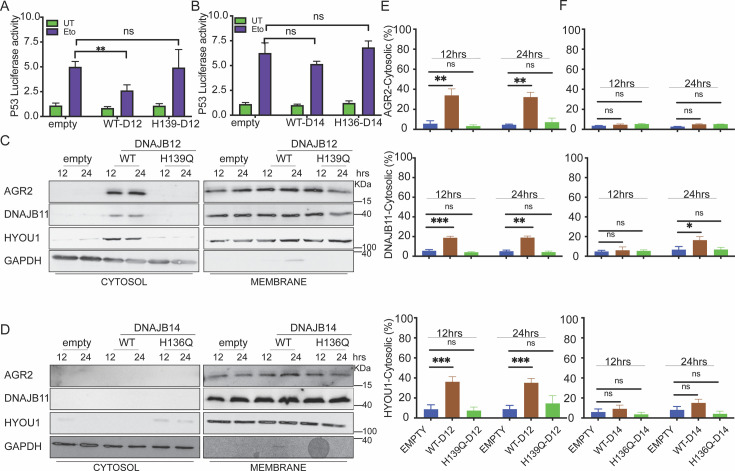
Figure 3. DNAJB12 but not DNAJB14 is sufficient for refluxing AGR2 and other endoplasmic reticulum (ER) resident proteins to inhibit wt-p53 activity. (A, B) Cells were co-transfected with pCDNA3 plasmid expressing DNAJB12, DNAJB14, or the empty plasmid and p53-luciferase construct after 24 hr. Cells were treated with etoposide for 4 hr to induce wt-p5,3, and luciferase experiments were performed. Biological triplicates (N=3), mean ± SD calculated using Prism 9 (GraphPad). (***p<0.001, **p<0.01, *p<0.05). (C, D) Subcellular protein fractionation (Digitonin fraction) of AGR2, DNAJB11, and HYOU1in cells overexpressing WT and QPD mutant of DNAJB12 and DNAJB14, respectively, at different time points. (E, F) Quantification of the subcellular protein fractionation of AGR2, DNAJB11, and HYOU1 in A549 cells as shown in (C, D) Biological quadruplicate (N=4).
Figure 3. DNAJB12 but not DNAJB14 is sufficient for refluxing AGR2 and other endoplasmic reticulum (ER) resident proteins to inhibit wt-p53 activity. (A, B) Cells were co-transfected with pCDNA3 plasmid expressing DNAJB12, DNAJB14, or the empty plasmid and p53-luciferase construct after 24 hr. Cells were treated with etoposide for 4 hr to induce wt-p5,3, and luciferase experiments were performed. Biological triplicates (N=3), mean ± SD calculated using Prism 9 (GraphPad). (***p<0.001, **p<0.01, *p<0.05). (C, D) Subcellular protein fractionation (Digitonin fraction) of AGR2, DNAJB11, and HYOU1in cells overexpressing WT and QPD mutant of DNAJB12 and DNAJB14, respectively, at different time points. (E, F) Quantification of the subcellular protein fractionation of AGR2, DNAJB11, and HYOU1 in A549 cells as shown in (C, D) Biological quadruplicate (N=4).CC BY · PubMed Central
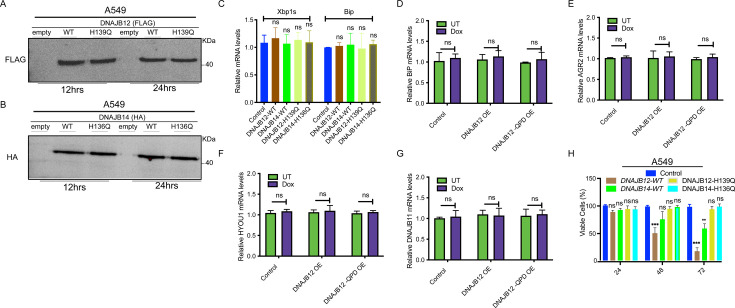
Figure 3—figure supplement 1. DNAJB12 overexpression decreases cell viability without inducing ER stress. (A, B) Immunoblot showing the expression of FLAG-tagged DNAJB12 and HA-tagged DNAJB14 in A549 cells overexpressing either WT and QPD mutant of DNAJB12 or DNAJB14, respectively for 12 hr (left) or 24 hr (right). (C) Relative mRNA levels of spliced Xbp1 and Bip (Unfolded Protein Response markers) in A549 cells overexpressing WT and QPD mutant of DNAJB12 or DNAJB14. (D) Relative BiP mRNA levels in -Rex293 cells overexpressing DAJB12 and the QPD mutant with and without doxycycline (Dox). (E–G) Relative AGR2, HYOU1, and DNAJB11 mRNA levels in A549 cells overexpressing DNAJB12 WT or QPD mutant. (H) Cell viability of A549 cells overexpressing either WT and QPD mutant of DNAJB12 or DNAJB14 for the indicated time points.
Figure 3—figure supplement 1. DNAJB12 overexpression decreases cell viability without inducing ER stress. (A, B) Immunoblot showing the expression of FLAG-tagged DNAJB12 and HA-tagged DNAJB14 in A549 cells overexpressing either WT and QPD mutant of DNAJB12 or DNAJB14, respectively for 12 hr (left) or 24 hr (right). (C) Relative mRNA levels of spliced Xbp1 and Bip (Unfolded Protein Response markers) in A549 cells overexpressing WT and QPD mutant of DNAJB12 or DNAJB14. (D) Relative BiP mRNA levels in -Rex293 cells overexpressing DAJB12 and the QPD mutant with and without doxycycline (Dox). (E–G) Relative AGR2, HYOU1, and DNAJB11 mRNA levels in A549 cells overexpressing DNAJB12 WT or QPD mutant. (H) Cell viability of A549 cells overexpressing either WT and QPD mutant of DNAJB12 or DNAJB14 for the indicated time points.CC BY · PubMed Central
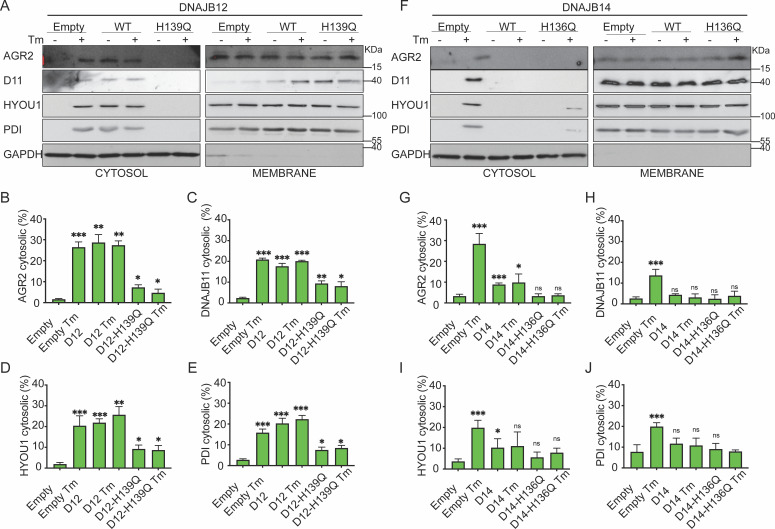
Figure 4. Functional DNAJB12 and 14 are necessary for endoplasmic reticulum (ER) protein reflux during ER stress. (A) Subcellular protein fractionation (Digitonin fraction) of AGR2, DNAJB11, and HYOU1in cells overexpressing either WT and QPD mutant of DNAJB12 during ER stress with tunicamycin (Tm). (B–E) Quantification of the subcellular protein fractionation of AGR2, DNAJB11, and HYOU1 in A549 cells as shown in A and Figure 4—figure supplement 1A. Biological triplicates (N=3) (F) Subcellular protein fractionation (Digitonin fraction) of AGR2, DNAJB11, and HYOU1 in cells overexpressing WT and QPD mutant of DNAJB14 during ER stress with tunicamycin (Tm). (G–J) Quantification of the subcellular protein fractionation of AGR2, DNAJB11, and HYOU1 in A549 cells as shown in F and Figure 4—figure supplement 1B, C. Biological quadruplicates (N=4) (***p<0.001, **p<0.01, *p<0.05).
Figure 4. Functional DNAJB12 and 14 are necessary for endoplasmic reticulum (ER) protein reflux during ER stress. (A) Subcellular protein fractionation (Digitonin fraction) of AGR2, DNAJB11, and HYOU1in cells overexpressing either WT and QPD mutant of DNAJB12 during ER stress with tunicamycin (Tm). (B–E) Quantification of the subcellular protein fractionation of AGR2, DNAJB11, and HYOU1 in A549 cells as shown in A and Figure 4—figure supplement 1A. Biological triplicates (N=3) (F) Subcellular protein fractionation (Digitonin fraction) of AGR2, DNAJB11, and HYOU1 in cells overexpressing WT and QPD mutant of DNAJB14 during ER stress with tunicamycin (Tm). (G–J) Quantification of the subcellular protein fractionation of AGR2, DNAJB11, and HYOU1 in A549 cells as shown in F and Figure 4—figure supplement 1B, C. Biological quadruplicates (N=4) (***p<0.001, **p<0.01, *p<0.05).CC BY · PubMed Central
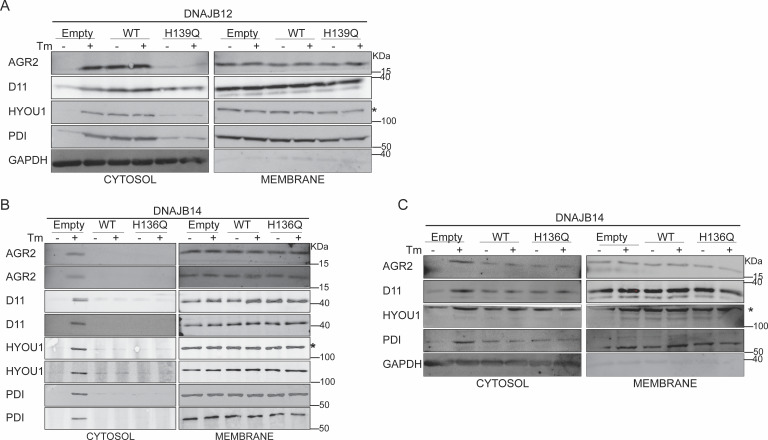
Figure 4—figure supplement 1. Functional DNAJB12 and 14 are necessary for ER protein reflux during ER stress. (A) Subcellular protein fractionation (Digitonin fraction) of AGR2, DNAJB11, and HYOU1 in A549 cells overexpressing WT and QPD mutant of DNAJB12. (B) Subcellular protein fractionation (Digitonin fraction) of AGR2, DNAJB11, and HYOU1in cells overexpressing either WT and QPD mutant of DNAJB14 during endoplasmic reticulum (ER) stress with tunicamycin (Tm). (C) Subcellular protein fractionation (Digitonin fraction) of AGR2, DNAJB11, and HYOU1 in cells overexpressing WT and QPD mutant of DNAJB14 during ER stress with Tm.
Figure 4—figure supplement 1. Functional DNAJB12 and 14 are necessary for ER protein reflux during ER stress. (A) Subcellular protein fractionation (Digitonin fraction) of AGR2, DNAJB11, and HYOU1 in A549 cells overexpressing WT and QPD mutant of DNAJB12. (B) Subcellular protein fractionation (Digitonin fraction) of AGR2, DNAJB11, and HYOU1in cells overexpressing either WT and QPD mutant of DNAJB14 during endoplasmic reticulum (ER) stress with tunicamycin (Tm). (C) Subcellular protein fractionation (Digitonin fraction) of AGR2, DNAJB11, and HYOU1 in cells overexpressing WT and QPD mutant of DNAJB14 during ER stress with Tm.CC BY · PubMed Central
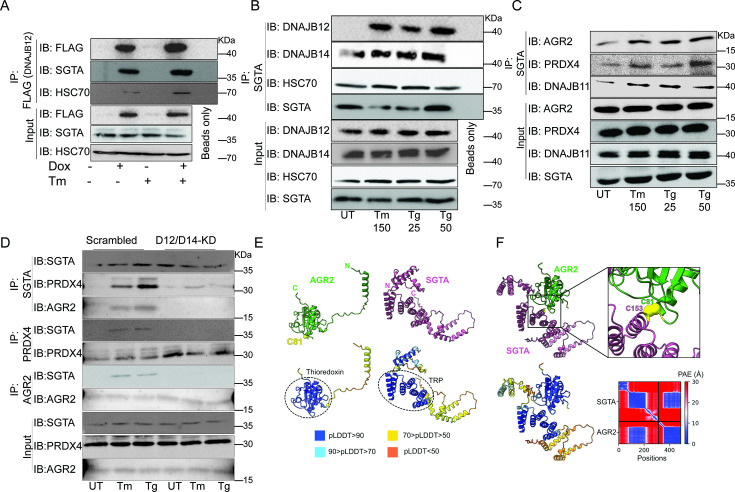
Figure 5. The cytosolic cochaperone SGTA is recruited by DAJB12 and interacts with the refluxed endoplasmic reticulum (ER) protein in the cytosol. (A) T-Rex293 cell lines overexpressing FLAG-tagged DNAJB12 using the Tet-On system for Doxycycline-inducible gene expression were treated with doxycycline to induce DNAJB12 expression. FLAG-DNAJB12 interaction with SGTA was analyzed using coimmunoprecipitation assay N=3. (B) Representative immunoblot showing the interaction between SGTA in one hand and DNAJB12, DNAJB14, and HSC70 in A549 cells treated with tunicamycin and thapsigargin as indicated. Quantified in Figure 5—figure supplement 1I–N. N=3 (C) A representative immunoblot showing the interaction between SGTA and the ER-resident proteins AGR2, PRDX4, and DNAJB11 in A549 cells treated with tunicamycin and thapsigargin as indicated. N=3. (D) A representative immunoblot showing the interaction between SGTA and the ER-resident proteins AGR2, PRDX4, and DNAJB11 in A549 cells depleted of DNAJB12/14 treated with tunicamycin and thapsigargin as indicated. (E) AlphaFold2 modeling of AGR2 and SGTA. N and C termini are shown, as well as cysteine 81 in AGR2. Bottom-coloring DNAJB12-silenced cells according to confidence in prediction according to per-residue confidence (pLDDT) scale (see legend). Note the high confidence in the predictions of the thioredoxin domain in AGR2 and the TRP domain in SGTA (circled in dashed lines). (F) ColabFold modeling of the SGTA-AGR2 interaction interface. The unstructured N-terminal region of AGR2 was removed for clarity. Top – cys81 in AGR2 and cys153 in SGTA are found within bonding distance, shown in stick presentation and colored yellow. Right–zoom into the boxed region, showing the sulfur atoms of the cysteine residues as spheres—bottom - coloring according to confidence in prediction according to pLDDT. Inter predicted aligned error (PAE) plot is shown with regions of low PAE (blue), which indicates a confident prediction.
Figure 5. The cytosolic cochaperone SGTA is recruited by DAJB12 and interacts with the refluxed endoplasmic reticulum (ER) protein in the cytosol. (A) T-Rex293 cell lines overexpressing FLAG-tagged DNAJB12 using the Tet-On system for Doxycycline-inducible gene expression were treated with doxycycline to induce DNAJB12 expression. FLAG-DNAJB12 interaction with SGTA was analyzed using coimmunoprecipitation assay N=3. (B) Representative immunoblot showing the interaction between SGTA in one hand and DNAJB12, DNAJB14, and HSC70 in A549 cells treated with tunicamycin and thapsigargin as indicated. Quantified in Figure 5—figure supplement 1I–N. N=3 (C) A representative immunoblot showing the interaction between SGTA and the ER-resident proteins AGR2, PRDX4, and DNAJB11 in A549 cells treated with tunicamycin and thapsigargin as indicated. N=3. (D) A representative immunoblot showing the interaction between SGTA and the ER-resident proteins AGR2, PRDX4, and DNAJB11 in A549 cells depleted of DNAJB12/14 treated with tunicamycin and thapsigargin as indicated. (E) AlphaFold2 modeling of AGR2 and SGTA. N and C termini are shown, as well as cysteine 81 in AGR2. Bottom-coloring DNAJB12-silenced cells according to confidence in prediction according to per-residue confidence (pLDDT) scale (see legend). Note the high confidence in the predictions of the thioredoxin domain in AGR2 and the TRP domain in SGTA (circled in dashed lines). (F) ColabFold modeling of the SGTA-AGR2 interaction interface. The unstructured N-terminal region of AGR2 was removed for clarity. Top – cys81 in AGR2 and cys153 in SGTA are found within bonding distance, shown in stick presentation and colored yellow. Right–zoom into the boxed region, showing the sulfur atoms of the cysteine residues as spheres—bottom - coloring according to confidence in prediction according to pLDDT. Inter predicted aligned error (PAE) plot is shown with regions of low PAE (blue), which indicates a confident prediction.CC BY · PubMed Central
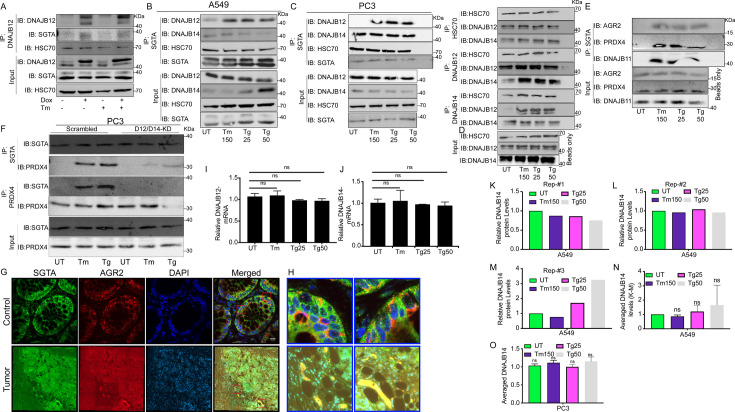
Figure 5—figure supplement 1. The cytosolic cochaperone SGTA interacts with the refluxed ER protein in different cancer cell lines and in tumors isolated from colorectal cancer patients. (A) T-Rex293 cell line overexpressing DNAJB12 using the Tet-On system for Doxycycline-inducible gene expression were treated with doxycycline to induce DNAJB12 expression. DNAJB12 interaction with SGTA was analyzed by coimmunoprecipitation assay. (B) Representative immunoblot showing the interaction between SGTA in one hand and DNAJB12, DNAJB14, and HSC70 in A549 cells treated with tunicamycin and thapsigargin as indicated- quantified in M. (C) Representative immunoblot showing the interaction between SGTA in one hand and DNAJB12, DNAJB14, and HSC70 in PC3 cells treated with tunicamycin and thapsigargin as indicated. (D) Coimmunoprecipitation assay for HSC70, DNAJB12, and DNAJB14 during endoplasmic reticulum (ER) stress with tunicamycin and thapsigargin as indicated. (E) A representative immunoblot showing the interaction between SGTA on one hand and the ER-resident proteins AGR2, PRDX4, and DNAJB11 in A549 cells treated with tunicamycin and thapsigargin as indicated. (F) A representative immunoblot showing the interaction between SGTA and PRDX4 in DNAJB12/14 double knockout PC3 cells treated with tunicamycin and thapsigargin as indicated. (G) Colocalization of SGTA and AGR2 in tumor from Colorectal cancer (CRC) patients. Green SGTA Alexa-Flour 680, Red AGR2 Alexa-Flour 555, scale bar=17µM. (H) Zoom-in on the rectangular zones in (G). (I, J) Relative mRNA levels of DNJB12 and DNAJB14 in A549 cells, respectively. (K–M) Relative DNAJB14 protein levels in A549 cells treated with Tm and Tg in A549 cells as shown in B and Figure 5B (N=3). (N) Average of the DNAJB14 levels calculated in K-M and shown. (O) Averaged DNAJB14 protein levels in PC3 cells (represented in C) treated with tunicamycin (Tm) and Tg (N=3).
Figure 5—figure supplement 1. The cytosolic cochaperone SGTA interacts with the refluxed ER protein in different cancer cell lines and in tumors isolated from colorectal cancer patients. (A) T-Rex293 cell line overexpressing DNAJB12 using the Tet-On system for Doxycycline-inducible gene expression were treated with doxycycline to induce DNAJB12 expression. DNAJB12 interaction with SGTA was analyzed by coimmunoprecipitation assay. (B) Representative immunoblot showing the interaction between SGTA in one hand and DNAJB12, DNAJB14, and HSC70 in A549 cells treated with tunicamycin and thapsigargin as indicated- quantified in M. (C) Representative immunoblot showing the interaction between SGTA in one hand and DNAJB12, DNAJB14, and HSC70 in PC3 cells treated with tunicamycin and thapsigargin as indicated. (D) Coimmunoprecipitation assay for HSC70, DNAJB12, and DNAJB14 during endoplasmic reticulum (ER) stress with tunicamycin and thapsigargin as indicated. (E) A representative immunoblot showing the interaction between SGTA on one hand and the ER-resident proteins AGR2, PRDX4, and DNAJB11 in A549 cells treated with tunicamycin and thapsigargin as indicated. (F) A representative immunoblot showing the interaction between SGTA and PRDX4 in DNAJB12/14 double knockout PC3 cells treated with tunicamycin and thapsigargin as indicated. (G) Colocalization of SGTA and AGR2 in tumor from Colorectal cancer (CRC) patients. Green SGTA Alexa-Flour 680, Red AGR2 Alexa-Flour 555, scale bar=17µM. (H) Zoom-in on the rectangular zones in (G). (I, J) Relative mRNA levels of DNJB12 and DNAJB14 in A549 cells, respectively. (K–M) Relative DNAJB14 protein levels in A549 cells treated with Tm and Tg in A549 cells as shown in B and Figure 5B (N=3). (N) Average of the DNAJB14 levels calculated in K-M and shown. (O) Averaged DNAJB14 protein levels in PC3 cells (represented in C) treated with tunicamycin (Tm) and Tg (N=3).CC BY · PubMed Central
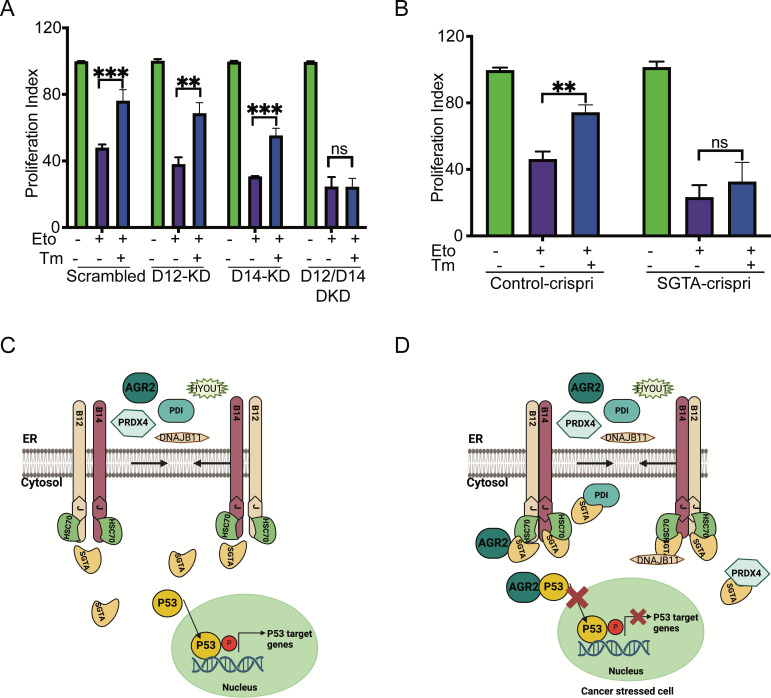
Figure 6. Silencing DNAJB12 and DNAJB14 or SGTA inhibits the rescue cell proliferation under subtoxic endoplasmic reticulum (ER) stress conditions. (A) XTT assay in A549 transfected with scrambled siRNA (scrambled), DNAJB12-targeted siRNA (D12–KD), DNAJB14-targeted siRNA (D14–KD), or both. After 24 hr, cells were treated with etoposide in the presence or absence of Tm for 48 hr. Biological triplicates. (B) XTT assay in SGTA-silenced A549 cells using CRISPRi and treated with etoposide in the presence or absence of tunicamycin for 48 hr. Biological triplicates, mean ± SD calculated using Prism 9 (GraphPad). (***p<0.001, **p<0.01, *p<0.05). Biological triplicates (C, D) Cartoon showing our working model in cancer cells.in normal conditions, there is almost full compartmentation between the ER and the cytosol (C). Under ER stress conditions, DNAJB12 and DNAJB14 recruit cytosolic chaperones and cochaperones (SGTA) to reflux AGR2 and other ER resident proteins to the cytosol and inhibit wt-p53 activity (D). Created with BioRender.com.
Figure 6. Silencing DNAJB12 and DNAJB14 or SGTA inhibits the rescue cell proliferation under subtoxic endoplasmic reticulum (ER) stress conditions. (A) XTT assay in A549 transfected with scrambled siRNA (scrambled), DNAJB12-targeted siRNA (D12–KD), DNAJB14-targeted siRNA (D14–KD), or both. After 24 hr, cells were treated with etoposide in the presence or absence of Tm for 48 hr. Biological triplicates. (B) XTT assay in SGTA-silenced A549 cells using CRISPRi and treated with etoposide in the presence or absence of tunicamycin for 48 hr. Biological triplicates, mean ± SD calculated using Prism 9 (GraphPad). (***p<0.001, **p<0.01, *p<0.05). Biological triplicates (C, D) Cartoon showing our working model in cancer cells.in normal conditions, there is almost full compartmentation between the ER and the cytosol (C). Under ER stress conditions, DNAJB12 and DNAJB14 recruit cytosolic chaperones and cochaperones (SGTA) to reflux AGR2 and other ER resident proteins to the cytosol and inhibit wt-p53 activity (D). Created with BioRender.com.CC BY · PubMed Central
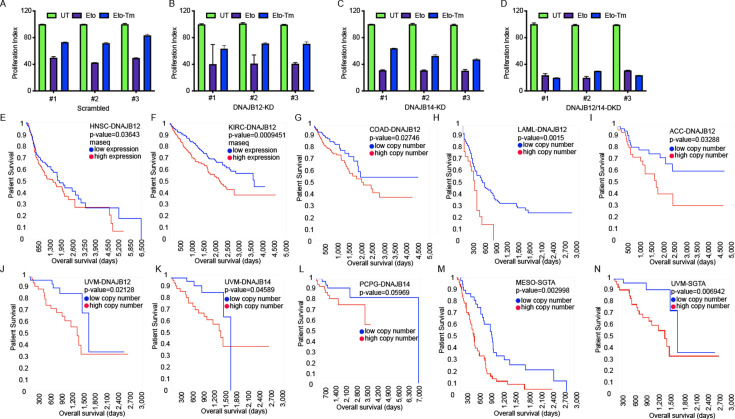
Figure 6—figure supplement 1. DNAJB12, DNAJB14, and SGTA are unfavorable prognostic markers in different cancer types. (A–D) XTT assay in A549 transfected with scramble siRNA (scramble), DNAJB12-targeted siRNA (D12–KD), DNAJB14-targeted siRNA (D14–KD), or both. After 24 hr, cells were treated with etoposide in the presence or absence of Tm for 48 hr. (E, F) DNAJB12 is unfavorable prognostic marker in different cancer types including Head and neck squamous cell carcinoma (HNSC), Kidney renal clear cell carcinoma (KIRC) TCGA survival analysis- rnaseq database, red line represents low expression and blue lines represent high expression. (G–J) High copy number of DNAJB12 is unfavorable prognostic marker in different cancer types including colon adenocarcinoma (COAD), acute myeloid leukemia (LAML), adrenocortical carcinoma (ACC), and uveal melanoma (UVM), red line represents high copy number and blue lines represent low copy number (K, L) High copy number of DNAJB14 is unfavorable prognostic marker in different cancer types including Pheochromocytoma and paraganglioma (PCPG) and UVM, red line represents high copy number and blue lines represent low copy number. (M, N) High copy number of SGTA is unfavorable prognostic marker in different cancer types including mesothelioma (MESO) and UVM, red line represents high copy number and blue lines represent low copy number. For all survival analyses: x-axis shows the patients’ survival duration in months; y-axis shows the patients’ survival rate.The p-values have been calculated using the log-rank test.
Figure 6—figure supplement 1. DNAJB12, DNAJB14, and SGTA are unfavorable prognostic markers in different cancer types. (A–D) XTT assay in A549 transfected with scramble siRNA (scramble), DNAJB12-targeted siRNA (D12–KD), DNAJB14-targeted siRNA (D14–KD), or both. After 24 hr, cells were treated with etoposide in the presence or absence of Tm for 48 hr. (E, F) DNAJB12 is unfavorable prognostic marker in different cancer types including Head and neck squamous cell carcinoma (HNSC), Kidney renal clear cell carcinoma (KIRC) TCGA survival analysis- rnaseq database, red line represents low expression and blue lines represent high expression. (G–J) High copy number of DNAJB12 is unfavorable prognostic marker in different cancer types including colon adenocarcinoma (COAD), acute myeloid leukemia (LAML), adrenocortical carcinoma (ACC), and uveal melanoma (UVM), red line represents high copy number and blue lines represent low copy number (K, L) High copy number of DNAJB14 is unfavorable prognostic marker in different cancer types including Pheochromocytoma and paraganglioma (PCPG) and UVM, red line represents high copy number and blue lines represent low copy number. (M, N) High copy number of SGTA is unfavorable prognostic marker in different cancer types including mesothelioma (MESO) and UVM, red line represents high copy number and blue lines represent low copy number. For all survival analyses: x-axis shows the patients’ survival duration in months; y-axis shows the patients’ survival rate.The p-values have been calculated using the log-rank test.CC BY · PubMed Central
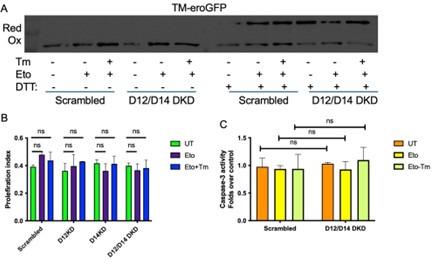
Author response image 1. (A) eroGFP with transmembrane domain (TM-eroGFP) is highly oxidized in the ER in all the indicated conditions. (B) XTT assay in WT, D12KD, D14KD and the DKD cells after treatment with Etoposide and tunicamycin (Tm). (C) Caspase-3 activity in scrambled cells and in the D12/D14 DKD cells.
Author response image 1. (A) eroGFP with transmembrane domain (TM-eroGFP) is highly oxidized in the ER in all the indicated conditions. (B) XTT assay in WT, D12KD, D14KD and the DKD cells after treatment with Etoposide and tunicamycin (Tm). (C) Caspase-3 activity in scrambled cells and in the D12/D14 DKD cells.CC BY · PubMed Central
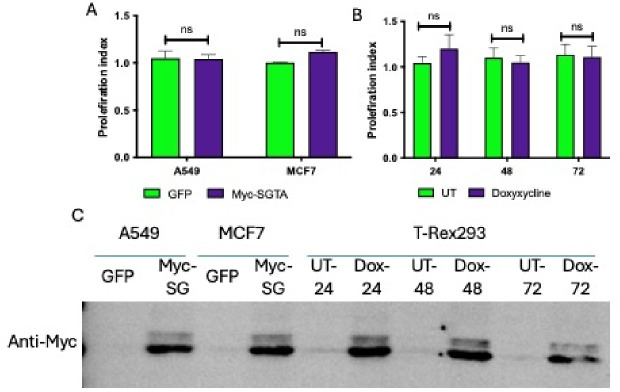
Author response image 2. (A) XTT assay in A549 and MCF7 cells transfected with CMV-GFP or CMV-Myc-SGTA. (B) XTT assay in T-Rex293 cells treated with Dox for the indicated time. (C) SGTA protein levels in cells overexpressing Myc-tagged SGTA.
Author response image 2. (A) XTT assay in A549 and MCF7 cells transfected with CMV-GFP or CMV-Myc-SGTA. (B) XTT assay in T-Rex293 cells treated with Dox for the indicated time. (C) SGTA protein levels in cells overexpressing Myc-tagged SGTA.CC BY · PubMed Central

Verification

Claims the paper makes

The claims and statistics of this paper haven’t been checked yet.

Run the check — free, no account needed. It reads the open-access text and checks the sources it cites.

A few free checks a day · papers already verified open instantly · results are public

Self-check

Percentages, sums and reported differences re-computed from the paper’s own numbers.

The self-check needs the paper’s full text.

Citations

Cites

Show all 50 references

Metadata

Authors
Dabsan, S., Zur, G., Abu-Freha, N., Sofer, S., Grossman-Haham, I., Gilad, A., & Igbaria, A.
Affiliations
  • Ben-Gurion University of the Negev (IL)
  • Institute of Gastroenterology and Liver Diseases, Soroka Medical Center, Faculty of Health Sciences, Ben Gurion University of the Negev
  • Department of Life Sciences, Faculty of Natural Sciences, Ben-Gurion University of the Negev
Corresponding author
Igbaria, Aeid
Venue
eLife
Published
2025-04-09
Volume
14
ISSN
2050-084X (ISSN-L)
OpenAlex
W4409291428
Cited by
10
References
50
Citations by year
2026: 5 · 2025: 3
FWCI
3.97
Type
journal article
Language
en
Open access
Locations
  • eLife (publishedVersion, cc-by)
  • bioRxiv (Cold Spring Harbor Laboratory) (acceptedVersion, cc-by-nd)
  • PubMed Central (publishedVersion, cc-by)
  • PubMed (publishedVersion)
  • DOAJ (DOAJ: Directory of Open Access Journals) (submittedVersion, cc-by-sa)
Funders
  • Israel Science Foundation (977/21)
  • Israel Cancer Research Fund (RCDA)
Topics
  • Life Sciences › Biochemistry, Genetics and Molecular Biology › Cell Biology › Endoplasmic Reticulum Stress and Disease
  • Life Sciences › Biochemistry, Genetics and Molecular Biology › Molecular Biology › Heat shock proteins research
  • Life Sciences › Neuroscience › Sensory Systems › Ion Channels and Receptors
Keywords
endoplasmic reticulum stress, Hsc70, SGTA, AGR2, p53 inhibition, molecular chaperones, J-domain, tumor cell survival, secretory pathway, protein misfolding
MeSH terms
Cell Survival, Cytosol, Endoplasmic Reticulum, Humans, Neoplasms, Tumor Suppressor Protein p53, Molecular Chaperones, Cell Line, Tumor, HSC70 Heat-Shock Proteins, HSP40 Heat-Shock Proteins, Endoplasmic Reticulum Stress

About these checks

Registry, retraction, Cites and statistics results are computed, not judged, with one exception: a printed reference that no index lists is read once by a model before it counts as a citation error. Claims are extracted by a model and kept only when their quote appears verbatim in the text; each cited source is then checked, with a model’s help, for whether it says what the claim relies on. Those verdicts can be wrong — read the claim’s quote and the cited source before relying on one.

Statistics and arithmetic are recomputed, not judged.

Confidence bands are shown only for fields calibrated on our annotated test set. None is calibrated yet, so no band is shown.

What counts as a claim ›How we measure confidence ›How we check this ›

Are you an author, or do you see a problem with this page? Request a review

How to cite

Cite CoChat for the checks on this page, and the paper for its own findings.

This page
CoChat. (2026). Citation check: Cytosolic and endoplasmic reticulum chaperones inhibit wt-p53 to increase cancer cells' survival by refluxing ER-proteins to the cytosol. https://app.cochat.ai/papers/10.7554/elife.102658
The paper
Dabsan, S., Zur, G., Abu-Freha, N., Sofer, S., Grossman-Haham, I., Gilad, A., & Igbaria, A. (2025). Cytosolic and endoplasmic reticulum chaperones inhibit wt-p53 to increase cancer cells' survival by refluxing ER-proteins to the cytosol. eLife. https://doi.org/10.7554/elife.102658

Data sources

Bibliographic data: Semantic Scholar, OpenAlex, Crossref.

Contains information from the Semantic Scholar Academic Graph Datasets, made available under the ODC Attribution License (ODC-BY 1.0).

Semantic Scholar’s data is described in: Kinney, R., et al. (2023). The Semantic Scholar Open Data Platform. arXiv:2301.10140.