Cited by 13Protein Structure and DynamicsRNA Research and SplicingRNA and protein synthesis mechanisms

The DOI matches its Crossref record; 137 of the 149 references it cites were found in a registry or an index.

Protein language model identifies disordered, conserved motifs implicated in phase separation

Open access

Published version of a preprint

Abstract

Intrinsically disordered regions (IDRs) play a critical role in phase separation and are essential for the formation of membraneless organelles (MLOs). Mutations within IDRs can disrupt their multivalent interaction networks, altering phase behavior and contributing to various diseases. Therefore, examining the evolutionary constraints of IDRs provides valuable insights into the relationship between protein sequences and phase separation. In this study, we utilized the ESM2 protein language model to map the residue-level mutational tolerance landscapes of IDRs. Our findings reveal that IDRs, particularly those actively participating in phase separation, contain conserved amino acids. This conservation is evident through mutational constraints predicted by ESM2 and supported by direct analyses of multiple sequence alignments. These conserved, disordered amino acids include residues traditionally identified as ‘stickers’ as well as ‘spacers’ and frequently form continuous sequence motifs. The strong conservation, combined with their potential role in phase separation, suggests that these motifs may act as functional units under evolutionary selection to support stable MLO formation. Our findings underscore the insights into phase separation’s molecular grammar made possible through evolutionary analysis enabled by protein language models.

Overview

The claims and statistics of this paper haven’t been checked yet.

Run the check — free, no account needed. It reads the open-access text and checks the sources it cites.

A few free checks a day · papers already verified open instantly · results are public

Integrity signals

Registry

Crossref · 10.7554/elife.105309

Cites

137 of 137 references verified0 citation errors · 0 not checkable

Statistics

Figures
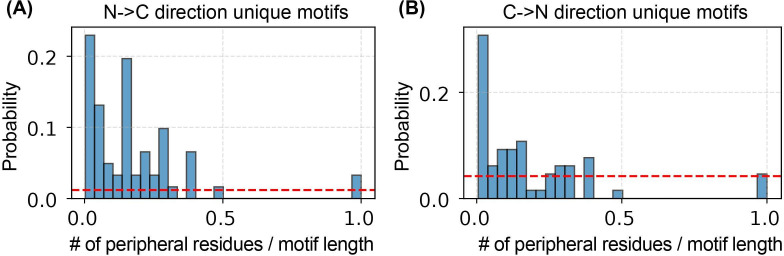
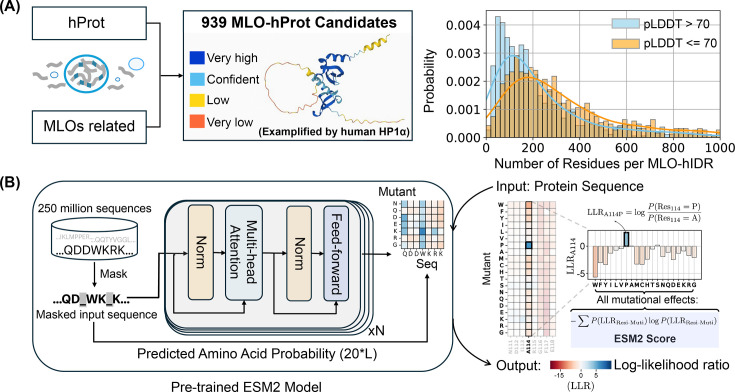
Figure 1. Predicting the mutational landscape of intrinsically disordered regions (IDRs) involved in membraneless organelle (MLO) formation (MLO-hProt) using ESM2. (A) Schematic representation of the MLO-hProt database construction. The right panel shows the distribution of disordered and folded residues identified in each protein, where structural order is assigned using the AlphaFold2-predicted Local Distance Difference Test (pLDDT) score. (B) Workflow of the pretrained ESM2 model (left) (Lin et al., 2023) for predicting the mutational landscape of a given protein sequence (right). Upon receiving a protein sequence as input, ESM2 generates a log-likelihood ratio (LLR) for each mutation type at each residue position. Using the 20-element LLR vector, we compute the ESM2 score for each residue (Equation 1) to assess mutational tolerance.
Figure 1. Predicting the mutational landscape of intrinsically disordered regions (IDRs) involved in membraneless organelle (MLO) formation (MLO-hProt) using ESM2. (A) Schematic representation of the MLO-hProt database construction. The right panel shows the distribution of disordered and folded residues identified in each protein, where structural order is assigned using the AlphaFold2-predicted Local Distance Difference Test (pLDDT) score. (B) Workflow of the pretrained ESM2 model (left) (Lin et al., 2023) for predicting the mutational landscape of a given protein sequence (right). Upon receiving a protein sequence as input, ESM2 generates a log-likelihood ratio (LLR) for each mutation type at each residue position. Using the 20-element LLR vector, we compute the ESM2 score for each residue (Equation 1) to assess mutational tolerance.CC BY · PubMed Central
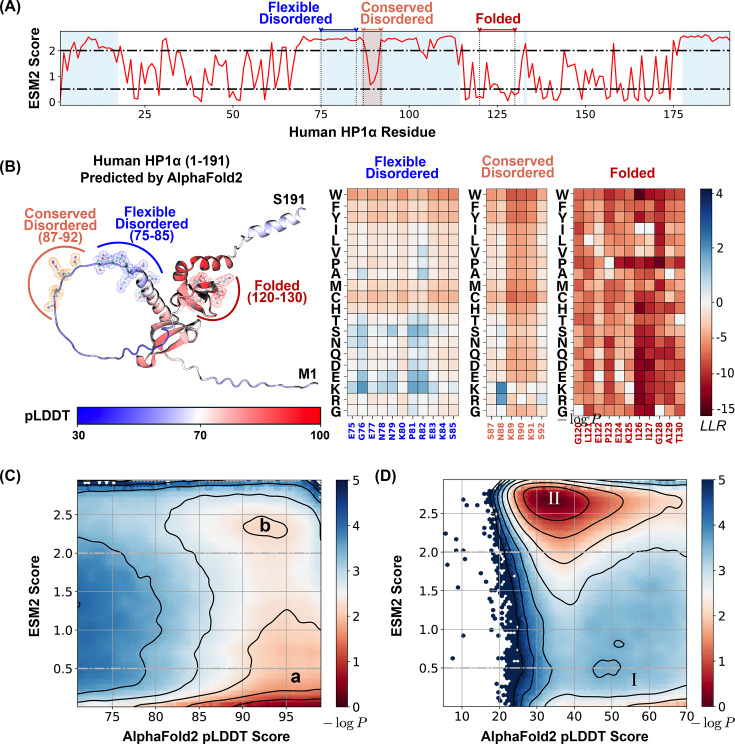
Figure 2. ESM2 predicts mutational landscape for structured and disordered residues. (A) The ESM2 scores for amino acids in the human HP1α protein (UniProt ID: P45973) are presented, with residues having predicted Local Distance Difference Test (pLDDT) scores below 70 highlighted in blue to signify regions lacking a defined structure. (B) A detailed view of the mutational landscape across three regions with varying degrees of structural order. On the left, the AlphaFold2-predicted structure of the human HP1α protein is displayed in cartoon representation, with residues colored according to their pLDDT scores. Three specific regions, representing flexible disordered (residues 75–85), conserved disordered (residues 87–92), and folded (residues 120–130) segments, are highlighted in blue, orange, and red, respectively, using ball-and-stick styles. The panels on the right depict the ESM2 log-likelihood ratio (LLR) predictions for each of these regions. Histograms of pLDDT and ESM2 score distributions for structured (C) and disordered (D) residues are presented. Contour lines indicate free energy levels computed as −log⁡P(pLDDT,ESM2), where P is the probability density of residues based on their pLDDT and ESM2 scores. Contours are spaced at 0.5-unit intervals to distinguish areas of differing density.
Figure 2. ESM2 predicts mutational landscape for structured and disordered residues. (A) The ESM2 scores for amino acids in the human HP1α protein (UniProt ID: P45973) are presented, with residues having predicted Local Distance Difference Test (pLDDT) scores below 70 highlighted in blue to signify regions lacking a defined structure. (B) A detailed view of the mutational landscape across three regions with varying degrees of structural order. On the left, the AlphaFold2-predicted structure of the human HP1α protein is displayed in cartoon representation, with residues colored according to their pLDDT scores. Three specific regions, representing flexible disordered (residues 75–85), conserved disordered (residues 87–92), and folded (residues 120–130) segments, are highlighted in blue, orange, and red, respectively, using ball-and-stick styles. The panels on the right depict the ESM2 log-likelihood ratio (LLR) predictions for each of these regions. Histograms of pLDDT and ESM2 score distributions for structured (C) and disordered (D) residues are presented. Contour lines indicate free energy levels computed as −log⁡P(pLDDT,ESM2), where P is the probability density of residues based on their pLDDT and ESM2 scores. Contours are spaced at 0.5-unit intervals to distinguish areas of differing density.CC BY · PubMed Central
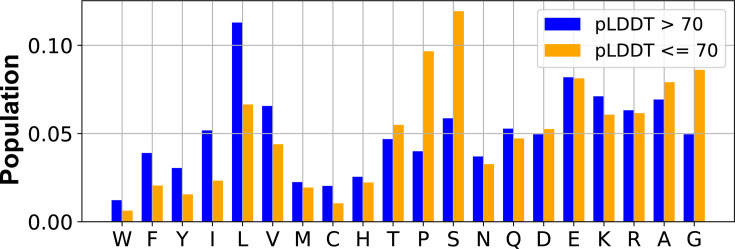
Figure 2—figure supplement 1. Fraction of different amino acids in structured and disordered residues identified from proteins in the MLO-hProt dataset (939). The structured (predicted Local Distance Difference Test [pLDDT] >70) and the disordered (pLDDT ≤70) residues were identified using the AlphaFold2 pLDDT score.
Figure 2—figure supplement 1. Fraction of different amino acids in structured and disordered residues identified from proteins in the MLO-hProt dataset (939). The structured (predicted Local Distance Difference Test [pLDDT] >70) and the disordered (pLDDT ≤70) residues were identified using the AlphaFold2 pLDDT score.CC BY · PubMed Central
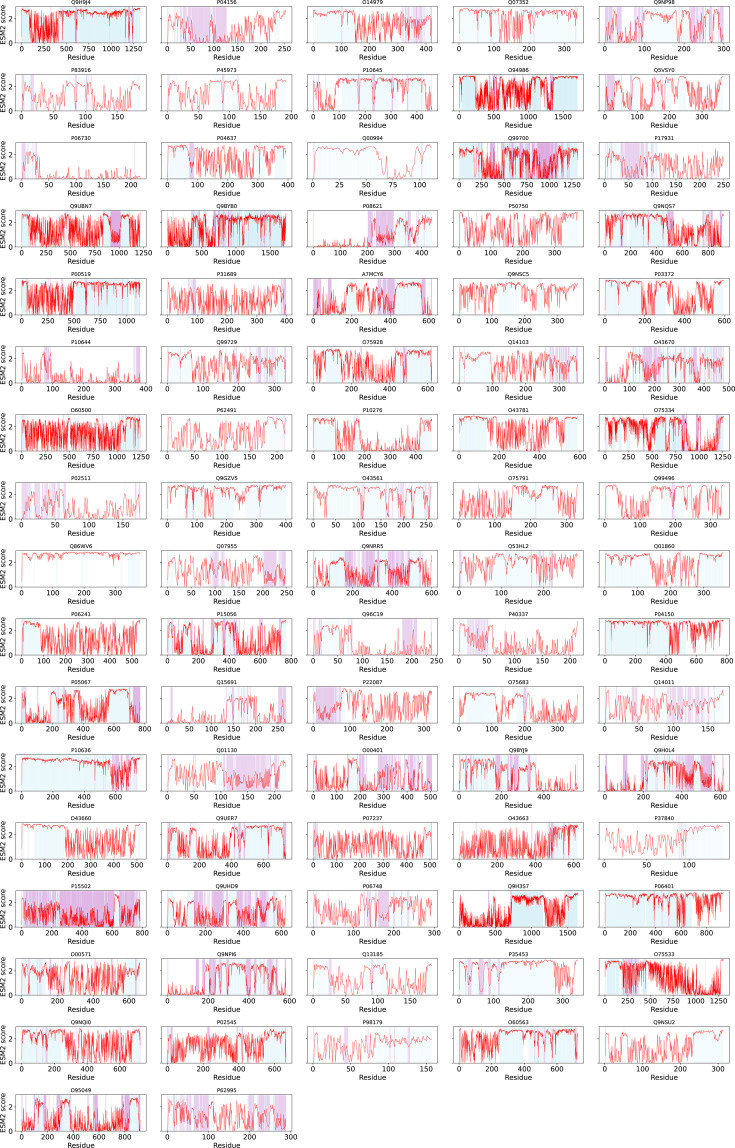
Figure 2—figure supplement 2. ESM2 and AlphaFold2 predictions for all proteins in the dMLO-hProt dataset. ESM2 scores for all amino acids in the dMLO-hProt proteins (full-length) are shown, with UniProt IDs indicated above each plot. Residues with predicted Local Distance Difference Test (pLDDT) ≤70 are blue (disordered). Of these residues, those with ESM2 scores ≤1.5 are colored plum (conserved disordered segments).
Figure 2—figure supplement 2. ESM2 and AlphaFold2 predictions for all proteins in the dMLO-hProt dataset. ESM2 scores for all amino acids in the dMLO-hProt proteins (full-length) are shown, with UniProt IDs indicated above each plot. Residues with predicted Local Distance Difference Test (pLDDT) ≤70 are blue (disordered). Of these residues, those with ESM2 scores ≤1.5 are colored plum (conserved disordered segments).CC BY · PubMed Central
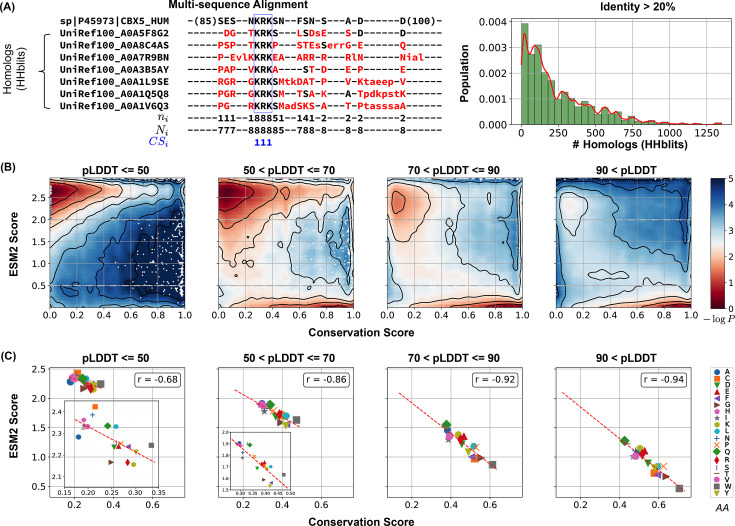
Figure 3. Low ESM2 scores correlate strongly with evolutionary conservation. (A) Estimating amino acid conservation using multiple sequence alignment. The conservation score calculation is demonstrated for human HP1α protein along with a subset of its homologs found by HHblits. In the aligned sequences, missing residues appear as dashed lines, insertions are shown in lowercase letters, and mismatches are highlighted in red. The three rows below the alignment indicate at position i, the number of conserved residues from the reference sequence to the query sequences; Ni; the total number of existing residues; and CSi, the conservation score calculated from Equation 2, respectively. The right panel illustrates the distribution of homolog counts for each MLO-hProt found by HHblits. (B) Histograms showing conservation and ESM2 score distributions for all residues in MLO-hProt, grouped by predicted Local Distance Difference Test (pLDDT) scores from AlphaFold2. The contour lines denote free energy levels, calculated as −log⁡P(CS,ESM2), where P is the probability density of residues based on their conservation and ESM2 scores. Contours are spaced at 0.5-unit intervals to highlight regions of distinct density. (C) Correlation between mean conservation and ESM2 scores for amino acids classified by structural order levels. Pearson correlation coefficients, r, are reported in the legends.
Figure 3. Low ESM2 scores correlate strongly with evolutionary conservation. (A) Estimating amino acid conservation using multiple sequence alignment. The conservation score calculation is demonstrated for human HP1α protein along with a subset of its homologs found by HHblits. In the aligned sequences, missing residues appear as dashed lines, insertions are shown in lowercase letters, and mismatches are highlighted in red. The three rows below the alignment indicate at position i, the number of conserved residues from the reference sequence to the query sequences; Ni; the total number of existing residues; and CSi, the conservation score calculated from Equation 2, respectively. The right panel illustrates the distribution of homolog counts for each MLO-hProt found by HHblits. (B) Histograms showing conservation and ESM2 score distributions for all residues in MLO-hProt, grouped by predicted Local Distance Difference Test (pLDDT) scores from AlphaFold2. The contour lines denote free energy levels, calculated as −log⁡P(CS,ESM2), where P is the probability density of residues based on their conservation and ESM2 scores. Contours are spaced at 0.5-unit intervals to highlight regions of distinct density. (C) Correlation between mean conservation and ESM2 scores for amino acids classified by structural order levels. Pearson correlation coefficients, r, are reported in the legends.CC BY · PubMed Central
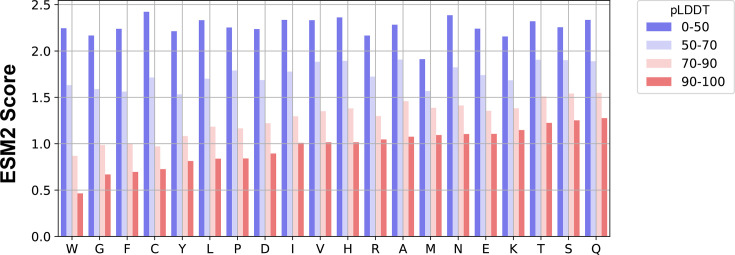
Figure 3—figure supplement 1. Average ESM2 score for amino acids with different structural order, averaged over residues from proteins in the MLO-hProt dataset (939).
Figure 3—figure supplement 1. Average ESM2 score for amino acids with different structural order, averaged over residues from proteins in the MLO-hProt dataset (939).CC BY · PubMed Central
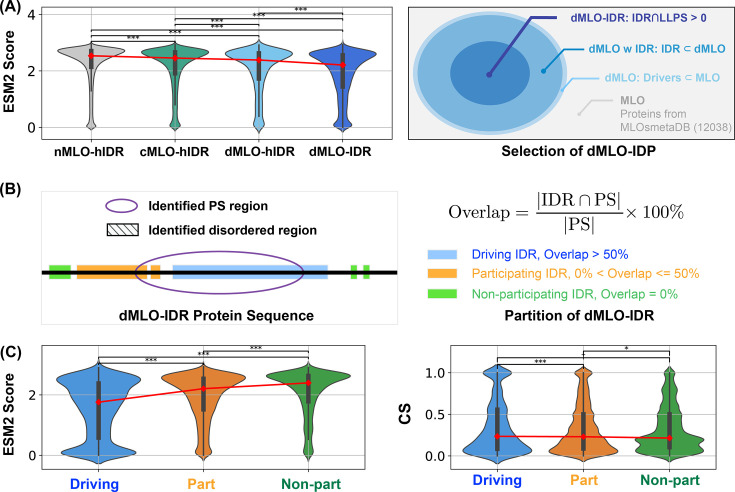
Figure 4. Phase separation driving intrinsically disordered regions (IDRs) exhibits more conserved disorder. (A) Population of ESM2 score for disordered residues in proteins from nMLO-hIDR, cMLO-hIDR, dMLO-hIDR, and dMLO-IDR datasets. Red dots indicate the mean values of the respective distributions. The selection of proteins in the dMLO-IDR dataset is shown in the right panel. See also methods for details in dataset preparation. (B) The classification of three IDR functional groups based on their overlap with the experimentally identified phase separation (PS) segments. (C) The distribution of the ESM2 score for residues in three IDR groups, driving (blue), participating (orange), and non-participating (green) shown in the violin plot. The distribution of the conservation score (CS) for residues in three IDR groups shown in the violin plot in the left panel with same coloring scheme as in the right. Pairwise statistical comparisons were conducted using two-sided Mann–Whitney U tests on the ESM2 score distributions (null hypothesis: the two groups have equal medians). p-values indicate the probability of observing the observed rank differences under the null hypothesis. Statistical significance is denoted as follows: ***p < 0.001; **p < 0.01; *p < 0.05; †p < 0.10 (marginal); n.s.: not significant, p ≥ 0.10.
Figure 4. Phase separation driving intrinsically disordered regions (IDRs) exhibits more conserved disorder. (A) Population of ESM2 score for disordered residues in proteins from nMLO-hIDR, cMLO-hIDR, dMLO-hIDR, and dMLO-IDR datasets. Red dots indicate the mean values of the respective distributions. The selection of proteins in the dMLO-IDR dataset is shown in the right panel. See also methods for details in dataset preparation. (B) The classification of three IDR functional groups based on their overlap with the experimentally identified phase separation (PS) segments. (C) The distribution of the ESM2 score for residues in three IDR groups, driving (blue), participating (orange), and non-participating (green) shown in the violin plot. The distribution of the conservation score (CS) for residues in three IDR groups shown in the violin plot in the left panel with same coloring scheme as in the right. Pairwise statistical comparisons were conducted using two-sided Mann–Whitney U tests on the ESM2 score distributions (null hypothesis: the two groups have equal medians). p-values indicate the probability of observing the observed rank differences under the null hypothesis. Statistical significance is denoted as follows: ***p < 0.001; **p < 0.01; *p < 0.05; †p < 0.10 (marginal); n.s.: not significant, p ≥ 0.10.CC BY · PubMed Central
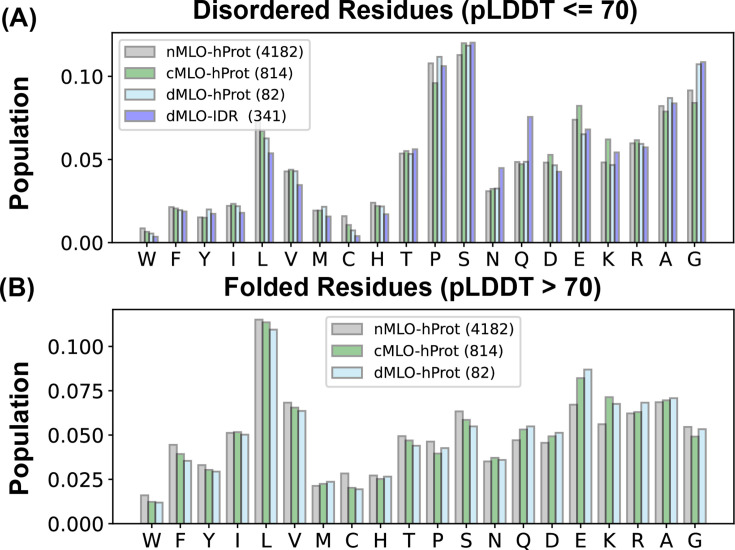
Figure 4—figure supplement 1. Fraction of different amino acids across proteins from various datasets. Panels (A, B) show amino acid composition of disordered and folded residues, respectively. For nMLO-/cMLO-/dMLO-hProt sets, order uses AlphaFold2-predicted Local Distance Difference Test (pLDDT); for dMLO-IDR, disorder is from MLOsmetaDB (Orti et al., 2024).
Figure 4—figure supplement 1. Fraction of different amino acids across proteins from various datasets. Panels (A, B) show amino acid composition of disordered and folded residues, respectively. For nMLO-/cMLO-/dMLO-hProt sets, order uses AlphaFold2-predicted Local Distance Difference Test (pLDDT); for dMLO-IDR, disorder is from MLOsmetaDB (Orti et al., 2024).CC BY · PubMed Central
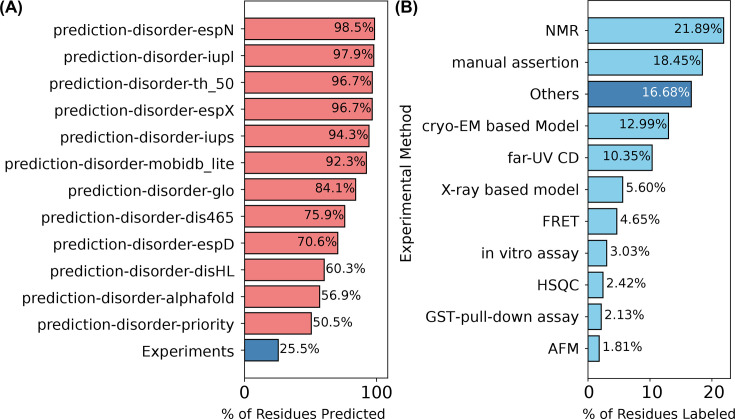
Figure 4—figure supplement 2. Disorder annotation of dMLO-IDR proteins in the MobiDB database (Di Domenico et al., 2012). (A) Computational predictors (fraction disordered). (B) Experimental techniques (fraction disordered).
Figure 4—figure supplement 2. Disorder annotation of dMLO-IDR proteins in the MobiDB database (Di Domenico et al., 2012). (A) Computational predictors (fraction disordered). (B) Experimental techniques (fraction disordered).CC BY · PubMed Central
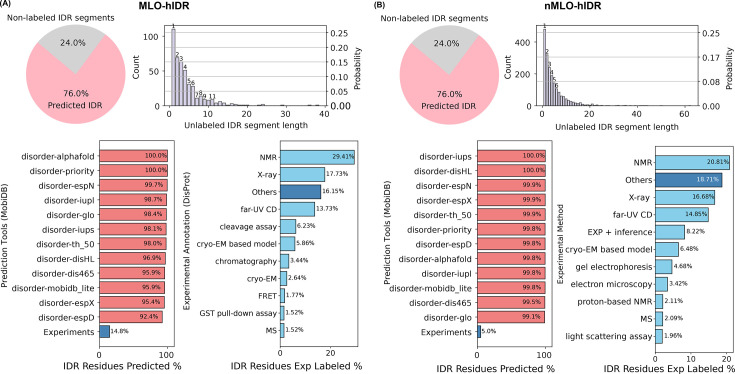
Figure 4—figure supplement 3. Disorder annotation of human proteins in MobiDB (Di Domenico et al., 2012). (A) Top-left: pie chart of fraction annotated as disordered versus not for MLO-hIDR; top-right: histogram of lengths of the 24% lacking annotations; bottom: distributions analogous to Figure 4—figure supplement 2. (B) Same analyses for nMLO-hIDR.
Figure 4—figure supplement 3. Disorder annotation of human proteins in MobiDB (Di Domenico et al., 2012). (A) Top-left: pie chart of fraction annotated as disordered versus not for MLO-hIDR; top-right: histogram of lengths of the 24% lacking annotations; bottom: distributions analogous to Figure 4—figure supplement 2. (B) Same analyses for nMLO-hIDR.CC BY · PubMed Central
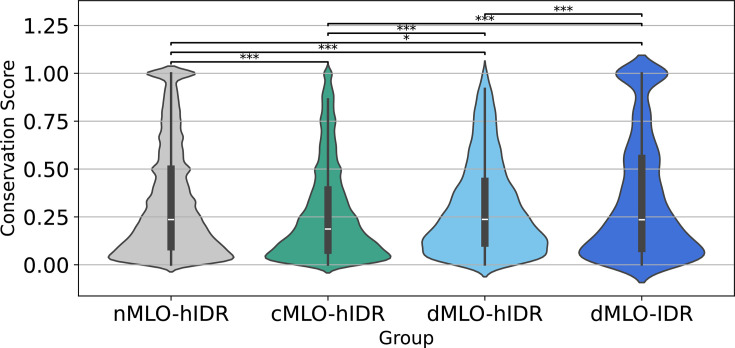
Figure 4—figure supplement 4. Violin plots of conservation scores for disordered residues across nMLO-hIDR, cMLO-hIDR, dMLO-hIDR, and dMLO-IDR. Two-sided Mann–Whitney U tests; significance: ***p < 0.001; **p < 0.01; *p < 0.05.
Figure 4—figure supplement 4. Violin plots of conservation scores for disordered residues across nMLO-hIDR, cMLO-hIDR, dMLO-hIDR, and dMLO-IDR. Two-sided Mann–Whitney U tests; significance: ***p < 0.001; **p < 0.01; *p < 0.05.CC BY · PubMed Central
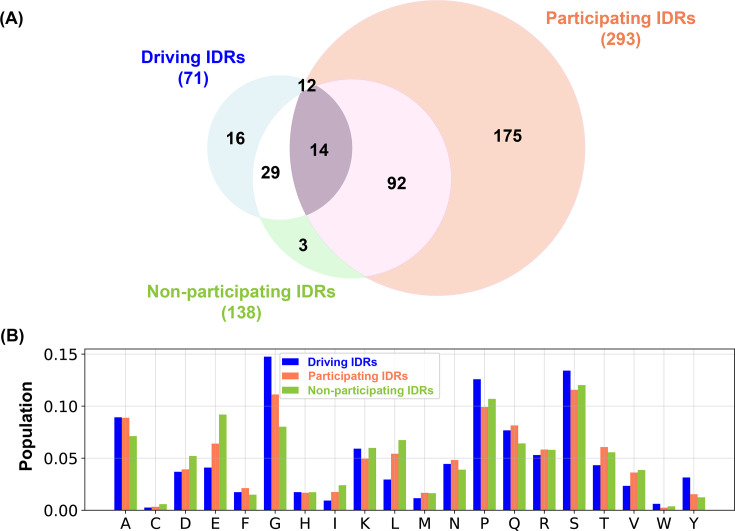
Figure 4—figure supplement 5. Statistics of three intrinsically disordered region (IDR) subgroups in dMLO-IDR. (A) Counts (and circle areas) per subgroup; overlaps arise when subgroups share proteins. (B) Amino acid proportions across IDRs per subgroup.
Figure 4—figure supplement 5. Statistics of three intrinsically disordered region (IDR) subgroups in dMLO-IDR. (A) Counts (and circle areas) per subgroup; overlaps arise when subgroups share proteins. (B) Amino acid proportions across IDRs per subgroup.CC BY · PubMed Central
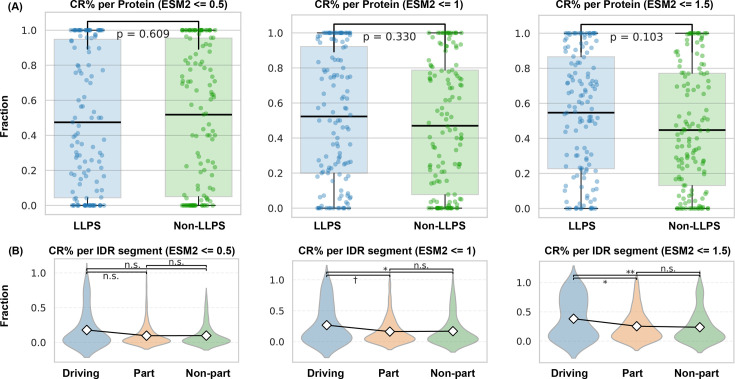
Figure 4—figure supplement 6. Statistics of conserved amino acids in regions with varying contributions to phase separation. (A) Fraction of conserved residues per region relative to total conserved per protein; ‘LLPS’ = driving/participating (Figure 4B), ‘non-LLPS’ = not involved. (B) Per-region probability of conservation (conserved count/segment length). Means shown with diamonds. Thresholds: ESM2 ≤0.5, ≤1.0, ≤1.5. Two-sided Mann–Whitney U tests; significance: ***p < 0.001; **p < 0.01; *p < 0.05; †p < 0.10 (marginal); n.s.: not significant, p ≥ 0.10.
Figure 4—figure supplement 6. Statistics of conserved amino acids in regions with varying contributions to phase separation. (A) Fraction of conserved residues per region relative to total conserved per protein; ‘LLPS’ = driving/participating (Figure 4B), ‘non-LLPS’ = not involved. (B) Per-region probability of conservation (conserved count/segment length). Means shown with diamonds. Thresholds: ESM2 ≤0.5, ≤1.0, ≤1.5. Two-sided Mann–Whitney U tests; significance: ***p < 0.001; **p < 0.01; *p < 0.05; †p < 0.10 (marginal); n.s.: not significant, p ≥ 0.10.CC BY · PubMed Central
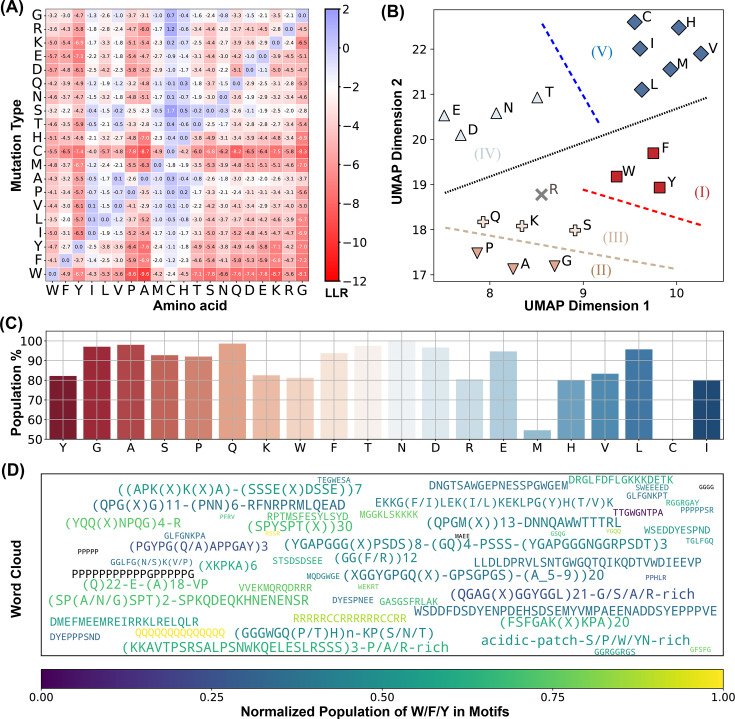
Figure 5. ESM2 identifies conserved motifs in driving intrinsically disordered regions (IDRs). (A) Mean log-likelihood ratio (LLR) values for the 20 amino acids calculated by averaging across all residues of each amino acid type. (B) Clustering of amino acids based on the two UMAP embeddings of their LLR vectors presented in part A. The dashed lines are manually added for a clear visualization of the separation of each group. (C) The percent of conserved residues locating in motifs for all amino acids. (D) Word cloud of motifs identified by ESM2. The word font size reflects the relative motif length, while the color represents the proportion of ‘sticker’ residues (Y, F, W, R, K, and Q) within each motif.
Figure 5. ESM2 identifies conserved motifs in driving intrinsically disordered regions (IDRs). (A) Mean log-likelihood ratio (LLR) values for the 20 amino acids calculated by averaging across all residues of each amino acid type. (B) Clustering of amino acids based on the two UMAP embeddings of their LLR vectors presented in part A. The dashed lines are manually added for a clear visualization of the separation of each group. (C) The percent of conserved residues locating in motifs for all amino acids. (D) Word cloud of motifs identified by ESM2. The word font size reflects the relative motif length, while the color represents the proportion of ‘sticker’ residues (Y, F, W, R, K, and Q) within each motif.CC BY · PubMed Central
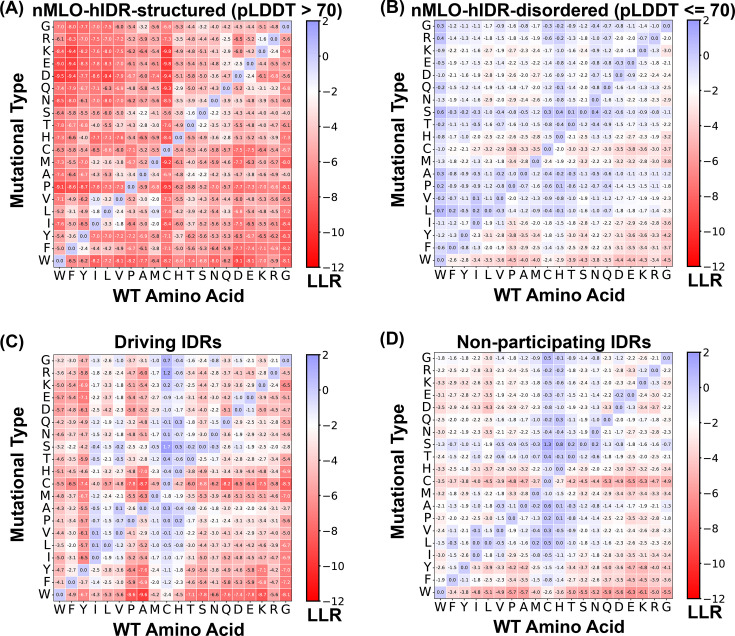
Figure 5—figure supplement 1. Mean log-likelihood ratio (LLR) values across 20 amino acids. (A) Structured residues from nMLO-hIDR (predicted Local Distance Difference Test [pLDDT] >70), (B) disordered residues from nMLO-hIDR (pLDDT ≤70), (C) driving intrinsically disordered regions (IDRs) from dMLO-IDR, and (D) non-participating IDRs from dMLO-IDR.
Figure 5—figure supplement 1. Mean log-likelihood ratio (LLR) values across 20 amino acids. (A) Structured residues from nMLO-hIDR (predicted Local Distance Difference Test [pLDDT] >70), (B) disordered residues from nMLO-hIDR (pLDDT ≤70), (C) driving intrinsically disordered regions (IDRs) from dMLO-IDR, and (D) non-participating IDRs from dMLO-IDR.CC BY · PubMed Central
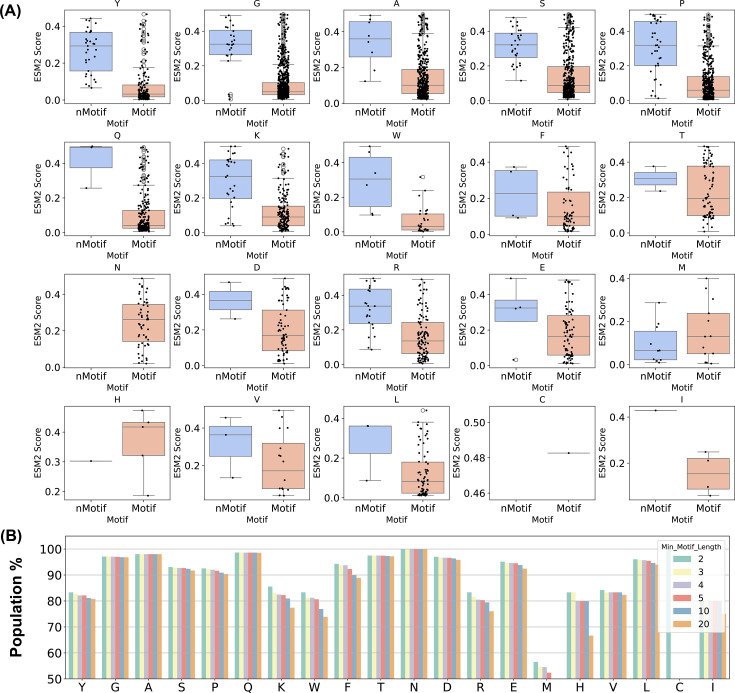
Figure 5—figure supplement 2. Distribution of conserved residues in motifs for driving intrinsically disordered regions (IDRs). (A) Box plot comparing conserved amino acids in non-motifs versus motifs with scatter overlay. (B) Proportion conserved within motifs across minimum motif length thresholds.
Figure 5—figure supplement 2. Distribution of conserved residues in motifs for driving intrinsically disordered regions (IDRs). (A) Box plot comparing conserved amino acids in non-motifs versus motifs with scatter overlay. (B) Proportion conserved within motifs across minimum motif length thresholds.CC BY · PubMed Central
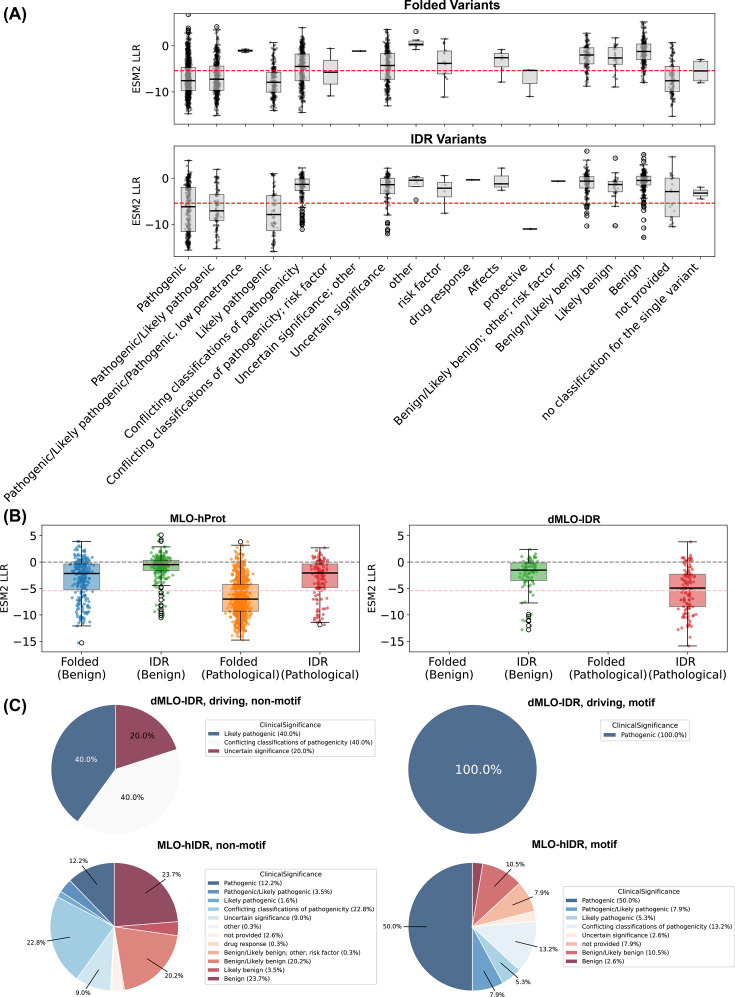
Figure 5—figure supplement 3. ESM2 predictions as indicators of pathogenic mutations. ClinVar (March 2024). (A) Log-likelihood ratio (LLR) distributions for mutations in folded versus disordered residues by ClinVar categories (Landrum et al., 2014; Landrum et al., 2018); red dashed line: LLR = −5.4 (ESM2 score 0.5 if uniform). (B) LLR distributions across membraneless organelle (MLO) databases (pathogenic vs. benign as defined). (C) ClinVar category pies for variants in motif versus non-motif regions of dMLO-IDR and MLO-hProt.
Figure 5—figure supplement 3. ESM2 predictions as indicators of pathogenic mutations. ClinVar (March 2024). (A) Log-likelihood ratio (LLR) distributions for mutations in folded versus disordered residues by ClinVar categories (Landrum et al., 2014; Landrum et al., 2018); red dashed line: LLR = −5.4 (ESM2 score 0.5 if uniform). (B) LLR distributions across membraneless organelle (MLO) databases (pathogenic vs. benign as defined). (C) ClinVar category pies for variants in motif versus non-motif regions of dMLO-IDR and MLO-hProt.CC BY · PubMed Central
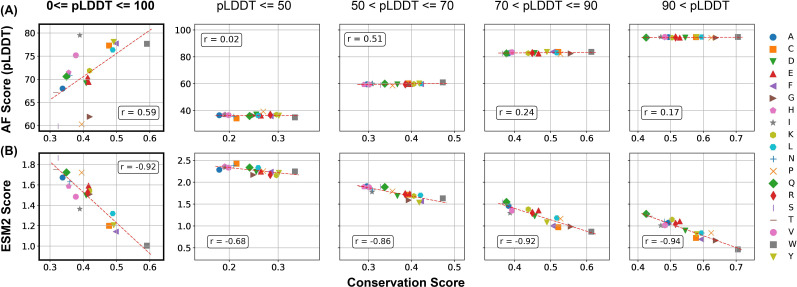
Author response image 1. Comparison of the correlation between AlphaFold2 pLDDT scores and conservation scores with the correlation between ESM2 scores and conservation scores. Calculations were performed using proteins in the MLO-hProt dataset. (A) Correlation between the mean AlphaFold2 pLDDT scores and conservation scores for various amino acids. Pearson correlation coefficients (r) are indicated in the figure legends. The four panels on the right present analogous correlation plots for amino acids grouped by structural order, as defined by their pLDDT scores. (B) Similar as in part A but for ESM2 scores.
Author response image 1. Comparison of the correlation between AlphaFold2 pLDDT scores and conservation scores with the correlation between ESM2 scores and conservation scores. Calculations were performed using proteins in the MLO-hProt dataset. (A) Correlation between the mean AlphaFold2 pLDDT scores and conservation scores for various amino acids. Pearson correlation coefficients (r) are indicated in the figure legends. The four panels on the right present analogous correlation plots for amino acids grouped by structural order, as defined by their pLDDT scores. (B) Similar as in part A but for ESM2 scores.CC BY · PubMed Central
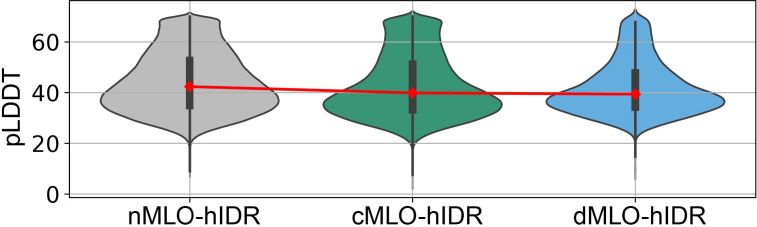
Author response image 2. AlphaFold pLDDT scores of hIDRs in different MLO-related groups.
Author response image 2. AlphaFold pLDDT scores of hIDRs in different MLO-related groups.CC BY · PubMed Central
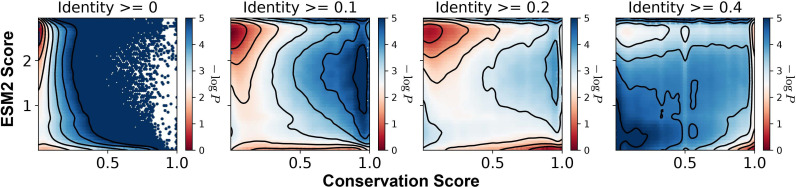
Author response image 3. Histograms of the ESM2 score and the conservation score, presented in a format consistent with Figure 3B of the main text. The conservation scores were computed using aligned sequences with identity thresholds of ≥0, ≥10%, ≥20%, and ≥40% (left to right). Contour lines represent different levels of −log_P_(CS,ESM2), where P is the joint probability density of conservation score (CS) and ESM2 score. Contours are spaced at 0.5-unit intervals, highlighting regions of distinct density.
Author response image 3. Histograms of the ESM2 score and the conservation score, presented in a format consistent with Figure 3B of the main text. The conservation scores were computed using aligned sequences with identity thresholds of ≥0, ≥10%, ≥20%, and ≥40% (left to right). Contour lines represent different levels of −log_P_(CS,ESM2), where P is the joint probability density of conservation score (CS) and ESM2 score. Contours are spaced at 0.5-unit intervals, highlighting regions of distinct density.CC BY · PubMed Central
Author response image 4. Number of peripheral residues and their relative length to the full-motif length identified from both sides. (A). The unique motifs identified from N-to-C terminal direction. (B) The unique motifs identified from C-to-N terminal direction.
Author response image 4. Number of peripheral residues and their relative length to the full-motif length identified from both sides. (A). The unique motifs identified from N-to-C terminal direction. (B) The unique motifs identified from C-to-N terminal direction.CC BY · PubMed Central
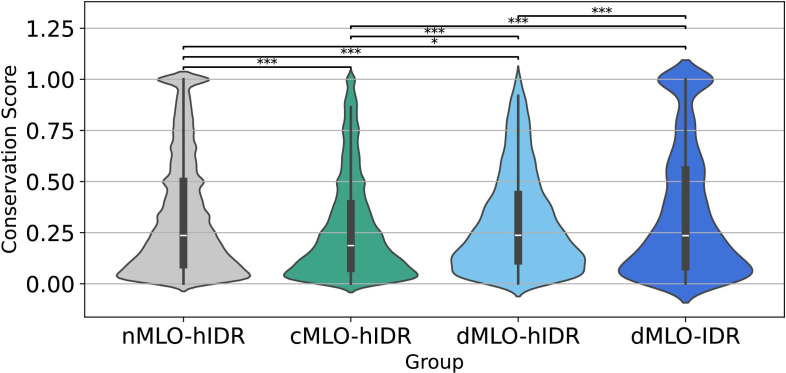
Author response image 5. Violin plots illustrating the distribution of conservation scores for disordered residues across the nMLO–hIDR, cMLO–hIDR, dMLO–hIDR, and dMLO–IDR datasets. Pairwise statistical comparisons were conducted using two-sided Mann–Whitney U tests on the conservation score distributions (null hypothesis: the two groups have equal medians). P-values indicate the probability of observing the observed rank differences under the null hypothesis. Statistical significance is denoted as follows: ***: p < 0.001; **: p < 0.01; *:p < 0.05;
Author response image 5. Violin plots illustrating the distribution of conservation scores for disordered residues across the nMLO–hIDR, cMLO–hIDR, dMLO–hIDR, and dMLO–IDR datasets. Pairwise statistical comparisons were conducted using two-sided Mann–Whitney U tests on the conservation score distributions (null hypothesis: the two groups have equal medians). P-values indicate the probability of observing the observed rank differences under the null hypothesis. Statistical significance is denoted as follows: ***: p < 0.001; **: p < 0.01; *:p < 0.05;CC BY · PubMed Central
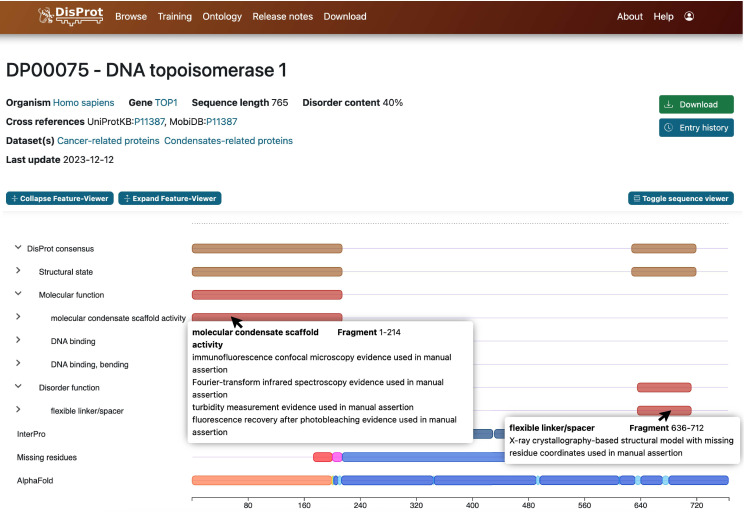
Author response image 6. Screenshot of information provided by the DisProt database. Detailed annotations of biological functions and structural features, along with experimental references, are accessible via mouse click.
Author response image 6. Screenshot of information provided by the DisProt database. Detailed annotations of biological functions and structural features, along with experimental references, are accessible via mouse click.CC BY · PubMed Central
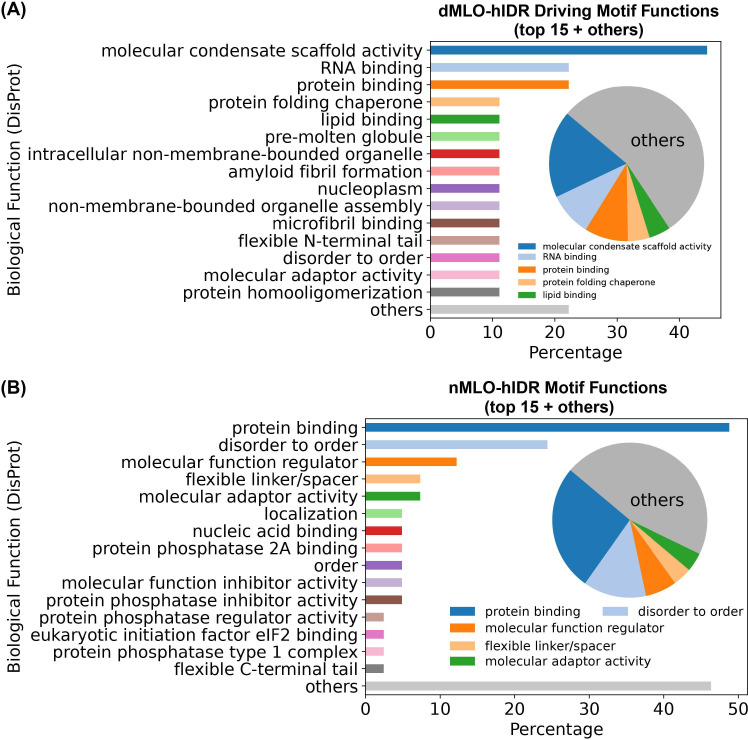
Author response image 7. Biological functions of ESM2-predicted motifs. (A) Distribution of biological functions associated with all identified motifs from dMLO-IDR driving groups. (B) Distribution of biological functions associated with all identified motifs from nMLO-hIDR groups.
Author response image 7. Biological functions of ESM2-predicted motifs. (A) Distribution of biological functions associated with all identified motifs from dMLO-IDR driving groups. (B) Distribution of biological functions associated with all identified motifs from nMLO-hIDR groups.CC BY · PubMed Central

Verification

Claims the paper makes

The claims and statistics of this paper haven’t been checked yet.

Run the check — free, no account needed. It reads the open-access text and checks the sources it cites.

A few free checks a day · papers already verified open instantly · results are public

Self-check

Percentages, sums and reported differences re-computed from the paper’s own numbers.

The self-check needs the paper’s full text.

Citations

Cites

  • Attention Is All You Need

    Vaswani, A., Shazeer, N., Parmar, N., Uszkoreit, J., Jones, L., Gomez, A. N., Kaiser, L., & Polosukhin, I. (2017) · arXiv · doi:10.48550/arxiv.1706.03762 · Cited by 120,404 · cited 1×

    “Trained on large protein datasets, such as UniProt ( Boutet et al., 2016 ), these models leverage neural network architectures like the Trans-former ( Vaswani et al., 2017 ) to capture correlations among amino acids within a sequence.”
  • Highly accurate protein structure prediction with AlphaFold

    Jumper, J., Evans, R., Pritzel, A., Green, T., Figurnov, M., Ronneberger, O., Tunyasuvunakool, K., Bates, R., Žídek, A., Potapenko, A., et al. (2021) · Nature · doi:10.1038/s41586-021-03819-2 · Cited by 43,764 · cited 1×

    “The pLDDT scores have been shown to correlate well with protein flexibility and disorder ( Jumper et al., 2021 ), making them a reliable tool for distinguishing structured from unstructured regions.”
  • Biomolecular condensates: organizers of cellular biochemistry

    Banani, S. F., Lee, H. O., Hyman, A. A., & Rosen, M. K. (2017) · Nature Reviews Molecular Cell Biology · doi:10.1038/nrm.2017.7 · Cited by 6,058 · cited 1×

    “…environments and play a vital role in forming specialized biochemical compartments that drive essential cellular functions ( Hirose et al., 2023 ; Banani et al., 2017 ; Choi et al., 2020 ; Pappu et al., 2023 ; Ginell and Holehouse, 2023 ; Latham and Zhang, 2020 ; Latham and Zhang, 2022a ; Latham…”
  • Evolutionary-scale prediction of atomic level protein structure with a language model

    Lin, Z., Akin, H., Rao, R., Hie, B., Zhu, Z., Lu, W., Smetanin, N., Verkuil, R., Kabeli, O., Shmueli, Y., et al. (2022) · doi:10.1101/2022.07.20.500902 · Cited by 5,990 · cited 2×

    “ESM2 enables the quantification of the probability, or likelihood, of observing any of the 20 amino acids at site i .”
  • ClinVar: improving access to variant interpretations and supporting evidence

    Landrum, M. J., Lee, J. M., Benson, M., Brown, G. R., Chao, C., Chitipiralla, S., Gu, B., Hart, J., Hoffman, D., Jang, W., et al. (2018) · Nucleic Acids Research · doi:10.1093/nar/gkx1153 · Cited by 4,196 · cited 1×

    “To explore potential clinical implications, we analyzed pathogenicity data from ClinVar ( Landrum et al., 2014 ; Landrum et al., 2018 ; Cagiada et al., 2024 ; Luppino et al., 2025 ; Fawzy and Marsh, 2025 ).”
  • Thermodynamics of High Polymer Solutions

    Flory, P., & Krigbaum, W. R. (1941) · The Journal of Chemical Physics · doi:10.1063/1.1723621 · Cited by 4,126 · cited 1×

    “…( Brangwynne et al., 2015 ; Pappu et al., 2023 ; Zeng and Pappu, 2023 ; Schmit et al., 2020 ; Mittag and Pappu, 2022 ; Dzuricky et al., 2018 ; Flory, 1942 ; Huggins, 1942 ; Dignon et al., 2018 ; Dignon et al., 2019 ; Latham and Zhang, 2020 ; Joseph et al., 2021 ; Regy et al., 2021 ; Latham…”
  • ClinVar: public archive of relationships among sequence variation and human phenotype

    Landrum, M. J., Lee, J. M., Riley, G. R., Jang, W., Rubinstein, W. S., Church, D. M., & Maglott, D. R. (2014) · Nucleic Acids Research · doi:10.1093/nar/gkt1113 · Cited by 3,516 · cited 1×

    “To explore potential clinical implications, we analyzed pathogenicity data from ClinVar ( Landrum et al., 2014 ; Landrum et al., 2018 ; Cagiada et al., 2024 ; Luppino et al., 2025 ; Fawzy and Marsh, 2025 ).”
  • Biological structure and function emerge from scaling unsupervised learning to 250 million protein sequences

    Rives, A., Meier, J., Sercu, T., Goyal, S., Lin, Z., Liu, J., Guo, D., Ott, M., Zitnick, C. L., Ma, J., et al. (2019) · doi:10.1101/622803 · Cited by 3,280 · cited 1×

    “Recent advances in protein language models ( Ofer et al., 2021 ; Rives et al., 2021 ; Elnaggar et al., 2021 ; Strodthoff et al., 2020 ; Alley et al., 2019 ; Brandes et al., 2022 ) provide alternative approaches for sequence analysis and information decoding.”
  • Liquid-Liquid Phase Separation in Biology

    Hyman, A. A., Weber, C. A., & Jülicher, F. (2014) · Annual Review of Cell and Developmental Biology · doi:10.1146/annurev-cellbio-100913-013325 · Cited by 3,155 · cited 1×

    “…et al., 2023 ; Banani et al., 2017 ; Choi et al., 2020 ; Pappu et al., 2023 ; Ginell and Holehouse, 2023 ; Latham and Zhang, 2020 ; Latham and Zhang, 2022a ; Latham and Zhang, 2022c ; Latham and Zhang, 2022b ; Latham et al., 2024 ; Liu et al., 2025 ; Lao and Zhang, 2024 ; Jiang et al., 2015 ).”
  • HHblits: lightning-fast iterative protein sequence searching by HMM-HMM alignment

    Remmert, M., Biegert, A., Hauser, A., & Söding, J. (2012) · Nature Methods · doi:10.1038/nmeth.1818 · Cited by 2,288 · cited 1×

    “We performed MSA analysis using HHblits from the HH-suite3 software suite ( Suzek et al., 2007 ; Suzek et al., 2015 ; Remmert et al., 2012 ; Steinegger et al., 2019 ), a widely used open-source toolkit known for its sensitivity in detecting sequence similarities and identifying protein folds.”

Show all 149 references

Research works printed but not linked: 1

  1. Zhang Y. 2025. ESM2_IDR_LLPS. GitHub. swh:1:rev:318a81268901ea4e1349122f1ddb12ee8f5e15d0. https://archive.softwareheritage.org/swh:1:dir:f98ccbe03ad38d248f9d12d0b452c3fe2f054a54;origin=https://github.com/ZhangGroup-MITChemistry/ESM2_IDR_LLPS;visit=swh:1:snp:35bf3137f559f3a75ca839779dc10c553125d97b;anchor=swh:1:rev:318a81268901ea4e1349122f1ddb12ee8f5e15d0.

Cited by

Sorted by citations

Metadata

Authors
Zhang, Y., Zheng, J., & Zhang, B.
Affiliations
Massachusetts Institute of Technology (US)
Corresponding author
Zhang, Bin
Venue
eLife
Published
2025-10-20
Volume
14
ISSN
2050-084X (ISSN-L)
OpenAlex
W4410139515
Cited by
4
References
149
Citations by year
2026: 3 · 2025: 1
Type
posted content
Language
en
Open access
Locations
  • eLife (publishedVersion, cc-by)
  • Europe PMC (PubMed Central) (publishedVersion, cc-by)
  • PubMed (publishedVersion)
  • DOAJ (DOAJ: Directory of Open Access Journals) (submittedVersion, cc-by-sa)
Funders
National Institute of General Medical Sciences (R35GM133580)
Topics
  • Life Sciences › Biochemistry, Genetics and Molecular Biology › Molecular Biology › Protein Structure and Dynamics
  • Life Sciences › Biochemistry, Genetics and Molecular Biology › Molecular Biology › RNA Research and Splicing
  • Life Sciences › Biochemistry, Genetics and Molecular Biology › Molecular Biology › RNA and protein synthesis mechanisms
Keywords
intrinsically disordered regions, phase separation, biomolecular condensates, protein language models, ESM-2, mutational tolerance, evolutionary conservation, conserved motifs, multivalent interactions, protein sequence evolution
MeSH terms
Phase Separation, Amino Acid Sequence, Organelles, Conserved Sequence, Evolution, Molecular, Amino Acid Motifs, Intrinsically Disordered Proteins

About these checks

Registry, retraction, Cites and statistics results are computed, not judged, with one exception: a printed reference that no index lists is read once by a model before it counts as a citation error. Claims are extracted by a model and kept only when their quote appears verbatim in the text; each cited source is then checked, with a model’s help, for whether it says what the claim relies on. Those verdicts can be wrong — read the claim’s quote and the cited source before relying on one.

Statistics and arithmetic are recomputed, not judged.

Confidence bands are shown only for fields calibrated on our annotated test set. None is calibrated yet, so no band is shown.

What counts as a claim ›How we measure confidence ›How we check this ›

Are you an author, or do you see a problem with this page? Request a review