Student or educator? Sign up with your school email and get 6 months of Pro free.
Cited by 2Photoreceptor and optogenetics researchReceptor Mechanisms and SignalingPhotochromic and Fluorescence Chemistry

The DOI matches its Crossref record; 83 of the 83 references it cites were found in a registry or an index.

Coral anthozoan-specific opsins employ a novel chloride counterion for spectral tuning

Open access

Published version of a preprint

Abstract

Animal opsins are G protein-coupled receptors that have evolved to sense light by covalently binding a retinal chromophore via a protonated (positively charged) Schiff base. A negatively charged amino acid in the opsin, acting as a counterion, stabilizes the proton on the Schiff base, which is essential for sensitivity to visible light. In this study, we investigate the spectroscopic properties of a unique class of opsins from a reef-building coral belonging to the anthozoan-specific opsin II group (ASO-II opsins), which intriguingly lack a counterion residue at any of established sites. Our findings reveal that, unlike other known animal opsins, the protonated state of the Schiff base in visible light-sensitive ASO-II opsins is highly dependent on exogenously supplied chloride ions (Cl − ). By using structural modeling and quantum mechanics/molecular mechanics (QM/MM) calculations to interpret spectroscopy data, we conclude that, in the dark state, ASO-II opsins employ environmental Cl − as their native counterion, while a nearby polar residue, Glu292 in its protonated neutral form, facilitates Cl − binding. In contrast, Glu292 plays a crucial role in maintaining the protonation state of the Schiff base in the light-activated protein, serving as the counterion in the photoproduct. Furthermore, Glu292 is involved in G protein activation of the ASO-II opsin, suggesting that this novel counterion system coordinates multiple functional properties.

Overview

The claims and statistics of this paper haven’t been checked yet.

Run the check — free, no account needed. It reads the open-access text and checks the sources it cites.

A few free checks a day · papers already verified open instantly · results are public

Integrity signals

Registry

Crossref · 10.7554/elife.105451

Cites

83 of 83 references verified0 citation errors · 0 not checkable

Statistics

Figures

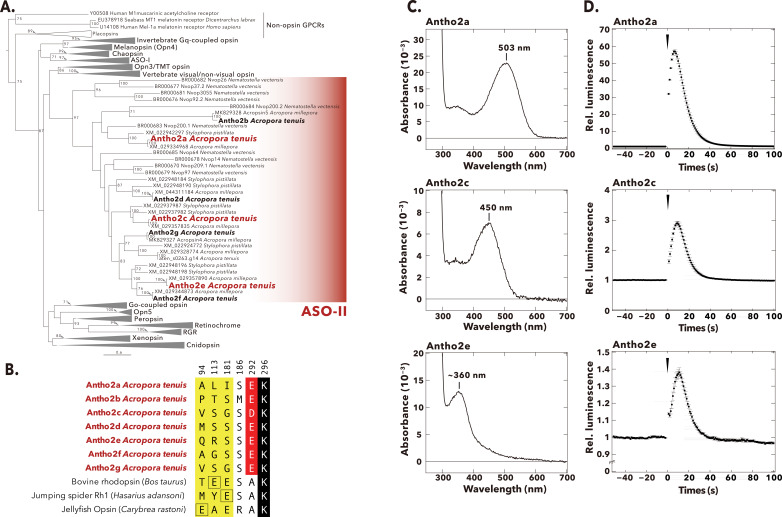
Figure 1. Phylogenetic tree, selected amino acid residues, absorption spectra, and light-induced Ca2+ responses of A. tenuis opsins belonging to the anthozoan-specific opsin II (ASO-II) group. (A) Maximum-likelihood (ML) tree of animal opsins including A. tenuis opsins in the ASO-II group. Seven opsins in the ASO-II group that were identified and cloned from A. tenuis in this study are shown in bold, and the three members for which we obtained absorption spectra are highlighted in red. Numbers at the nodes represent support values of each ML branch estimated by 1000 bootstrap samplings (≥70% are indicated). Scale bar = 0.6 substitutions per site. All branches and support values are provided in Figure 1—figure supplement 1. (B) Selected residues near the Schiff base in opsins of the ASO-II group and other animal opsins. Animal opsins typically have an acidic residue acting as counterion at one of three established sites (yellow): E94 (e.g. jellyfish opsin), E113 (e.g. bovine rhodopsin), or E181 (e.g. jumping spider Rh1). Remarkably, opsins in the ASO-II group lack an acidic residue at any of these positions but instead feature an acidic residue at position 292 (red). The retinal-binding lysine, Lys296, is shown in black. A more detailed sequence alignment is provided in Figure 1—figure supplement 2. Residues are numbered according to bovine rhodopsin. (C) Absorption spectra in the dark of three A. tenuis opsins in the ASO-II group (Antho2a, Antho2c, and Antho2e). The absorption spectra were measured at 0°C in 140 mM NaCl at pH 6.5. The number in each graph shows the λmax value. (D) Results of the aequorin-based bioluminescent reporter assay for monitoring light-induced changes in Ca2+ in HEK293S cells expressing the same three opsins in the ASO-II group as in panel C. In each graph, luminescence values were normalized to the baseline. Black circles with error bars indicate the means ± SEMs (n=3) of the measured relative luminescence. Black arrowheads at time 0 indicate the timing of 1 min irradiation with green (495 nm; for Antho2a and Antho2c) or ultraviolet (UV) (395 nm; for Antho2e) light.
Figure 1. Phylogenetic tree, selected amino acid residues, absorption spectra, and light-induced Ca2+ responses of A. tenuis opsins belonging to the anthozoan-specific opsin II (ASO-II) group. (A) Maximum-likelihood (ML) tree of animal opsins including A. tenuis opsins in the ASO-II group. Seven opsins in the ASO-II group that were identified and cloned from A. tenuis in this study are shown in bold, and the three members for which we obtained absorption spectra are highlighted in red. Numbers at the nodes represent support values of each ML branch estimated by 1000 bootstrap samplings (≥70% are indicated). Scale bar = 0.6 substitutions per site. All branches and support values are provided in Figure 1—figure supplement 1. (B) Selected residues near the Schiff base in opsins of the ASO-II group and other animal opsins. Animal opsins typically have an acidic residue acting as counterion at one of three established sites (yellow): E94 (e.g. jellyfish opsin), E113 (e.g. bovine rhodopsin), or E181 (e.g. jumping spider Rh1). Remarkably, opsins in the ASO-II group lack an acidic residue at any of these positions but instead feature an acidic residue at position 292 (red). The retinal-binding lysine, Lys296, is shown in black. A more detailed sequence alignment is provided in Figure 1—figure supplement 2. Residues are numbered according to bovine rhodopsin. (C) Absorption spectra in the dark of three A. tenuis opsins in the ASO-II group (Antho2a, Antho2c, and Antho2e). The absorption spectra were measured at 0°C in 140 mM NaCl at pH 6.5. The number in each graph shows the λmax value. (D) Results of the aequorin-based bioluminescent reporter assay for monitoring light-induced changes in Ca2+ in HEK293S cells expressing the same three opsins in the ASO-II group as in panel C. In each graph, luminescence values were normalized to the baseline. Black circles with error bars indicate the means ± SEMs (n=3) of the measured relative luminescence. Black arrowheads at time 0 indicate the timing of 1 min irradiation with green (495 nm; for Antho2a and Antho2c) or ultraviolet (UV) (395 nm; for Antho2e) light.CC BY · PubMed Central
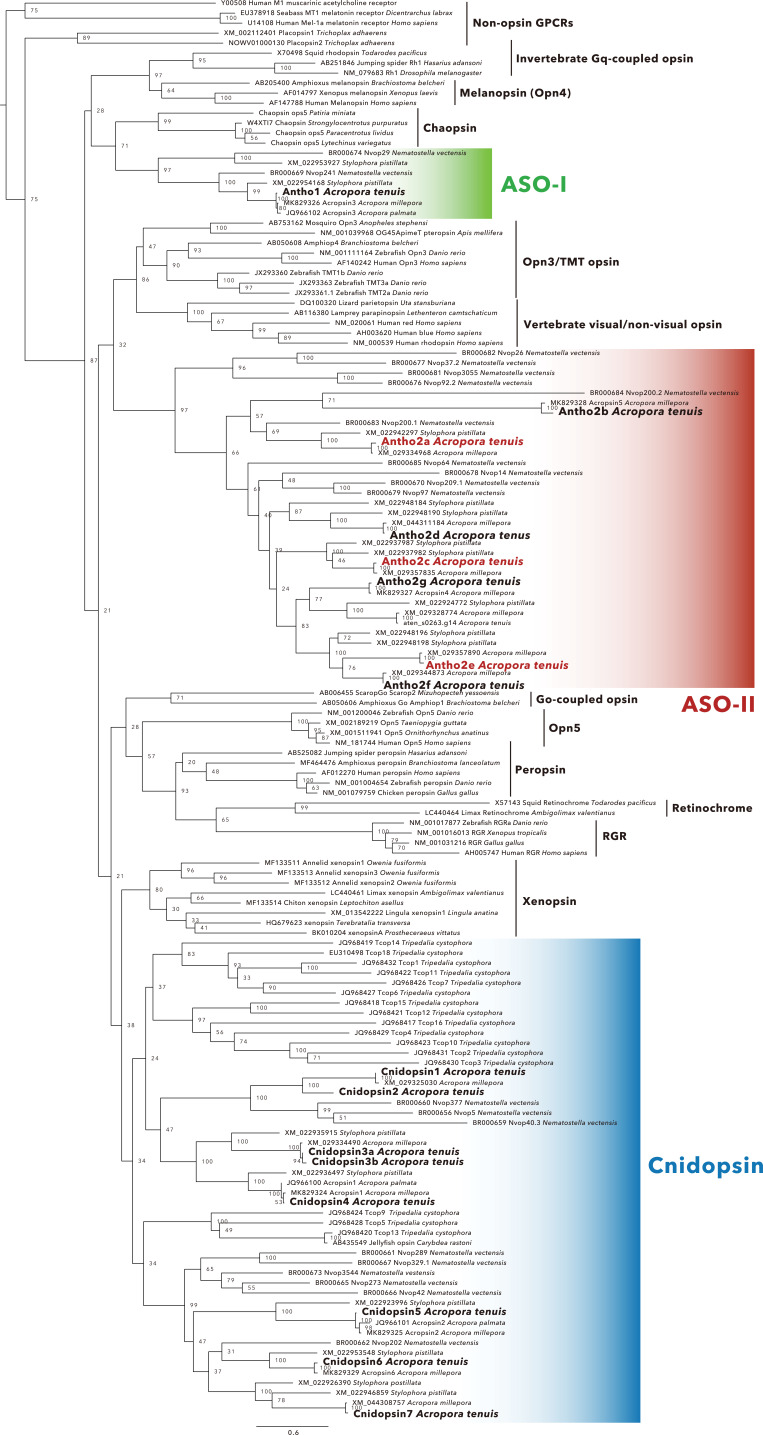
Figure 1—figure supplement 1. Maximum-likelihood (ML) tree of animal opsins, with non-opsin G protein-coupled receptors (GPCRs) included as an outgroup (a simplified version of the ML tree is shown in Figure 1A). The tree includes opsins belonging to the eight main groups (see main text) as well as opsins from the recently identified subgroups xenopsins and chaopsins (Ramirez MD et al. Genome Biol Evol 8:3640–3652, 2016). The sixteen A. tenuis opsins (eight opsins in the cnidopsin group, one opsin in the anthozoan-specific opsin I [ASO-I] group, and seven opsins in the ASO-II group) that were identified in this study are shown in bold. The three opsins in the ASO-II group for which absorption spectra were successfully obtained are highlighted in red. Numbers at nodes represent support values for the ML branch estimated by 1000 bootstrap samplings (≥70% are indicated). Scale bar = 0.6 substitutions per site.
Figure 1—figure supplement 1. Maximum-likelihood (ML) tree of animal opsins, with non-opsin G protein-coupled receptors (GPCRs) included as an outgroup (a simplified version of the ML tree is shown in Figure 1A). The tree includes opsins belonging to the eight main groups (see main text) as well as opsins from the recently identified subgroups xenopsins and chaopsins (Ramirez MD et al. Genome Biol Evol 8:3640–3652, 2016). The sixteen A. tenuis opsins (eight opsins in the cnidopsin group, one opsin in the anthozoan-specific opsin I [ASO-I] group, and seven opsins in the ASO-II group) that were identified in this study are shown in bold. The three opsins in the ASO-II group for which absorption spectra were successfully obtained are highlighted in red. Numbers at nodes represent support values for the ML branch estimated by 1000 bootstrap samplings (≥70% are indicated). Scale bar = 0.6 substitutions per site.CC BY · PubMed Central
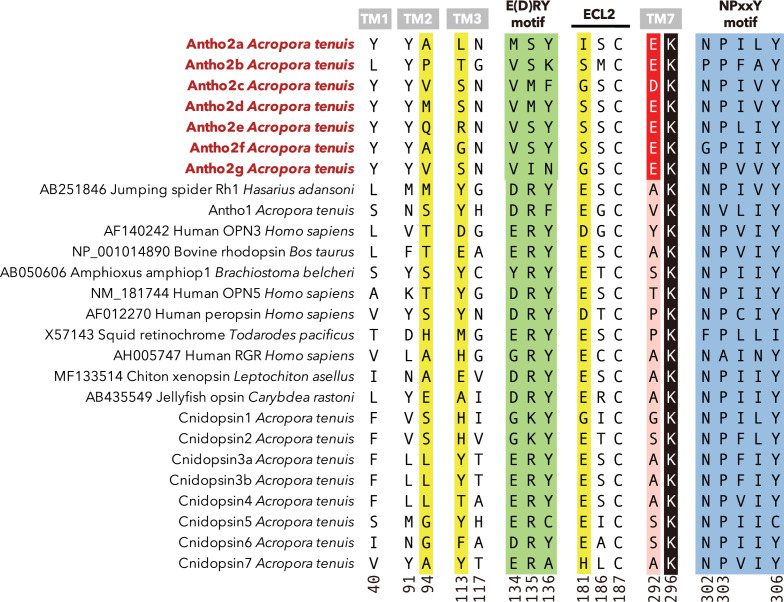
Figure 1—figure supplement 2. Key residues in opsins of the anthozoan-specific opsin II (ASO-II) group and other animal opsins. Residues near the Schiff base were selected with reference to the crystal structure of bovine rhodopsin (PDB ID: 1U19) and the homology model of Antho2a (shown in Figure 4). Position 292 contains an acidic residue (D/E) only in opsins of the ASO-II group (red). In addition, functionally important residues (such as the retinal binding Lys296 [black], the three established counterion sites [yellow], and two highly conserved motifs in Class A G protein-coupled receptors [GPCRs], E(D)RY on TM3 [green] and NPxxY on TM7 [blue]) are also shown. Residues are numbered according to bovine rhodopsin.
Figure 1—figure supplement 2. Key residues in opsins of the anthozoan-specific opsin II (ASO-II) group and other animal opsins. Residues near the Schiff base were selected with reference to the crystal structure of bovine rhodopsin (PDB ID: 1U19) and the homology model of Antho2a (shown in Figure 4). Position 292 contains an acidic residue (D/E) only in opsins of the ASO-II group (red). In addition, functionally important residues (such as the retinal binding Lys296 [black], the three established counterion sites [yellow], and two highly conserved motifs in Class A G protein-coupled receptors [GPCRs], E(D)RY on TM3 [green] and NPxxY on TM7 [blue]) are also shown. Residues are numbered according to bovine rhodopsin.CC BY · PubMed Central
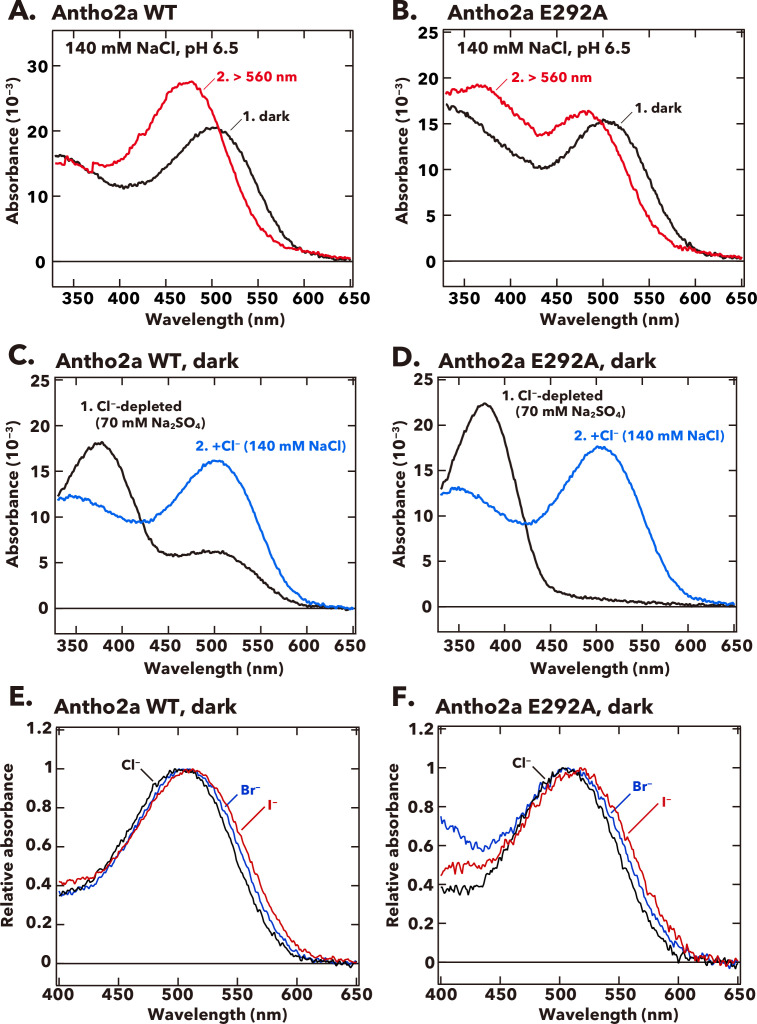
Figure 2. Absorption spectra of wild-type and the E292A mutant of A. tenuis Antho2a. (A, B) Absorption spectra of the dark state (curve 1, black) and the photoproduct (curve 2, red) of the wild-type (Antho2a WT, A) and the E292A mutant (Antho2a E292A, B) at 140 mM NaCl and pH 6.5. The samples were kept at 0°C during the spectroscopic measurements. (C, D) Absorption spectra of the dark state of Antho2a WT (C) and Antho2a E292A (D) prepared in Cl−-depleted conditions, before (curve 1, black) and after (curve 2, blue) adding Cl− (see Materials and methods for details). In the Cl−-depleted condition, the pigments were solubilized in 70 mM Na2SO4, which reportedly does not access to the Cl− binding site in the chicken red-sensitive cone visual pigment iodosin (Shichida et al., 1990) to moderate protein denaturation. (E, F) Effect of halide anions on the absorption spectra of wild-type Antho2a (E) and the Antho2a E292A mutant (F) at pH 6.5 and 0°C. The graphic shows the normalized absorption spectra of the pigments prepared in 140 mM NaCl (black curves), 140 mM NaBr (blue curves), and 140 mM NaI (red curves).
Figure 2. Absorption spectra of wild-type and the E292A mutant of A. tenuis Antho2a. (A, B) Absorption spectra of the dark state (curve 1, black) and the photoproduct (curve 2, red) of the wild-type (Antho2a WT, A) and the E292A mutant (Antho2a E292A, B) at 140 mM NaCl and pH 6.5. The samples were kept at 0°C during the spectroscopic measurements. (C, D) Absorption spectra of the dark state of Antho2a WT (C) and Antho2a E292A (D) prepared in Cl−-depleted conditions, before (curve 1, black) and after (curve 2, blue) adding Cl− (see Materials and methods for details). In the Cl−-depleted condition, the pigments were solubilized in 70 mM Na2SO4, which reportedly does not access to the Cl− binding site in the chicken red-sensitive cone visual pigment iodosin (Shichida et al., 1990) to moderate protein denaturation. (E, F) Effect of halide anions on the absorption spectra of wild-type Antho2a (E) and the Antho2a E292A mutant (F) at pH 6.5 and 0°C. The graphic shows the normalized absorption spectra of the pigments prepared in 140 mM NaCl (black curves), 140 mM NaBr (blue curves), and 140 mM NaI (red curves).CC BY · PubMed Central
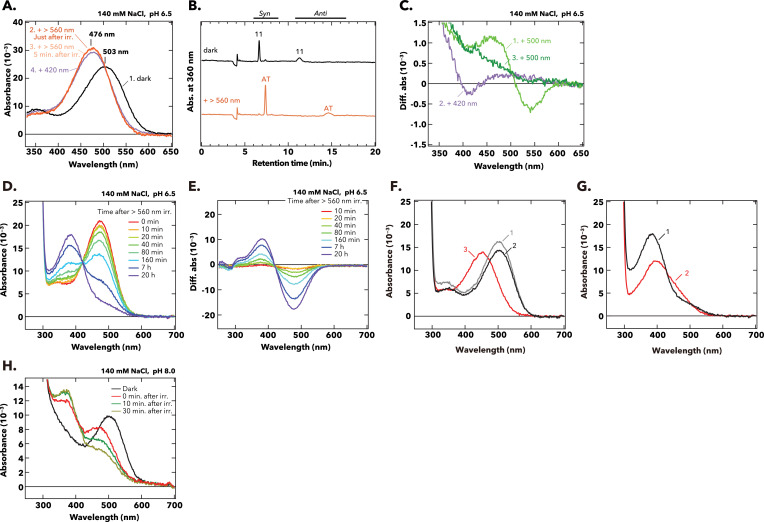
Figure 2—figure supplement 1. Photo- and thermal reactions of wild-type Antho2a. (A) Absorption spectra of purified wild-type Antho2a were measured at 0°C in the dark (curve 1, black), after orange light irradiation (>560 nm, curve 2 and curve 3, deep and pale orange), and after subsequent violet light irradiation (420 nm, curve 4, purple). Irradiation of wild-type Antho2a with orange light shifted the absorption maximum from 503 nm in the dark (curve 1, black) to 476 nm in the photoproduct (curve 2 and curve 3, orange). Upon subsequent irradiation with 420 nm light (while the photoproduct was stable), the λmax of the photoproduct stayed at 476 nm, with only a slight decrease of the peak absorbance (curve 4, purple) possibly resulting from degradation of the photoproducts upon light irradiation. (B) The configuration of retinal in wild-type Antho2a before (black) and after (orange) irradiation with orange light (>560 nm) was analyzed with HPLC. Retinal was extracted in its oxime form. AT, all-trans retinal; 11, 11-cis retinal. (C) Difference spectra calculated from the absorption spectra recorded before and after sequential irradiations with 500 nm and 420 nm light for crude extracts of detergent-solubilized cell membranes expressing wild-type Antho2a. Curve 1: Difference spectrum of after minus before 500 nm irradiation, showing a blue-shifted spectral change indicative of photoproduct formation. Curves 2 and 3: Difference spectra of after minus before subsequent 420 nm light irradiation (curve 2), and after minus before a second 500 nm light irradiation, following the 420 nm irradiation (curve 3). Neither condition resulted in spectral changes consistent with regeneration of the dark state, indicating that Antho2a is not bistable under these conditions. (D) Changes in the absorption spectra of the purified pigment of wild-type Antho2a after irradiation with orange (>560 nm) light (with the sample kept in the dark at 0°C). Each colored curve corresponds to a different incubation time after the light irradiation. (E) Difference spectra obtained by subtracting the spectrum of wild-type Antho2a in the dark from the spectra measured at different time points after irradiation (shown in D). (F, G) Acid denaturation of pigments before (dark state, F) and after light irradiation (G). (F) Absorption spectra of wild-type Antho2a in the dark were measured immediately after sample preparation at pH 6.5 (curve 1), and after incubation overnight at 0°C (curve 2, pH 6.5) with subsequent addition of HCl to pH 1.9 (curve 3). (G) Absorption spectra of wild-type Antho2a incubated for 20 hr at 0°C following irradiation with orange light (>560 nm), measured at pH 6.5 (curve 1) and after acidification to pH 1.9 (curve 2). When retinal binds to opsin via a Schiff base (protonated or deprotonated), acid denaturation traps the chromophore as a protonated Schiff base, exhibiting absorption at λmax ~440 nm. Acid denaturation of irradiated Antho2a (incubated for 20 hr post-irradiation) did not yield a product with λmax at ~440 nm (G, curve 2), whereas the dark state pigment after acidification displayed absorption at ~440 nm (F, curve 3). These results indicate that Antho2a gradually releases retinal after light irradiation. (H) Absorption spectra of purified wild-type Antho2a at pH 8.0, measured at 0°C before (dark state; curve 1, black) and 0, 10, and 30 min after irradiation with orange light (>560 nm; red, green, and yellow curves, respectively).
Figure 2—figure supplement 1. Photo- and thermal reactions of wild-type Antho2a. (A) Absorption spectra of purified wild-type Antho2a were measured at 0°C in the dark (curve 1, black), after orange light irradiation (>560 nm, curve 2 and curve 3, deep and pale orange), and after subsequent violet light irradiation (420 nm, curve 4, purple). Irradiation of wild-type Antho2a with orange light shifted the absorption maximum from 503 nm in the dark (curve 1, black) to 476 nm in the photoproduct (curve 2 and curve 3, orange). Upon subsequent irradiation with 420 nm light (while the photoproduct was stable), the λmax of the photoproduct stayed at 476 nm, with only a slight decrease of the peak absorbance (curve 4, purple) possibly resulting from degradation of the photoproducts upon light irradiation. (B) The configuration of retinal in wild-type Antho2a before (black) and after (orange) irradiation with orange light (>560 nm) was analyzed with HPLC. Retinal was extracted in its oxime form. AT, all-trans retinal; 11, 11-cis retinal. (C) Difference spectra calculated from the absorption spectra recorded before and after sequential irradiations with 500 nm and 420 nm light for crude extracts of detergent-solubilized cell membranes expressing wild-type Antho2a. Curve 1: Difference spectrum of after minus before 500 nm irradiation, showing a blue-shifted spectral change indicative of photoproduct formation. Curves 2 and 3: Difference spectra of after minus before subsequent 420 nm light irradiation (curve 2), and after minus before a second 500 nm light irradiation, following the 420 nm irradiation (curve 3). Neither condition resulted in spectral changes consistent with regeneration of the dark state, indicating that Antho2a is not bistable under these conditions. (D) Changes in the absorption spectra of the purified pigment of wild-type Antho2a after irradiation with orange (>560 nm) light (with the sample kept in the dark at 0°C). Each colored curve corresponds to a different incubation time after the light irradiation. (E) Difference spectra obtained by subtracting the spectrum of wild-type Antho2a in the dark from the spectra measured at different time points after irradiation (shown in D). (F, G) Acid denaturation of pigments before (dark state, F) and after light irradiation (G). (F) Absorption spectra of wild-type Antho2a in the dark were measured immediately after sample preparation at pH 6.5 (curve 1), and after incubation overnight at 0°C (curve 2, pH 6.5) with subsequent addition of HCl to pH 1.9 (curve 3). (G) Absorption spectra of wild-type Antho2a incubated for 20 hr at 0°C following irradiation with orange light (>560 nm), measured at pH 6.5 (curve 1) and after acidification to pH 1.9 (curve 2). When retinal binds to opsin via a Schiff base (protonated or deprotonated), acid denaturation traps the chromophore as a protonated Schiff base, exhibiting absorption at λmax ~440 nm. Acid denaturation of irradiated Antho2a (incubated for 20 hr post-irradiation) did not yield a product with λmax at ~440 nm (G, curve 2), whereas the dark state pigment after acidification displayed absorption at ~440 nm (F, curve 3). These results indicate that Antho2a gradually releases retinal after light irradiation. (H) Absorption spectra of purified wild-type Antho2a at pH 8.0, measured at 0°C before (dark state; curve 1, black) and 0, 10, and 30 min after irradiation with orange light (>560 nm; red, green, and yellow curves, respectively).CC BY · PubMed Central
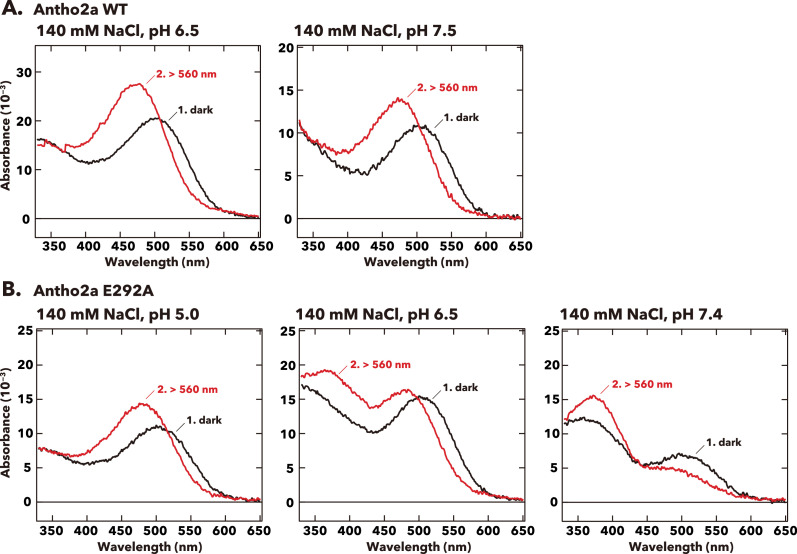
Figure 2—figure supplement 2. Effect of pH on the absorption spectra of the dark states and photoproducts of Antho2a. Absorption spectra of the dark state and photoproduct of (A) wild-type Antho2a and (B) the E292A mutant were measured at various pH conditions with keeping the NaCl concentration at 140 mM. Each graph shows spectra before (curves 1, black) and after (curves 2, red) irradiation with orange (>560 nm) light.
Figure 2—figure supplement 2. Effect of pH on the absorption spectra of the dark states and photoproducts of Antho2a. Absorption spectra of the dark state and photoproduct of (A) wild-type Antho2a and (B) the E292A mutant were measured at various pH conditions with keeping the NaCl concentration at 140 mM. Each graph shows spectra before (curves 1, black) and after (curves 2, red) irradiation with orange (>560 nm) light.CC BY · PubMed Central
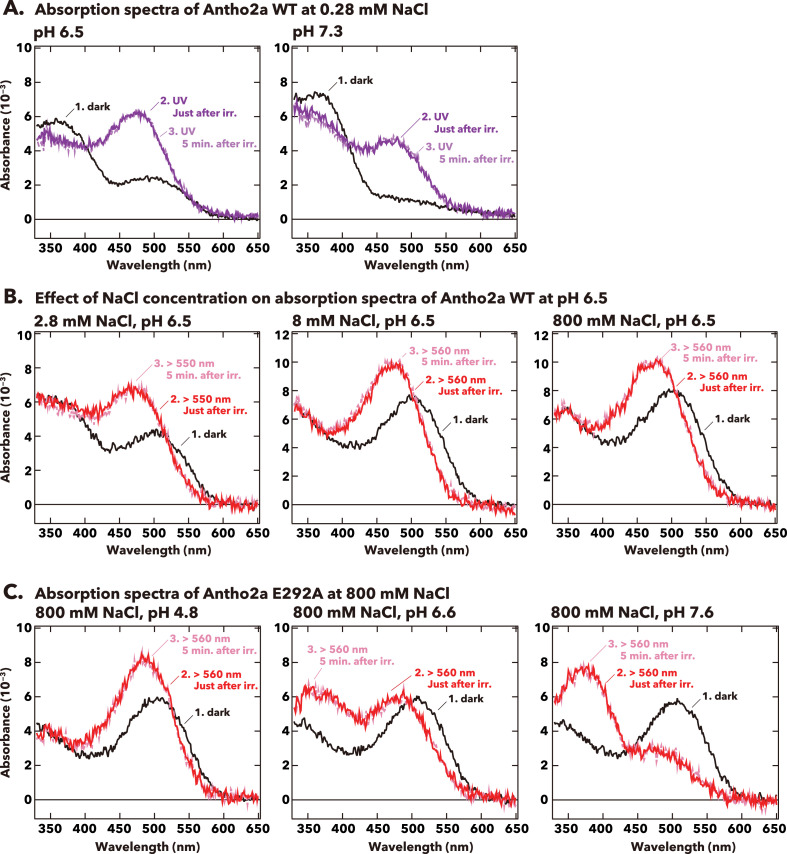
Figure 2—figure supplement 3. Effect of pH and NaCl concentration on absorption spectra of the dark states and photoproducts of Antho2a. (A) Absorption spectra of wild-type Antho2a at 0.28 mM NaCl under different pH conditions (pH 6.5 and pH 7.3). (B) Absorption spectra of wild-type Antho2a at pH 6.5 with varying NaCl concentrations (2.8 mM, 8 mM, and 800 mM). (C) Absorption spectra of the E292A mutant of Antho2a at 800 mM NaCl and different pH conditions (pH 4.8, pH 6.6, and pH 7.6). Each graph shows spectra before (curves 1, black) and after (curves 2, deep purple/red, and 3, pale purple/pink) irradiation with UV light (<410 nm, A) or orange light (>550 nm or >560 nm, B and C). Curves 2 and 3 in each graph represent, respectively, the first measurement (immediately after irradiation) and a subsequent measurement (<5 min after irradiation). The minimal change in the absorption spectra over this timescale indicates that the spectra remain stable after irradiation.
Figure 2—figure supplement 3. Effect of pH and NaCl concentration on absorption spectra of the dark states and photoproducts of Antho2a. (A) Absorption spectra of wild-type Antho2a at 0.28 mM NaCl under different pH conditions (pH 6.5 and pH 7.3). (B) Absorption spectra of wild-type Antho2a at pH 6.5 with varying NaCl concentrations (2.8 mM, 8 mM, and 800 mM). (C) Absorption spectra of the E292A mutant of Antho2a at 800 mM NaCl and different pH conditions (pH 4.8, pH 6.6, and pH 7.6). Each graph shows spectra before (curves 1, black) and after (curves 2, deep purple/red, and 3, pale purple/pink) irradiation with UV light (<410 nm, A) or orange light (>550 nm or >560 nm, B and C). Curves 2 and 3 in each graph represent, respectively, the first measurement (immediately after irradiation) and a subsequent measurement (<5 min after irradiation). The minimal change in the absorption spectra over this timescale indicates that the spectra remain stable after irradiation.CC BY · PubMed Central
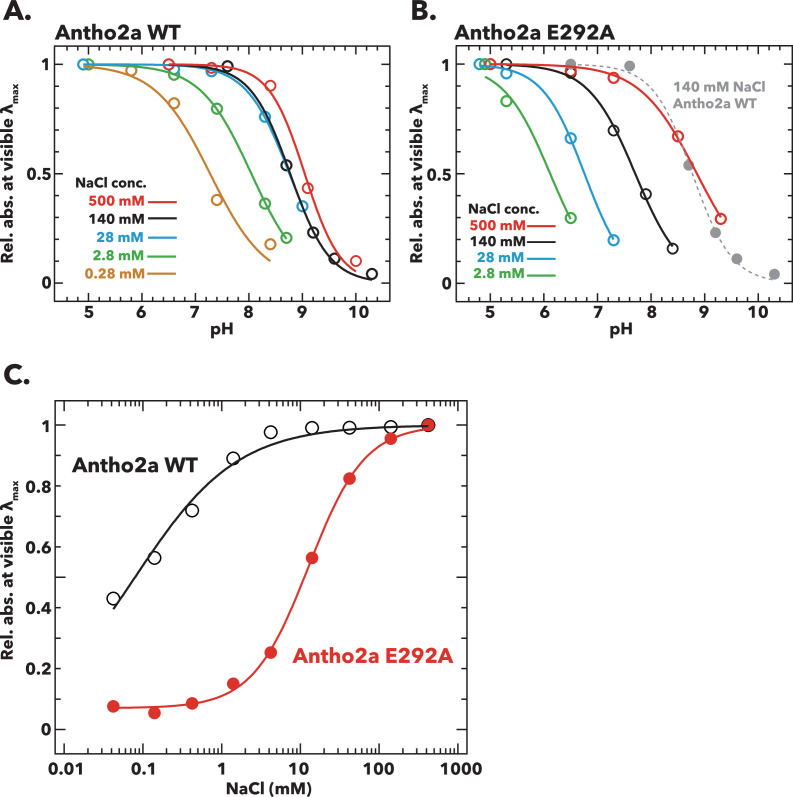
Figure 3. Effects of pH and Cl− concentration on the absorption spectra of the dark states of wild-type Antho2a and the Antho2a E292A mutant. (A, B) Changes in the absorbance at λmax as a function of pH for (A) wild-type Antho2a and (B) the E292A mutant at different Cl− concentrations. The absorbance values at ‘visible λmax’ (mean absorbance at 503±5 nm for the wild type and 505±5 nm for the E292A mutant, respectively) were normalized for each Cl− concentration to those at the lowest pH, in which the Schiff base is assumed to be fully protonated (‘Rel. abs. at visible λmax’ in the y-axes). Solid and dashed lines represent sigmoid fits to the experimental data for each Cl− concentration (indicated by different colors). The pH-dependent change of wild-type Antho2a at 140 mM NaCl is also shown in panel B (dotted gray line). The full absorption spectra used to generate these plots are provided in Figure 3—figure supplement 1 (for wild-type Antho2a) and Figure 3—figure supplement 3 (for the E292A mutant). (C) Changes in the absorbance at λmax for wild-type Antho2a (black open circles) and the E292A mutant (red solid circles) as a function of Cl− concentration. The absorbance values at visible λmax were normalized to those at 500 mM NaCl for both the wild type and the E292A mutant. The lines in the graph were generated by fitting the Hill equation to the experimental data. The full absorption spectra used to generate these plots are provided in Figure 3—figure supplement 4.
Figure 3. Effects of pH and Cl− concentration on the absorption spectra of the dark states of wild-type Antho2a and the Antho2a E292A mutant. (A, B) Changes in the absorbance at λmax as a function of pH for (A) wild-type Antho2a and (B) the E292A mutant at different Cl− concentrations. The absorbance values at ‘visible λmax’ (mean absorbance at 503±5 nm for the wild type and 505±5 nm for the E292A mutant, respectively) were normalized for each Cl− concentration to those at the lowest pH, in which the Schiff base is assumed to be fully protonated (‘Rel. abs. at visible λmax’ in the y-axes). Solid and dashed lines represent sigmoid fits to the experimental data for each Cl− concentration (indicated by different colors). The pH-dependent change of wild-type Antho2a at 140 mM NaCl is also shown in panel B (dotted gray line). The full absorption spectra used to generate these plots are provided in Figure 3—figure supplement 1 (for wild-type Antho2a) and Figure 3—figure supplement 3 (for the E292A mutant). (C) Changes in the absorbance at λmax for wild-type Antho2a (black open circles) and the E292A mutant (red solid circles) as a function of Cl− concentration. The absorbance values at visible λmax were normalized to those at 500 mM NaCl for both the wild type and the E292A mutant. The lines in the graph were generated by fitting the Hill equation to the experimental data. The full absorption spectra used to generate these plots are provided in Figure 3—figure supplement 4.CC BY · PubMed Central
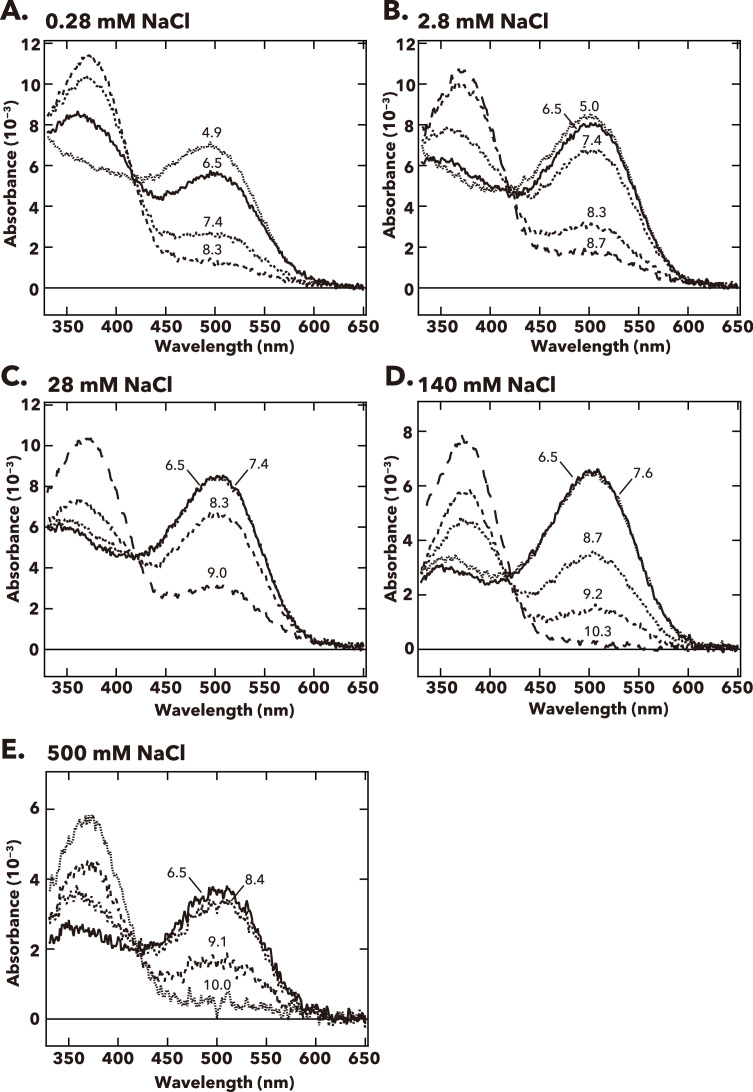
Figure 3—figure supplement 1. pH-dependent changes in the absorption spectra of Antho2a wild type (WT) at (A) 0.28 mM, (B) 2.8 mM, (C) 28 mM, (D) 140 mM, and (E) 500 mM Cl− at 0°C. The pH values of the solution, measured right after each spectroscopic measurement, are indicated on the corresponding curves in each graph.
Figure 3—figure supplement 1. pH-dependent changes in the absorption spectra of Antho2a wild type (WT) at (A) 0.28 mM, (B) 2.8 mM, (C) 28 mM, (D) 140 mM, and (E) 500 mM Cl− at 0°C. The pH values of the solution, measured right after each spectroscopic measurement, are indicated on the corresponding curves in each graph.CC BY · PubMed Central
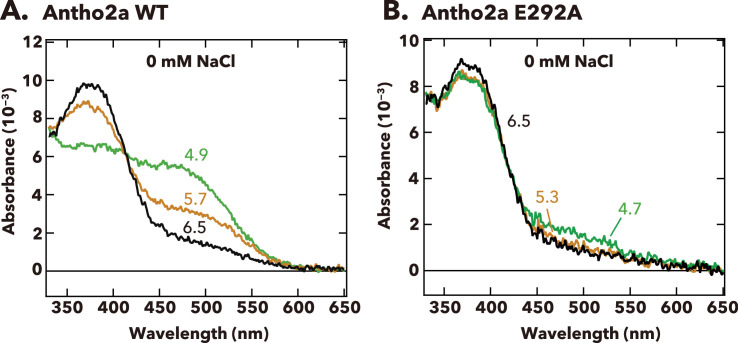
Figure 3—figure supplement 2. pH-dependent changes in the absorption spectra of Antho2a wild type (WT) and Antho2a E292A at 0 mM NaCl (containing 70 mM Na2SO4) at 0°C. The pH values at which the absorption spectra were measured are indicated on the corresponding curves.
Figure 3—figure supplement 2. pH-dependent changes in the absorption spectra of Antho2a wild type (WT) and Antho2a E292A at 0 mM NaCl (containing 70 mM Na2SO4) at 0°C. The pH values at which the absorption spectra were measured are indicated on the corresponding curves.CC BY · PubMed Central
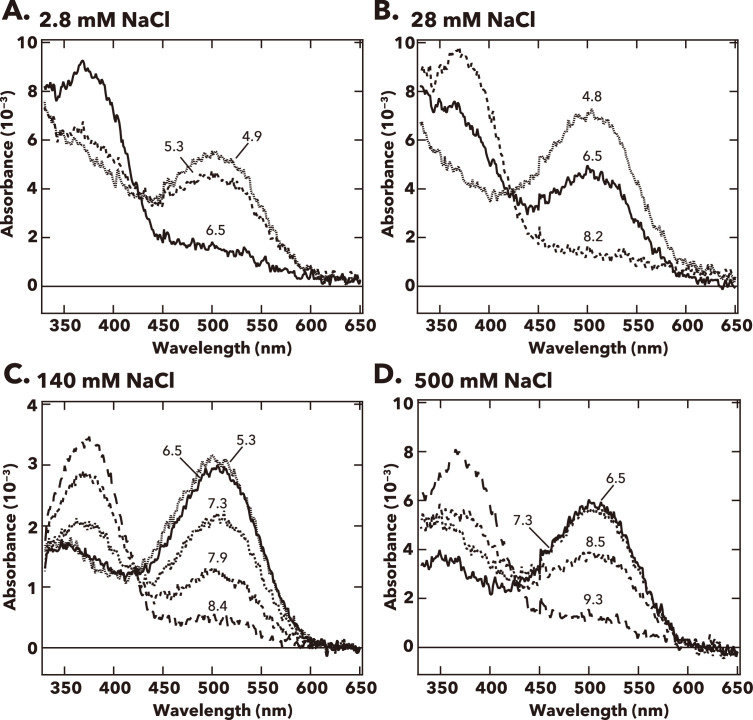
Figure 3—figure supplement 3. pH-dependent changes in the absorption spectra of Antho2a E292A at (A) 2.8 mM, (B) 28 mM, (C) 140 mM, and (D) 500 mM Cl− at 0°C. The pH values are indicated on the corresponding curves in each graph.
Figure 3—figure supplement 3. pH-dependent changes in the absorption spectra of Antho2a E292A at (A) 2.8 mM, (B) 28 mM, (C) 140 mM, and (D) 500 mM Cl− at 0°C. The pH values are indicated on the corresponding curves in each graph.CC BY · PubMed Central
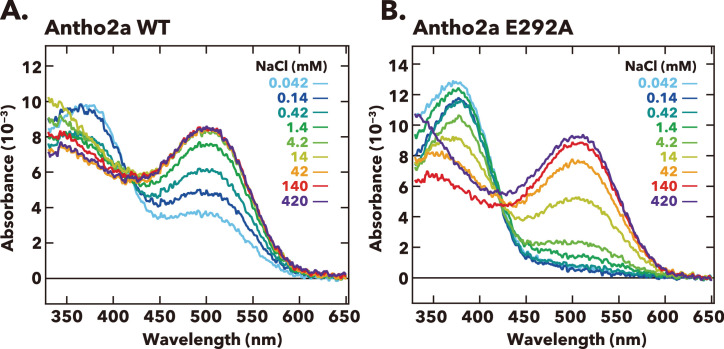
Figure 3—figure supplement 4. Absorption spectra of (A) wild-type Antho2a and (B) the Antho2a E292A mutant under different Cl− concentrations at pH 6.5 and 0°C. Each color indicates a different concentration of Cl−.
Figure 3—figure supplement 4. Absorption spectra of (A) wild-type Antho2a and (B) the Antho2a E292A mutant under different Cl− concentrations at pH 6.5 and 0°C. Each color indicates a different concentration of Cl−.CC BY · PubMed Central
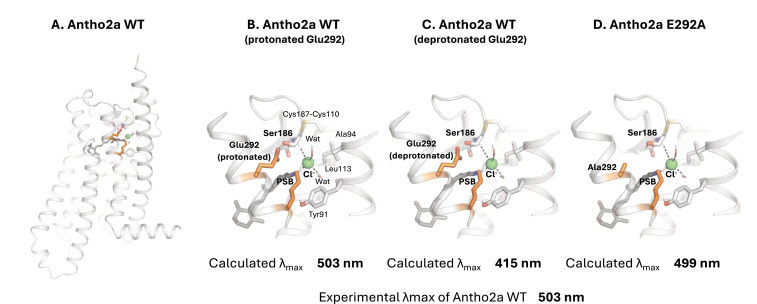
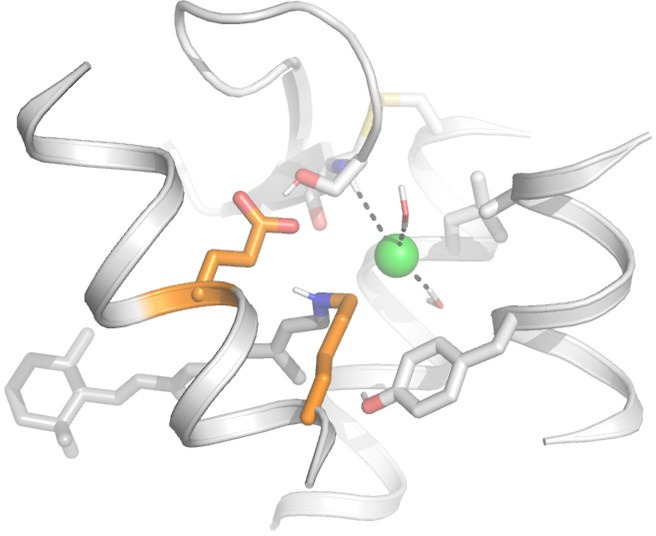
Figure 4. Quantum mechanics/molecular mechanics (QM/MM) structural model of wild-type Antho2a in the dark state (A) and detailed views of the retinal binding pocket with a protonated (neutral) Glu292 (B), a deprotonated (negatively charged) Glu292 (C), and the E292A mutant (D). The retinal protonated Schiff base (PSB) and the binding pocket residues are shown as sticks (including polar hydrogens) and the Cl− ion as a sphere with its coordination shown as dashes. ‘Wat’ indicates a water molecule. Residues in the QM region are marked in bold.
Figure 4. Quantum mechanics/molecular mechanics (QM/MM) structural model of wild-type Antho2a in the dark state (A) and detailed views of the retinal binding pocket with a protonated (neutral) Glu292 (B), a deprotonated (negatively charged) Glu292 (C), and the E292A mutant (D). The retinal protonated Schiff base (PSB) and the binding pocket residues are shown as sticks (including polar hydrogens) and the Cl− ion as a sphere with its coordination shown as dashes. ‘Wat’ indicates a water molecule. Residues in the QM region are marked in bold.CC BY · PubMed Central
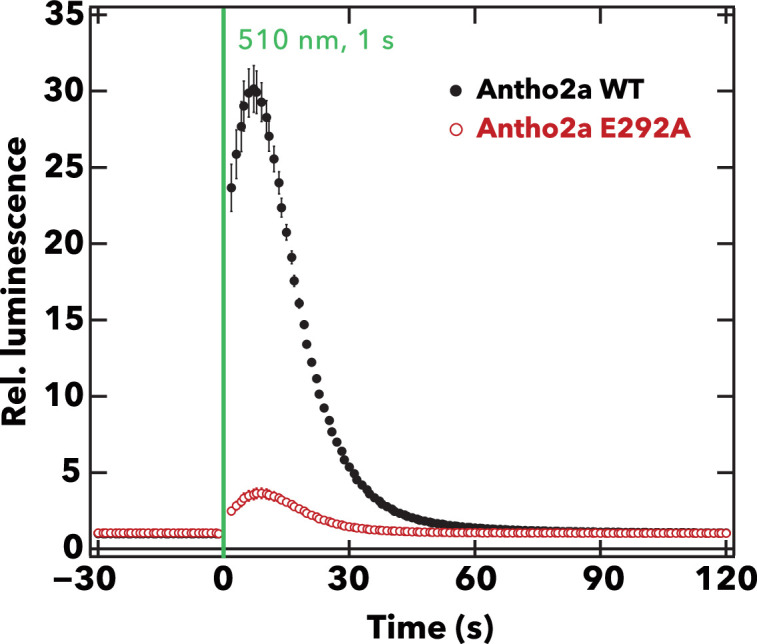
Figure 5. Comparison of the light-evoked intracellular Ca2+ levels between wild-type Antho2a and the E292A mutant. The graph shows the mean ± SEM (n=4) of the measured relative luminescence values (luminescence values normalized to the baseline) for wild-type Antho2a (black) and the E292A mutant (red) at pH 7.0. The green vertical line indicates the time of cell illumination with green light (510 nm, for 1 s, 1.65×10¹⁵ photons/cm2/s).
Figure 5. Comparison of the light-evoked intracellular Ca2+ levels between wild-type Antho2a and the E292A mutant. The graph shows the mean ± SEM (n=4) of the measured relative luminescence values (luminescence values normalized to the baseline) for wild-type Antho2a (black) and the E292A mutant (red) at pH 7.0. The green vertical line indicates the time of cell illumination with green light (510 nm, for 1 s, 1.65×10¹⁵ photons/cm2/s).CC BY · PubMed Central
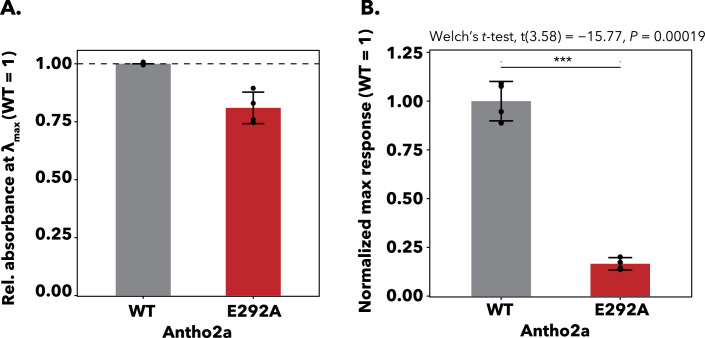
Figure 5—figure supplement 1. Expression levels and normalized Ca2+ responses of wild-type and E292A Antho2a. (A) The relative absorbances at λmax (± 5 nm) of wild-type (gray) and E292A (red) Antho2a are used as indicators of expression levels. The proteins were expressed and purified under identical conditions, and absorbance values of the E292A mutant were normalized to those of the wild type. Spectra were measured at 0°C, pH 6.5, and 140 mM NaCl. Each bar represents mean ± SEM of n = 4 replicates from separate transfections in cultured cells. (B) Normalized maximum Ca2+ responses of HEK293S cells expressing wild-type Antho2a and the E292A mutant after irradiation with green light (510 nm). Responses were normalized to the expression levels shown in panel A. Each bar represents mean ± SEM of n = 4 replicates from separate transfections in cultured cells. Statistical evaluation of the normalized Ca2+ responses for wild-type Antho2a versus the E292A mutant was conducted using a Welch’s t-test (two-sided). ***p<0.001.
Figure 5—figure supplement 1. Expression levels and normalized Ca2+ responses of wild-type and E292A Antho2a. (A) The relative absorbances at λmax (± 5 nm) of wild-type (gray) and E292A (red) Antho2a are used as indicators of expression levels. The proteins were expressed and purified under identical conditions, and absorbance values of the E292A mutant were normalized to those of the wild type. Spectra were measured at 0°C, pH 6.5, and 140 mM NaCl. Each bar represents mean ± SEM of n = 4 replicates from separate transfections in cultured cells. (B) Normalized maximum Ca2+ responses of HEK293S cells expressing wild-type Antho2a and the E292A mutant after irradiation with green light (510 nm). Responses were normalized to the expression levels shown in panel A. Each bar represents mean ± SEM of n = 4 replicates from separate transfections in cultured cells. Statistical evaluation of the normalized Ca2+ responses for wild-type Antho2a versus the E292A mutant was conducted using a Welch’s t-test (two-sided). ***p<0.001.CC BY · PubMed Central
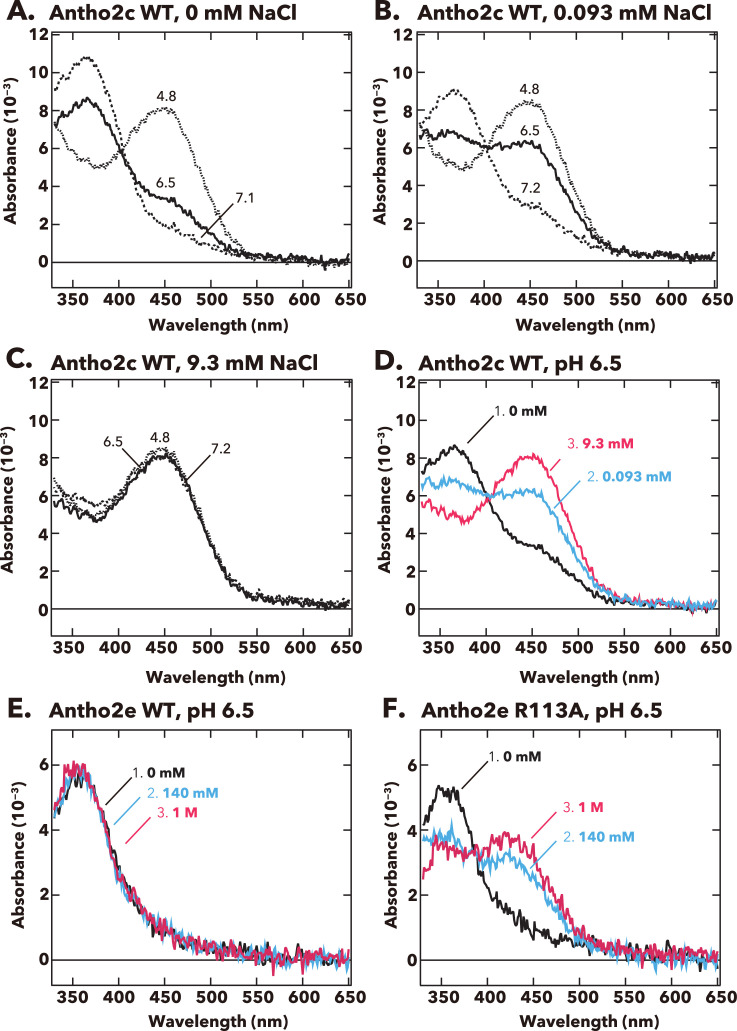
Figure 6. pH-dependent changes in the absorption spectra of Antho2c and Antho2e at different Cl− concentrations at 0°C. (A–C) Absorption spectra of purified wild-type Antho2c pigment at (A) 0 mM, (B) 0.093 mM, and (C) 9.3 mM NaCl concentrations. The corresponding pH values are indicated on each curve in the graphs. (D) Summary of the spectral changes for wild-type Antho2c across different Cl− concentrations at neutral pH (pH 6.5). (E, F) Absorption spectra of (E) wild-type Antho2e (Antho2e WT) and (F) its R113A mutant (Antho2e R113A) at different Cl− concentrations at pH 6.5 at 0°C. Each color indicates a different Cl− concentration.
Figure 6. pH-dependent changes in the absorption spectra of Antho2c and Antho2e at different Cl− concentrations at 0°C. (A–C) Absorption spectra of purified wild-type Antho2c pigment at (A) 0 mM, (B) 0.093 mM, and (C) 9.3 mM NaCl concentrations. The corresponding pH values are indicated on each curve in the graphs. (D) Summary of the spectral changes for wild-type Antho2c across different Cl− concentrations at neutral pH (pH 6.5). (E, F) Absorption spectra of (E) wild-type Antho2e (Antho2e WT) and (F) its R113A mutant (Antho2e R113A) at different Cl− concentrations at pH 6.5 at 0°C. Each color indicates a different Cl− concentration.CC BY · PubMed Central
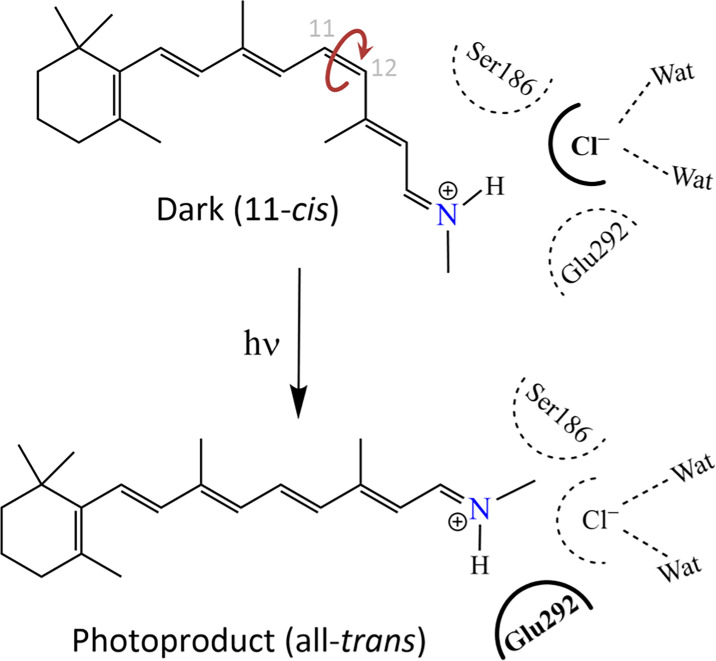
Figure 7. Schematic drawing of the environment of the protonated Schiff base depicting the counterion switch from a chloride ion (top) to Glu292 (bottom) upon light activation.
Figure 7. Schematic drawing of the environment of the protonated Schiff base depicting the counterion switch from a chloride ion (top) to Glu292 (bottom) upon light activation.CC BY · PubMed Central
Author response image 1.
Author response image 1. CC BY · PubMed Central

Verification

Claims the paper makes

The claims and statistics of this paper haven’t been checked yet.

Run the check — free, no account needed. It reads the open-access text and checks the sources it cites.

A few free checks a day · papers already verified open instantly · results are public

Self-check

Percentages, sums and reported differences re-computed from the paper’s own numbers.

The self-check needs the paper’s full text.

Citations

Cites

Show all 83 references

Research works printed but not linked: 17

  1. Case, 2016, AMBER 2016
  2. Sakai Y, Sen S, Sugihara T, Kakeyama Y, Iwasaki M, Schertler GFX, Deupi X, Koyanagi M, Terakita A. 2025. Acropora tenuis Cnidopsin1 CDS. NCBI Nucleotide. https://www.ncbi.nlm.nih.gov/nuccore/?term=LC844924. LC844924.
  3. Sakai Y, Sen S, Sugihara T, Kakeyama Y, Iwasaki M, Schertler GFX, Deupi X, Koyanagi M, Terakita A. 2025. Acropora tenuis Cnidopsin2 CDS. NCBI Nucleotide. https://www.ncbi.nlm.nih.gov/nuccore/?term=LC844925. LC844925.
  4. Sakai Y, Sen S, Sugihara T, Kakeyama Y, Iwasaki M, Schertler GFX, Deupi X, Koyanagi M, Terakita A. 2025. Acropora tenuis Cnidopsin3a CDS. NCBI Nucleotide. https://www.ncbi.nlm.nih.gov/nuccore/?term=LC844926. LC844926.
  5. Sakai Y, Sen S, Sugihara T, Kakeyama Y, Iwasaki M, Schertler GFX, Deupi X, Koyanagi M, Terakita A. 2025. Acropora tenuis Cnidopsin3b CDS. NCBI Nucleotide. https://www.ncbi.nlm.nih.gov/nuccore/?term=LC844927. LC844927.
  6. Sakai Y, Sen S, Sugihara T, Kakeyama Y, Iwasaki M, Schertler GFX, Deupi X, Koyanagi M, Terakita A. 2025. Acropora tenuis Cnidopsin4 CDS. NCBI Nucleotide. https://www.ncbi.nlm.nih.gov/nuccore/?term=LC844928. LC844928.
  7. Sakai Y, Sen S, Sugihara T, Kakeyama Y, Iwasaki M, Schertler GFX, Deupi X, Koyanagi M, Terakita A. 2025. Acropora tenuis Cnidopsin5 CDS. NCBI Nucleotide. https://www.ncbi.nlm.nih.gov/nuccore/?term=LC844929. LC844929.
  8. Sakai Y, Sen S, Sugihara T, Kakeyama Y, Iwasaki M, Schertler GFX, Deupi X, Koyanagi M, Terakita A. 2025. Acropora tenuis Cnidopsin6 CDS. NCBI Nucleotide. https://www.ncbi.nlm.nih.gov/nuccore/?term=LC844930. LC844930.
  9. Sakai Y, Sen S, Sugihara T, Kakeyama Y, Iwasaki M, Schertler GFX, Deupi X, Koyanagi M, Terakita A. 2025. Acropora tenuis Cnidopsin7 CDS. NCBI Nucleotide. https://www.ncbi.nlm.nih.gov/nuccore/?term=LC844931. LC844931.
  10. Sakai Y, Sen S, Sugihara T, Kakeyama Y, Iwasaki M, Schertler GFX, Deupi X, Koyanagi M, Terakita A. 2025. Acropora tenuis Antho2a CDS. NCBI Nucleotide. https://www.ncbi.nlm.nih.gov/nuccore/?term=LC844932. LC844932.
  11. Sakai Y, Sen S, Sugihara T, Kakeyama Y, Iwasaki M, Schertler GFX, Deupi X, Koyanagi M, Terakita A. 2025. Acropora tenuis Antho2b CDS. NCBI Nucleotide. https://www.ncbi.nlm.nih.gov/nuccore/?term=LC844933. LC844933.
  12. Sakai Y, Sen S, Sugihara T, Kakeyama Y, Iwasaki M, Schertler GFX, Deupi X, Koyanagi M, Terakita A. 2025. Acropora tenuis Antho2c CDS. NCBI Nucleotide. https://www.ncbi.nlm.nih.gov/nuccore/?term=LC844934. LC844934.
  13. Sakai Y, Sen S, Sugihara T, Kakeyama Y, Iwasaki M, Schertler GFX, Deupi X, Koyanagi M, Terakita A. 2025. Acropora tenuis Antho2d CDS. NCBI Nucleotide. https://www.ncbi.nlm.nih.gov/nuccore/?term=LC844935. LC844935.
  14. Sakai Y, Sen S, Sugihara T, Kakeyama Y, Iwasaki M, Schertler GFX, Deupi X, Koyanagi M, Terakita A. 2025. Acropora tenuis Antho2e CDS. NCBI Nucleotide. https://www.ncbi.nlm.nih.gov/nuccore/?term=LC844936. LC844936.
  15. Sakai Y, Sen S, Sugihara T, Kakeyama Y, Iwasaki M, Schertler GFX, Deupi X, Koyanagi M, Terakita A. 2025. Acropora tenuis Antho2f CDS. NCBI Nucleotide. https://www.ncbi.nlm.nih.gov/nuccore/?term=LC844937. LC844937.
  16. Sakai Y, Sen S, Sugihara T, Kakeyama Y, Iwasaki M, Schertler GFX, Deupi X, Koyanagi M, Terakita A. 2025. Acropora tenuis Antho2g CDS. NCBI Nucleotide. https://www.ncbi.nlm.nih.gov/nuccore/?term=LC844938. LC844938.
  17. Sakai Y, Sen S, Sugihara T, Kakeyama Y, Iwasaki M, Schertler GFX, Deupi X, Koyanagi M, Terakita A. 2025. Acropora tenuis Antho1 CDS. NCBI Nucleotide. https://www.ncbi.nlm.nih.gov/nuccore/?term=LC844939. LC844939.

Metadata

Authors
Sakai, Y., Sen, S., Sugihara, T., Kakeyama, Y., Iwasaki, M., Schertler, G. F., Deupi, X., Koyanagi, M., & Terakita, A.
Affiliations
  • Osaka Metropolitan University (JP)
  • SIB Swiss Institute of Bioinformatics (CH)
  • Paul Scherrer Institute (CH)
  • Swiss Institute of Bioinformatics (SIB)
Corresponding author
  • Koyanagi, Mitsumasa
  • Terakita, Akihisa
Venue
eLife
Published
2025-09-01
Volume
14
ISSN
2050-084X (ISSN-L)
OpenAlex
W4408360919
Cited by
2
References
83
Citations by year
2025: 2
Type
posted content
Language
en
Open access
Locations
  • eLife (publishedVersion, cc-by)
  • Europe PMC (PubMed Central) (publishedVersion, cc-by)
  • PubMed (publishedVersion)
  • PubMed Central (publishedVersion, cc-by)
  • DORA PSI (Paul Scherrer Institute) (submittedVersion, cc-by)
  • DOAJ (DOAJ: Directory of Open Access Journals) (submittedVersion, cc-by-sa)
Funders
  • Ministry of Education, Culture, Sports, Science and Technology (Grants-in-Aid for Scientific Research 23H02516, Grants-in-Aid for Scientific Research 22H02663, Grants-in-Aid for Scientific Research JP20J01841)
  • Japan Science and Technology Agency (Core Research for Evolutional Science and Technology (CREST) Grant JPMJCR1753)
  • Swiss National Science Foundation (project grant 192780)
  • Horizon 2020 Framework Programme (10.3030/951644, Marie Skłodowska-Curie grant agreement 884104 (PSI-FELLOW-III-3i))
Topics
  • Life Sciences › Neuroscience › Cellular and Molecular Neuroscience › Photoreceptor and optogenetics research
  • Life Sciences › Biochemistry, Genetics and Molecular Biology › Molecular Biology › Receptor Mechanisms and Signaling
  • Physical Sciences › Materials Science › Materials Chemistry › Photochromic and Fluorescence Chemistry
Keywords
chloride counterion, Schiff base protonation, retinal chromophore, spectral tuning, G protein activation, photoproducts, G protein-coupled receptors, reef-building corals, photosensitivity
MeSH terms
Animals, Chlorides, Light, Protons, Schiff Bases, Anthozoa, Opsins

About these checks

Registry, retraction, Cites and statistics results are computed, not judged, with one exception: a printed reference that no index lists is read once by a model before it counts as a citation error. Claims are extracted by a model and kept only when their quote appears verbatim in the text; each cited source is then checked, with a model’s help, for whether it says what the claim relies on. Those verdicts can be wrong — read the claim’s quote and the cited source before relying on one.

Statistics and arithmetic are recomputed, not judged.

Confidence bands are shown only for fields calibrated on our annotated test set. None is calibrated yet, so no band is shown.

What counts as a claim ›How we measure confidence ›How we check this ›

Are you an author, or do you see a problem with this page? Request a review

How to cite

Cite CoChat for the checks on this page, and the paper for its own findings.

This page
CoChat. (2026). Citation check: Coral anthozoan-specific opsins employ a novel chloride counterion for spectral tuning. https://app.cochat.ai/papers/10.7554/elife.105451
The paper
Sakai, Y., Sen, S., Sugihara, T., Kakeyama, Y., Iwasaki, M., Schertler, G. F., Deupi, X., Koyanagi, M., & Terakita, A. (2025). Coral anthozoan-specific opsins employ a novel chloride counterion for spectral tuning. eLife. https://doi.org/10.7554/elife.105451

Data sources

Bibliographic data: Semantic Scholar, OpenAlex, Crossref.

Contains information from the Semantic Scholar Academic Graph Datasets, made available under the ODC Attribution License (ODC-BY 1.0).

Semantic Scholar’s data is described in: Kinney, R., et al. (2023). The Semantic Scholar Open Data Platform. arXiv:2301.10140.